Quantcast
Channel: Severalnines - clustercontrol
Viewing all 385 articles
Browse latest View live

PostgreSQL Load Balancing Using HAProxy & Keepalived

$
0
0

A proxy layer can be quite useful in increasing availability of your database tier. It may reduce the amount of code on the application side to handle database failures and replication topology changes. In this blog post we will discuss how to setup a HAProxy to work on top of PostgreSQL.

First things first - HAProxy works with databases as a network layer proxy. There is no understanding of the underlying, sometimes complex, topology. All HAProxy does is to send packets in round-robin fashion to defined backends. It does not inspect packets nor it understands protocol in which applications talk with PostgreSQL. As a result, there’s no way for the HAProxy to implement read/write split on a single port - it would require parsing of queries. As long as your application can split reads from writes and send them to different IPs or ports, you can implement R/W split using two backends. Let’s take a look at how it can be done.

HAProxy Configuration

Below you can find an example of two PostgreSQL backends configured in HAProxy.

listen  haproxy_10.0.0.101_3307_rw
        bind *:3307
        mode tcp
        timeout client  10800s
        timeout server  10800s
        tcp-check expect string master\ is\ running
        balance leastconn
        option tcp-check
        option allbackups
        default-server port 9201 inter 2s downinter 5s rise 3 fall 2 slowstart 60s maxconn 64 maxqueue 128 weight 100
        server 10.0.0.101 10.0.0.101:5432 check
        server 10.0.0.102 10.0.0.102:5432 check
        server 10.0.0.103 10.0.0.103:5432 check


listen  haproxy_10.0.0.101_3308_ro
        bind *:3308
        mode tcp
        timeout client  10800s
        timeout server  10800s
        tcp-check expect string is\ running.
        balance leastconn
        option tcp-check
        option allbackups
        default-server port 9201 inter 2s downinter 5s rise 3 fall 2 slowstart 60s maxconn 64 maxqueue 128 weight 100
        server 10.0.0.101 10.0.0.101:5432 check
        server 10.0.0.102 10.0.0.102:5432 check
        server 10.0.0.103 10.0.0.103:5432 check

As we can see, they use ports 3307 for writes and 3308 for reads. In this setup there are three servers - one active and two standby replicas. What’s important, tcp-check is used to track the health of the nodes. HAProxy will connect to port 9201 and it expects to see a string returned. Healthy members of the backend will return expected content, those who will not return the string will be marked as unavailable.

Xinetd Setup

As HAProxy checks port 9201, something has to listen on it. We can use xinetd to listen there and run some scripts for us. Example configuration of such service may look like:

# default: on
# description: postgreschk
service postgreschk
{
        flags           = REUSE
        socket_type     = stream
        port            = 9201
        wait            = no
        user            = root
        server          = /usr/local/sbin/postgreschk
        log_on_failure  += USERID
        disable         = no
        #only_from       = 0.0.0.0/0
        only_from       = 0.0.0.0/0
        per_source      = UNLIMITED
}

You need to make sure you add the line:

postgreschk        9201/tcp

to the /etc/services.

Xinetd starts a postgreschk script, which has contents like below:

#!/bin/bash
#
# This script checks if a PostgreSQL server is healthy running on localhost. It will
# return:
# "HTTP/1.x 200 OK\r" (if postgres is running smoothly)
# - OR -
# "HTTP/1.x 500 Internal Server Error\r" (else)
#
# The purpose of this script is make haproxy capable of monitoring PostgreSQL properly
#

export PGHOST='10.0.0.101'
export PGUSER='someuser'
export PGPASSWORD='somepassword'
export PGPORT='5432'
export PGDATABASE='postgres'
export PGCONNECT_TIMEOUT=10

FORCE_FAIL="/dev/shm/proxyoff"

SLAVE_CHECK="SELECT pg_is_in_recovery()"
WRITABLE_CHECK="SHOW transaction_read_only"

return_ok()
{
    echo -e "HTTP/1.1 200 OK\r\n"
    echo -e "Content-Type: text/html\r\n"
    if [ "$1x" == "masterx" ]; then
        echo -e "Content-Length: 56\r\n"
        echo -e "\r\n"
        echo -e "<html><body>PostgreSQL master is running.</body></html>\r\n"
    elif [ "$1x" == "slavex" ]; then
        echo -e "Content-Length: 55\r\n"
        echo -e "\r\n"
        echo -e "<html><body>PostgreSQL slave is running.</body></html>\r\n"
    else
        echo -e "Content-Length: 49\r\n"
        echo -e "\r\n"
        echo -e "<html><body>PostgreSQL is running.</body></html>\r\n"
    fi
    echo -e "\r\n"

    unset PGUSER
    unset PGPASSWORD
    exit 0
}

return_fail()
{
    echo -e "HTTP/1.1 503 Service Unavailable\r\n"
    echo -e "Content-Type: text/html\r\n"
    echo -e "Content-Length: 48\r\n"
    echo -e "\r\n"
    echo -e "<html><body>PostgreSQL is *down*.</body></html>\r\n"
    echo -e "\r\n"

    unset PGUSER
    unset PGPASSWORD
    exit 1
}

if [ -f "$FORCE_FAIL" ]; then
    return_fail;
fi

# check if in recovery mode (that means it is a 'slave')
SLAVE=$(psql -qt -c "$SLAVE_CHECK" 2>/dev/null)
if [ $? -ne 0 ]; then
    return_fail;
elif echo $SLAVE | egrep -i "(t|true|on|1)" 2>/dev/null >/dev/null; then
    return_ok "slave"
fi

# check if writable (then we consider it as a 'master')
READONLY=$(psql -qt -c "$WRITABLE_CHECK" 2>/dev/null)
if [ $? -ne 0 ]; then
    return_fail;
elif echo $READONLY | egrep -i "(f|false|off|0)" 2>/dev/null >/dev/null; then
    return_ok "master"
fi

return_ok "none";

The logic of the script goes as follows. There are two queries which are used to detect the state of the node.

SLAVE_CHECK="SELECT pg_is_in_recovery()"
WRITABLE_CHECK="SHOW transaction_read_only"

The first checks if PostgreSQL is in recovery - it will be ‘false’ for the active server and ‘true’ for standby servers. The second checks if PostgreSQL is in read-only mode. The active server will return ‘off’ while standby servers will return ‘on’. Based on the results, the script calls the return_ok() function with a right parameter (‘master’ or ‘slave’, depending on what was detected). If the queries failed, a ‘return_fail’ function will be executed.

Return_ok function returns a string based on the argument which was passed to it. If the host is an active server, the script will return “PostgreSQL master is running”. If it is a standby, the returned string will be: “PostgreSQL slave is running”. If the state is not clear, it’ll return: “PostgreSQL is running”. This is where the loop ends. HAProxy checks the state by connecting to xinetd. The latter starts a script, which then returns a string that HAProxy parses.

As you may remember, HAProxy expects the following strings:

tcp-check expect string master\ is\ running

for the write backend and

tcp-check expect string is\ running.

for the read-only backend. This makes the active server the only host available in the write backend while on the read backend, both active and standby servers can be used.

PostgreSQL and HAProxy in ClusterControl

The setup above is not complex, but it does takes some time to set it up. ClusterControl can be used to set all of this up for you.
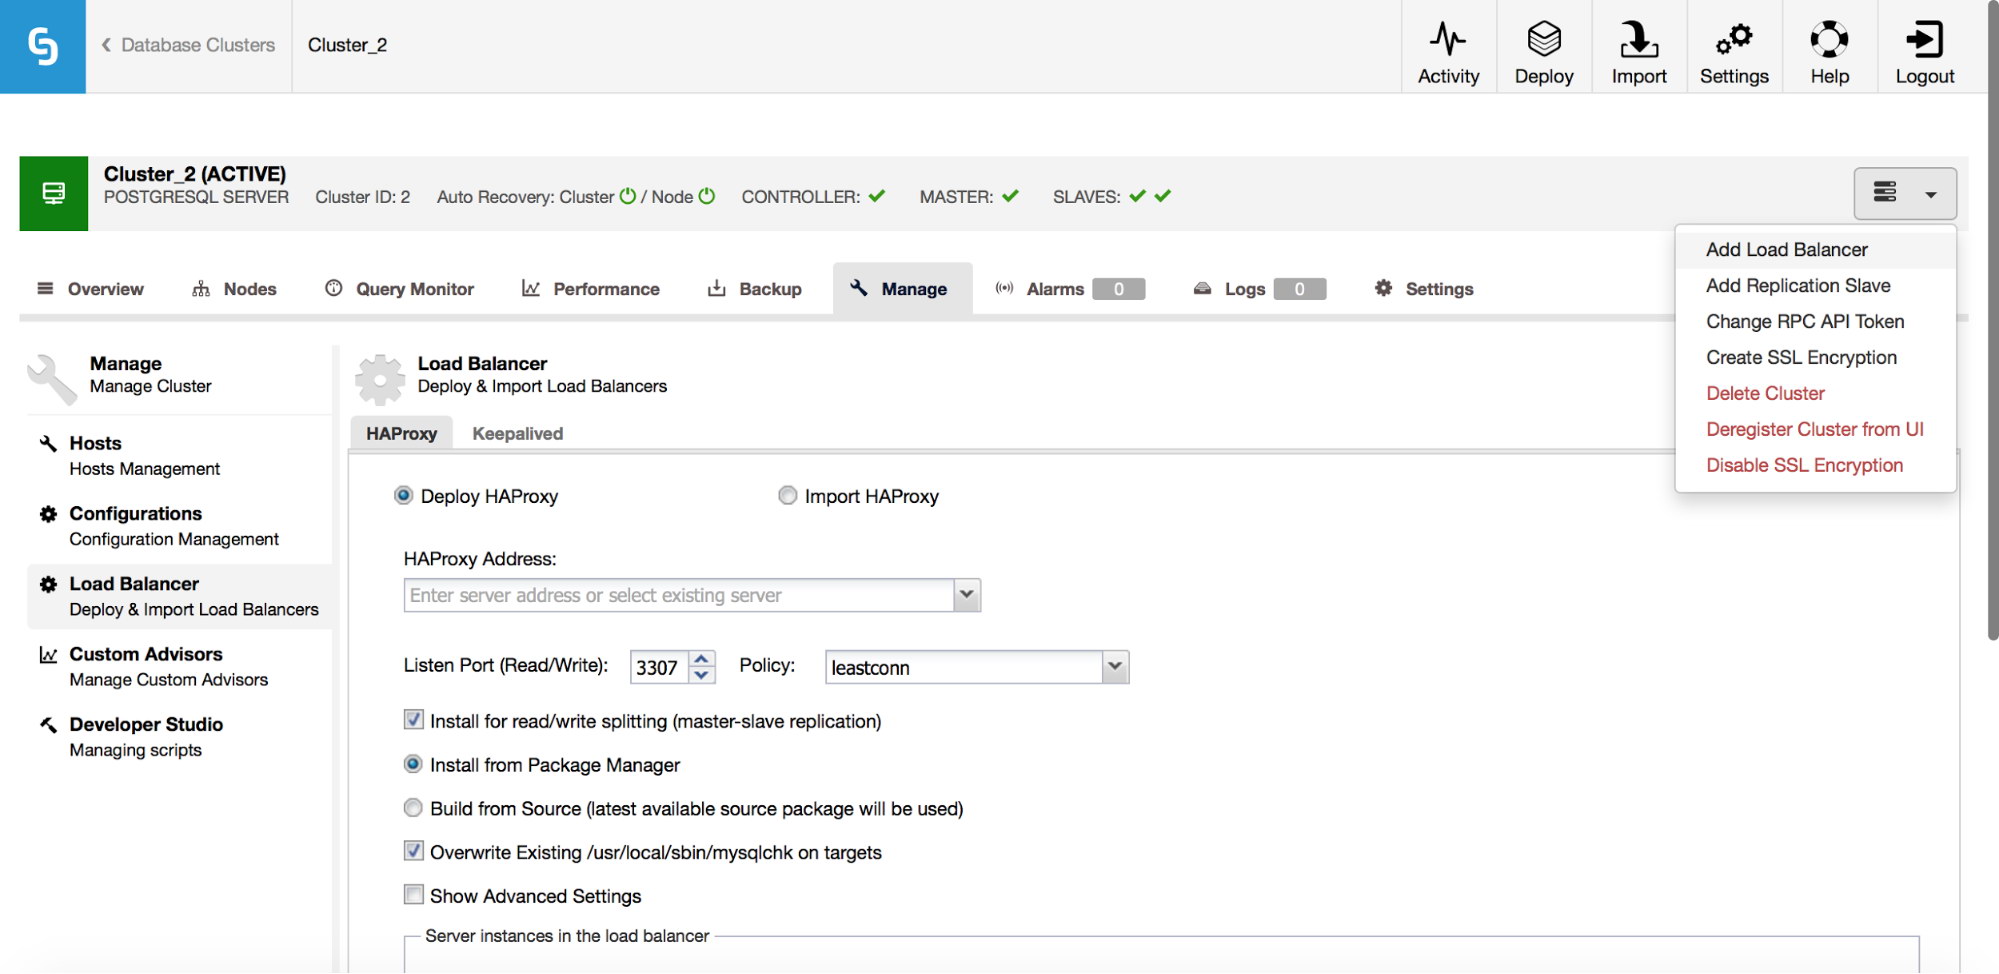
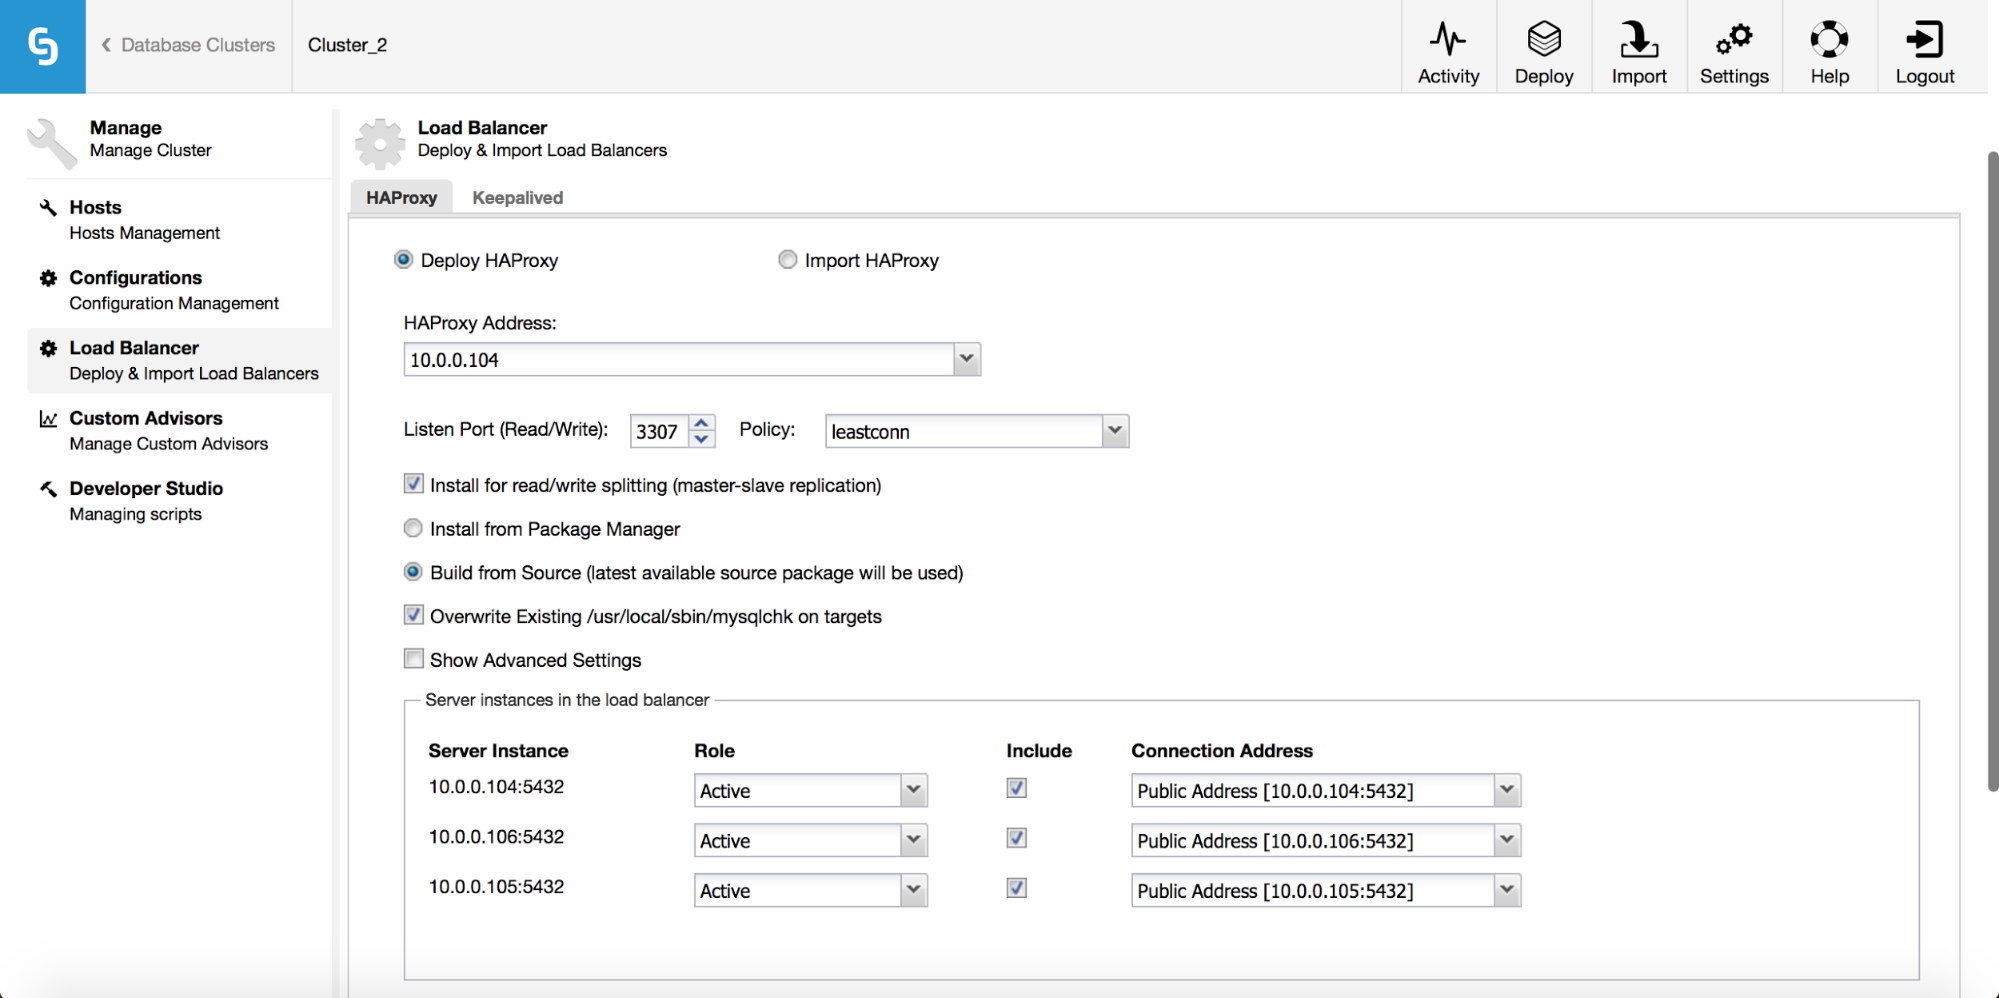
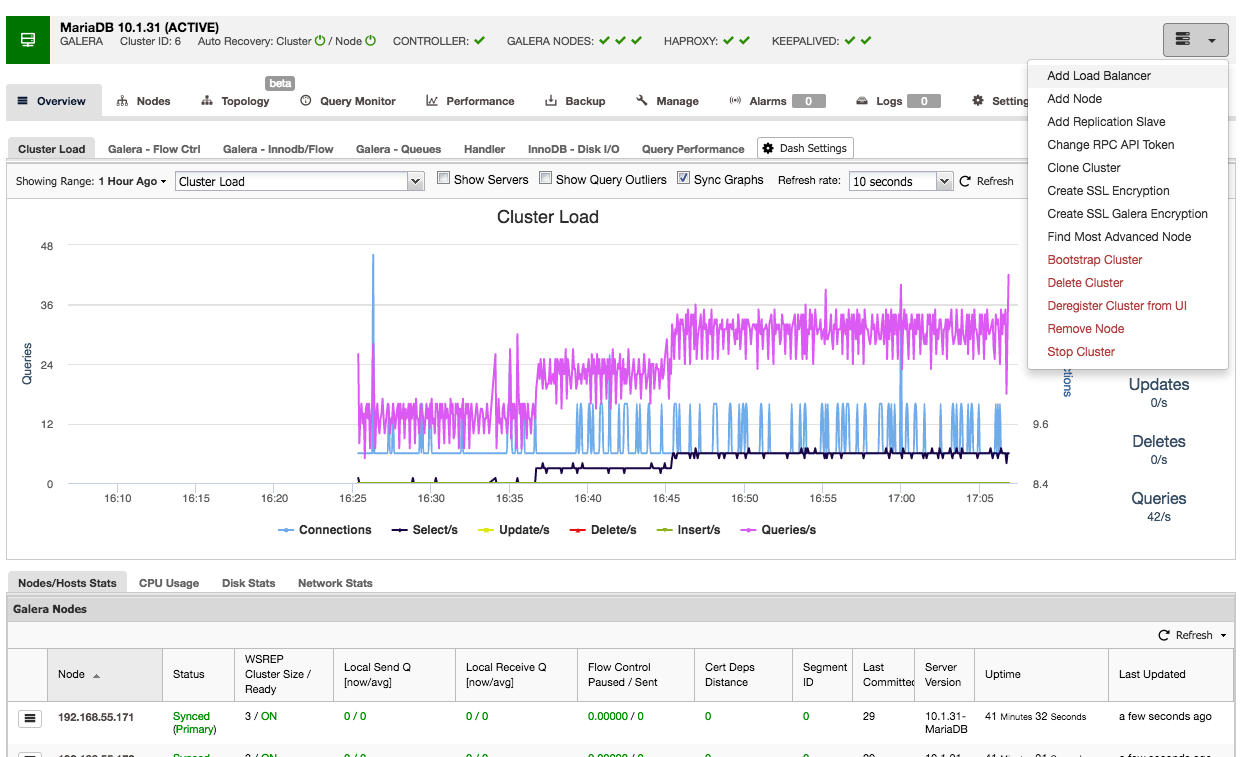
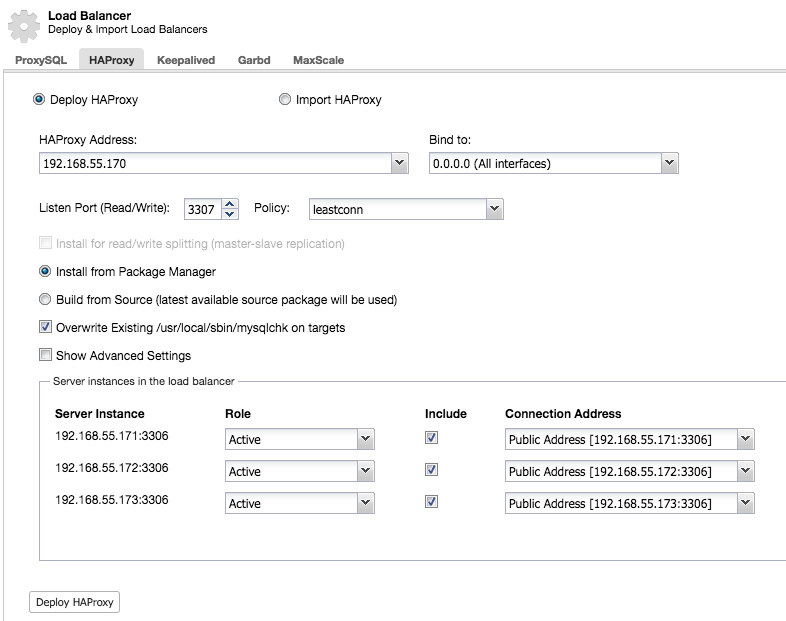
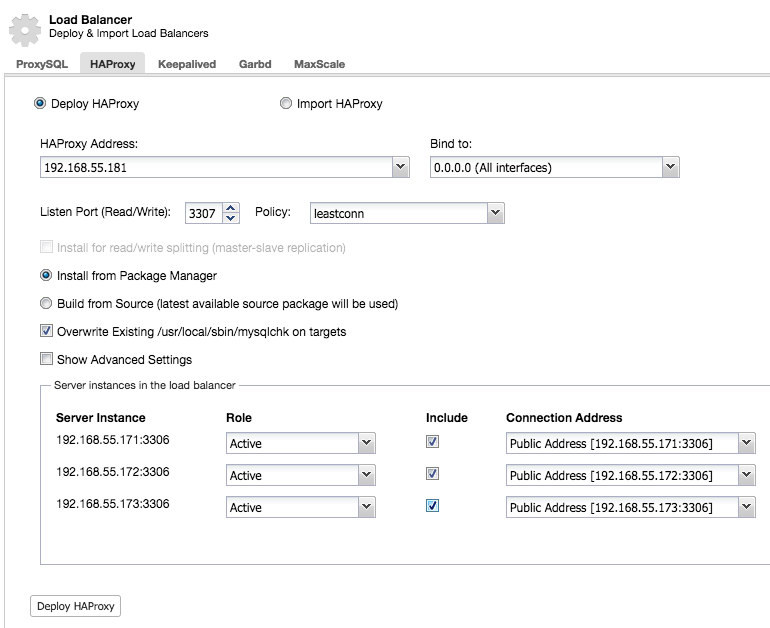
In the cluster job dropdown menu, you have an option to add a load balancer. Then an option to deploy HAProxy shows up. You need to fill in where you’d like to install it, and make some decisions: from the repositories that you have configured on the host or the latest version, compiled from the source code. You’ll also need to configure which nodes in the cluster you’d like to add to HAProxy.

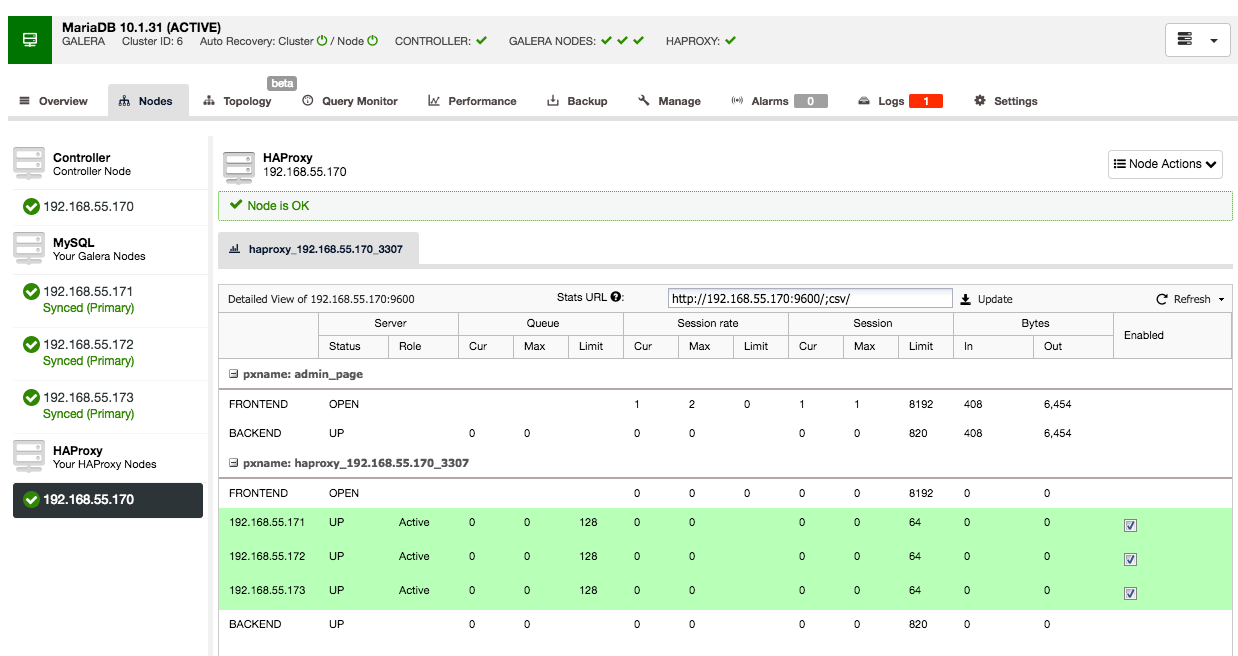
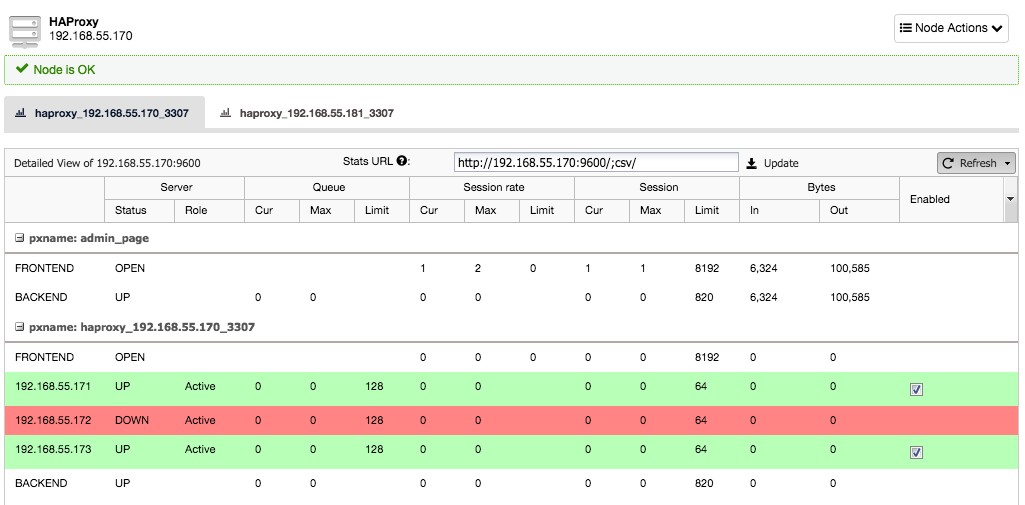
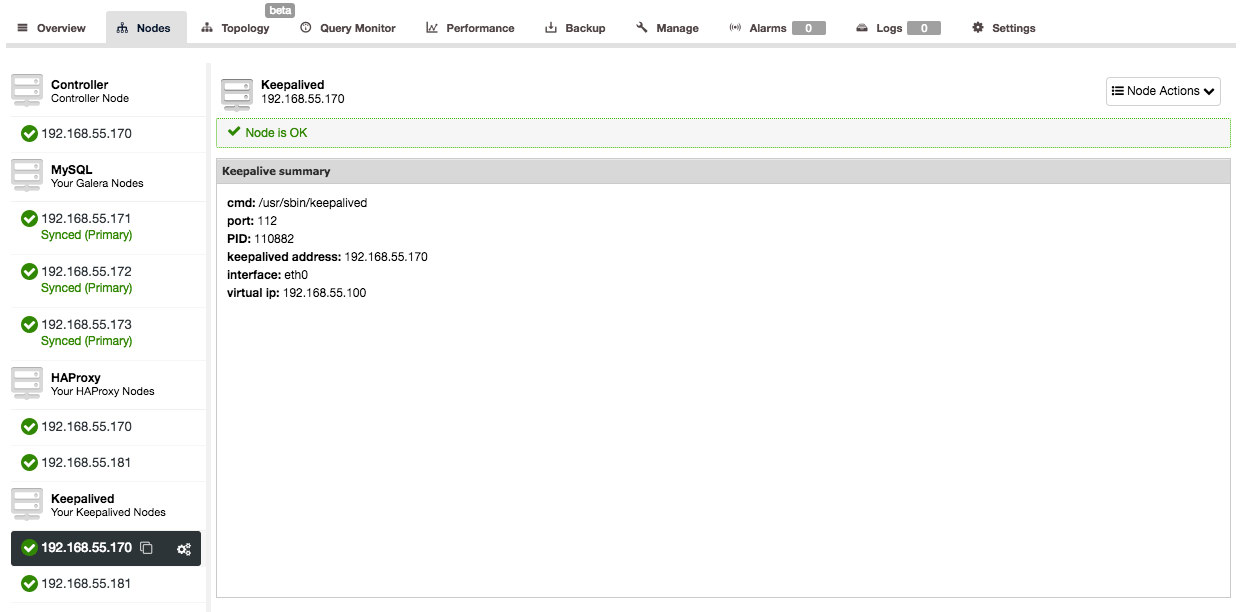
Once the HAProxy instance is deployed, you can access some statistics in the “Nodes” tab:
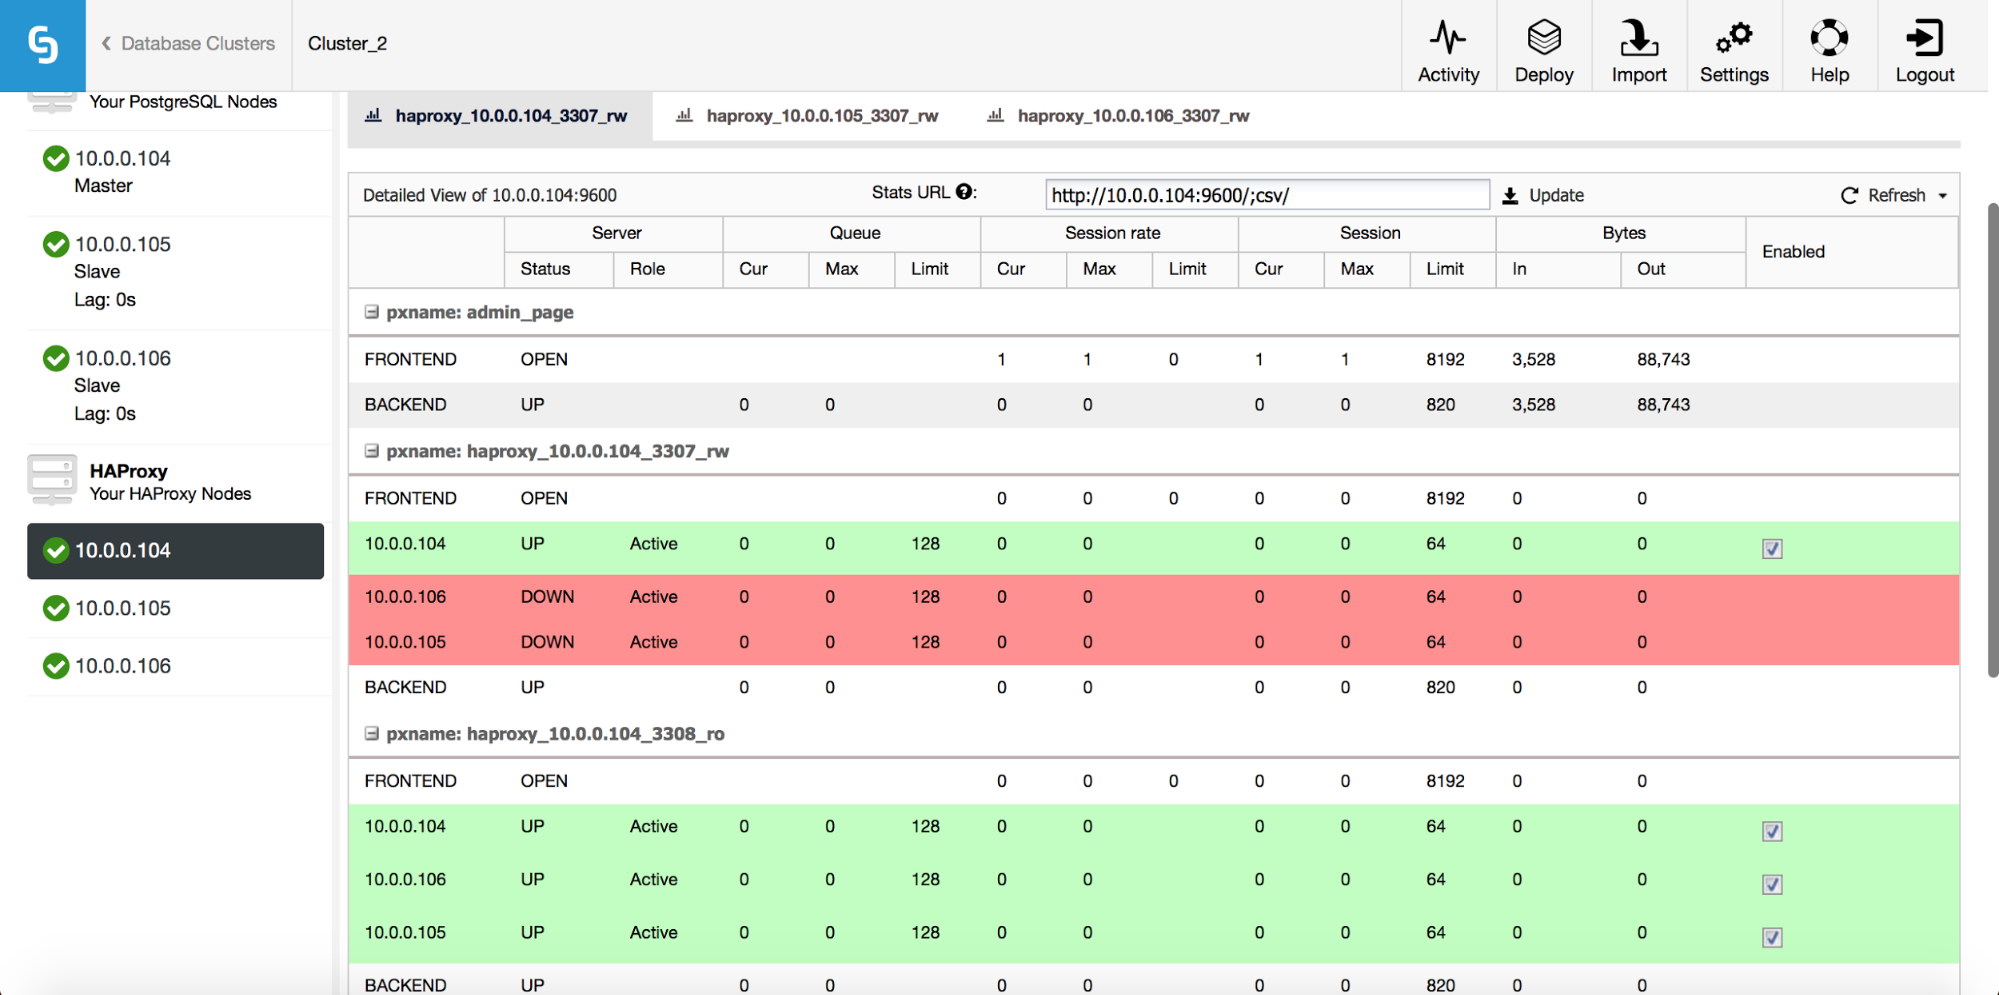
As we can see, for the R/W backend, only one host (active server) is marked as up. For the read-only backend, all nodes are up.

ClusterControl
Single Console for Your Entire Database Infrastructure
Find out what else is new in ClusterControl

Keepalived

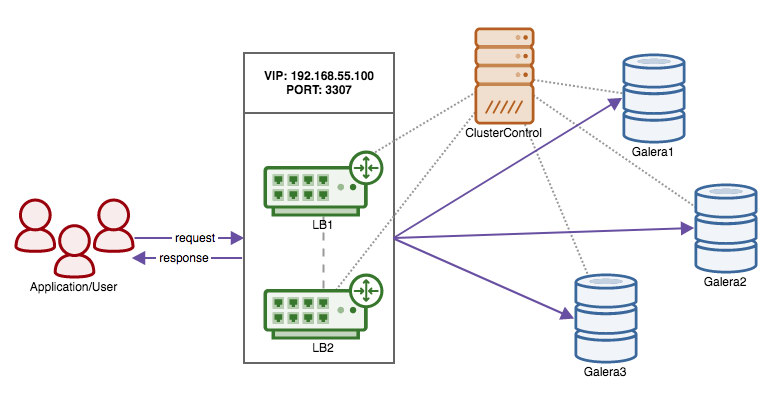
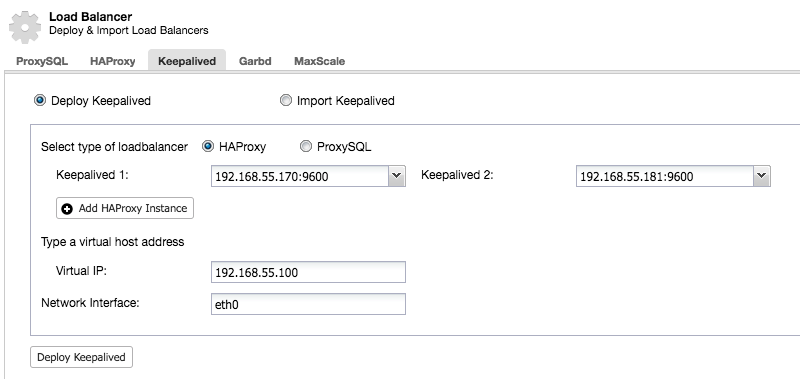
HAProxy will sit between your applications and database instances, so it will be playing a central role. It can unfortunately also become a single point of failure, should it fail, there will be no route to the databases. To avoid such a situation, you can deploy multiple HAProxy instances. But then the question is - how to decide to which proxy host to connect to. If you deployed HAProxy from ClusterControl, it’s as simple as running another “Add Load Balancer” job, this time deploying Keepalived.
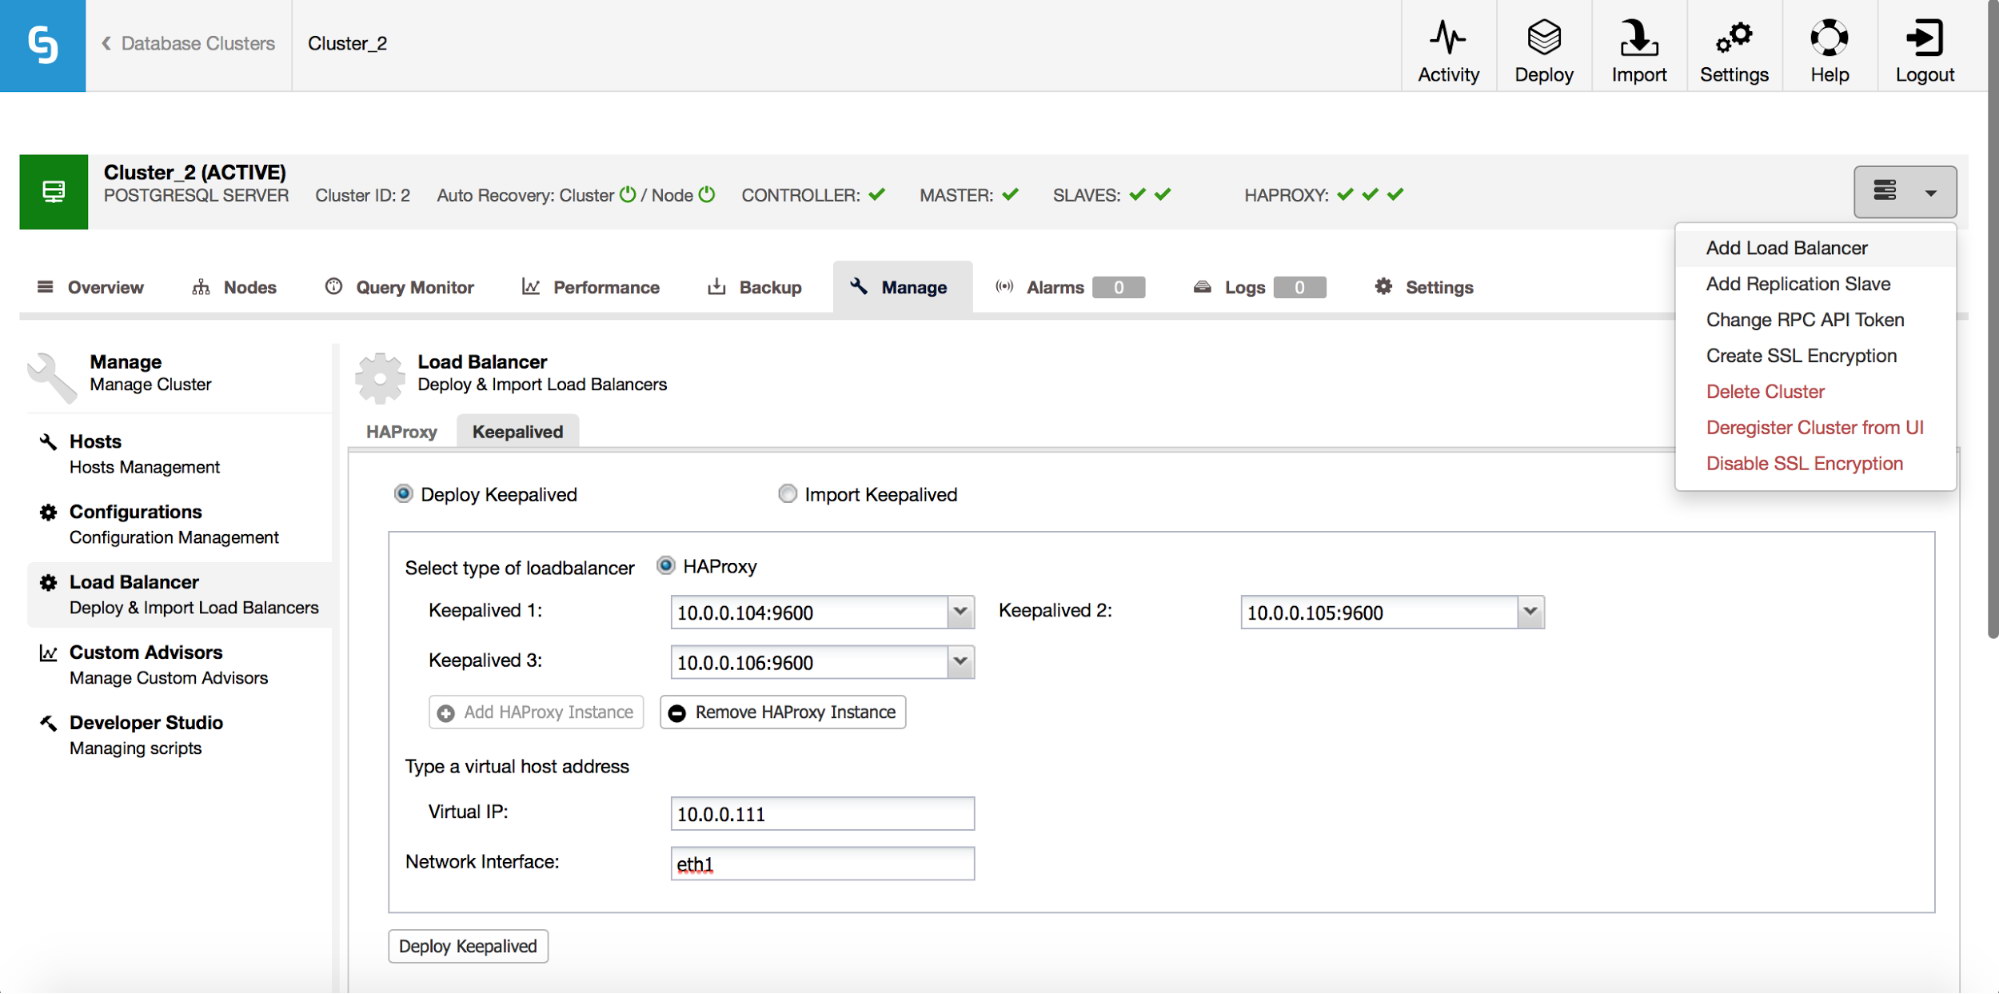
As we can see in the screenshot above, you can pick up to three HAProxy hosts and Keepalived will be deployed on top of them, monitoring their state. A Virtual IP (VIP) will be assigned to one of them. Your application should use this VIP to connect to the database. If the “active” HAProxy will become unavailable, VIP will be moved to another host.

As we have seen, it’s quite easy to deploy a full high availability stack for PostgreSQL. Do give it a try and let us know if you have any feedback.


Our Most Popular Database Blog Posts in 2017

$
0
0

As we wrap up our last blog of 2017 we wanted to reflect on what content we have been creating that’s been resonating and generating the most interest with our readers. We will continue to deliver the best technical content we can for MySQL, Galera Cluster, PostgreSQL, MariaDB, and MongoDB in 2018.

Here is some of our most popular content from 2017…

Top Database Blogs for 2017

ClusterControl
Single Console for Your Entire Database Infrastructure
Find out what else is new in ClusterControl

Top Blogs by Technology

While MySQL and MySQL Galera Cluster dominate our most popular content we blog about a lot of different technologies and methodologies on the Severalnines blog. Here are some of the most popular blogs in 2017 for non-MySQL topics.

If there are some blog topics you would like us to cover in 2018 please list them in the comments below.

How to Install ClusterControl on Servers without Internet Access

$
0
0

There are several ways to get ClusterControl installed on your database infrastructure, as described in the ClusterControl Getting Started page. One simple way is to use an installation script, install-cc.sh. This script automates the whole process, and is executed on the host where you want to install ClusterControl. By default, it assumes the host has internet connectivity during the installation process.

For users who are not able to have their ClusterControl hosts connect to the Internet during the installation, we have some good news! ClusterControl provides a helper script to install and configure ClusterControl packages in an Internetless environment, available at /var/www/clustercontrol/app/tools/setup-cc.sh. The installation steps are also available at our documentation page.

Requirements

Prior to the offline install, make sure you meet the following requirements for the ClusterControl node:

  1. Ensure the offline repository is ready. We assume that you already configured an offline repository for this guide. Details on how to setup offline repository is explained on the next section.
  2. Firewall, SElinux or AppArmor must be turned off. You can turn on the firewall once the installation has completed. Make sure to allow ports as defined on this page.
  3. MySQL server must be installed on the ClusterControl host.

We will now explain these steps in the following sections.

Setting Up Offline Repository

The installer script requires an offline repository so it can automate the installation process by installing dependencies.

CentOS 7

  1. Insert the DVD installation disc into the DVD drive.

  2. Mount the DVD installation disc into the default media location at /media/CentOS:

    $ mount /dev/cdrom /media/CentOS
  3. Disable the default repository by adding enabled=0 to “base”, “updates” and “extras” directives. You should have something like this inside /etc/yum.repos.d/CentOS-Base.repo:

    [base]
    name=CentOS-$releasever - Base
    mirrorlist=http://mirrorlist.centos.org/?release=$releasever&arch=$basearch&repo=os
    #baseurl=http://mirror.centos.org/centos/$releasever/os/$basearch/
    gpgcheck=1
    gpgkey=file:///etc/pki/rpm-gpg/RPM-GPG-KEY-CentOS-7
    enabled=0
    
    #released updates
    [updates]
    name=CentOS-$releasever - Updates
    mirrorlist=http://mirrorlist.centos.org/?release=$releasever&arch=$basearch&repo=updates
    #baseurl=http://mirror.centos.org/centos/$releasever/updates/$basearch/
    gpgcheck=1
    gpgkey=file:///etc/pki/rpm-gpg/RPM-GPG-KEY-CentOS-7
    enabled=0
    
    #additional packages that may be useful
    [extras]
    name=CentOS-$releasever - Extras
    mirrorlist=http://mirrorlist.centos.org/?release=$releasever&arch=$basearch&repo=extras
    #baseurl=http://mirror.centos.org/centos/$releasever/extras/$basearch/
    gpgcheck=1
    gpgkey=file:///etc/pki/rpm-gpg/RPM-GPG-KEY-CentOS-7
    enabled=0
    …
  4. Update the “enabled” value under the c6-media directive in /etc/yum.repos.d/CentOS-Media.repo, as shown below:

    [c6-media]
    name=CentOS-$releasever - Media
    baseurl=file:///media/CentOS/
            file:///media/cdrom/
            file:///media/cdrecorder/
    gpgcheck=1
    enabled=1
    gpgkey=file:///etc/pki/rpm-gpg/RPM-GPG-KEY-CentOS-7
  5. Get the list of available packages:

    $ yum list

Make sure the last step does not produce any error.

Debian/Ubuntu

  1. Download the ISO images from the respective vendor site and upload them onto the ClusterControl host. You should have something like this on Debian 7.6:

    $ ls -1 | grep debian
    debian-7.6.0-amd64-DVD-1.iso
    debian-7.6.0-amd64-DVD-2.iso
    debian-7.6.0-amd64-DVD-3.iso
  2. Create mount points and mount each of the ISO images accordingly:

    $ mkdir /mnt/debian-dvd1 /mnt/debian-dvd2 /mnt/debian-dvd3
    $ mount debian-7.6.0-amd64-DVD-1.iso /mnt/debian-dvd1
    $ mount debian-7.6.0-amd64-DVD-2.iso /mnt/debian-dvd2
    $ mount debian-7.6.0-amd64-DVD-3.iso /mnt/debian-dvd3
  3. Add the following lines into /etc/apt/sources.list and comment other lines:

    deb file:/mnt/debian-dvd1/ wheezy main contrib
    deb file:/mnt/debian-dvd2/ wheezy main contrib
    deb file:/mnt/debian-dvd3/ wheezy main contrib
  4. Retrieve the new list of packages:

    $ apt-get update

Make sure the last step does not produce any error.

Preparing the Installation Files

CentOS 7

  1. The offline installation script will need a running MySQL server on the host. Install MySQL server and client, enable it on boot and start the service:

    $ yum install -y mariadb mariadb-server
    $ systemctl enable mariadb
    $ systemctl start mariadb
  2. Configure MySQL root password for the newly installed MySQL server:

    $ mysqladmin -uroot password yourR00tP4ssw0rd
  3. Create the staging directory and download the latest version of cmon-controller RPM package and s9s-clustercontrol tarball from the Severalnines download page. The latest stable version is listed on this page. At this time of writing the latest stable version is 1.5.0:

    $ wget https://severalnines.com/downloads/cmon/clustercontrol-1.5.1-4265-x86_64.rpm
    $ wget https://severalnines.com/downloads/cmon/clustercontrol-cmonapi-1.5.0-290-x86_64.rpm
    $ wget https://severalnines.com/downloads/cmon/clustercontrol-controller-1.5.1-2299-x86_64.rpm
    $ wget https://severalnines.com/downloads/cmon/clustercontrol-notifications-1.5.0-70-x86_64.rpm
    $ wget https://severalnines.com/downloads/cmon/clustercontrol-ssh-1.5.0-39-x86_64.rpm
    $ wget https://severalnines.com/downloads/cmon/clustercontrol-cloud-1.5.0-31-x86_64.rpm
    $ wget https://severalnines.com/downloads/cmon/clustercontrol-clud-1.5.0-31-x86_64.rpm

    **If ClusterControl server does not have internet connection, please download/upload the above files manually to the server.

  4. Perform the package installation manually:

    $ yum localinstall clustercontrol-*

Debian 7

  1. Install MySQL on the host:

    $ sudo apt-get install -y --force-yes mysql-client mysql-server
    $ sudo systemctl enable mysql
  2. Download the latest version of ClusterControl packages the Severalnines download page. The latest stable version is listed here. At the time of writing, the latest stable version is 1.5.0:

    $ wget https://severalnines.com/downloads/cmon/clustercontrol_1.5.1-4265_x86_64.deb
    $ wget https://severalnines.com/downloads/cmon/clustercontrol-cmonapi_1.5.0-290_x86_64.deb
    $ wget https://severalnines.com/downloads/cmon/clustercontrol-controller-1.5.1-2299-x86_64.deb
    $ wget https://severalnines.com/downloads/cmon/clustercontrol-notifications_1.5.0-70_x86_64.deb
    $ wget https://severalnines.com/downloads/cmon/clustercontrol-ssh_1.5.0-39_x86_64.deb
    $ wget https://severalnines.com/downloads/cmon/clustercontrol-cloud_1.5.0-31_x86_64.deb
    $ wget https://severalnines.com/downloads/cmon/clustercontrol-clud_1.5.0-31_x86_64.deb

    **If ClusterControl server does not have internet connection, please download/upload the above files manually to the server.

  3. Perform the package installation and ClusterControl dependencies manually:

    $ sudo apt-get -f install ntp gnuplot
    $ sudo dpkg -i clustercontrol-*.deb

Installing ClusterControl

  1. Execute the post-installation script to configure ClusterControl components and follow the installation wizard accordingly:

    $ sudo /var/www/html/clustercontrol/app/tools/setup-cc.sh

    **Take note that depending on the operating system, Apache document root path might be different. Try with /var/www if /var/www/html does not work.

  2. Open the browser and navigate to https://ClusterControl_host/clustercontrol. Setup the super admin account by specifying a valid email address and password on the welcome page. Follow the installation wizard. Upon completion you will need to specify an email address as username to access ClusterControl.

  3. Once done, you will be redirected to the onboarding wizard:

Post Installation

Once ClusterControl is up and running, you can point it to your existing clusters and/or single-instance MySQL/MariaDB instances and start managing them from one place. Make sure passwordless SSH is configured from ClusterControl node to your database nodes.

  1. Generate a SSH key on ClusterControl node:

    $ ssh-keygen -t rsa # press Enter on all prompts
  2. Setup passwordless SSH to database nodes:

    $ ssh-copy-id -i ~/.ssh/id_rsa [os_user]@[IP address/hostname]

Repeat step 2 for all database hosts that you are going to manage.

Notes

Note that the following ClusterControl features will not work without Internet connection:

  • Backup > Create/Schedule Backup > Upload to Cloud - requires connection to cloud providers.
  • Integrations > Cloud Providers - requires connection to cloud providers.
  • Manage > Load Balancer - requires connection to EPEL, ProxySQL, HAProxy, MariaDB repository.
  • Manage > Upgrades - requires connection to provider’s repository.
  • Deploy Database Cluster - requires connection to database provider’s repository.

Announcing ClusterControl 1.5.1 - Featuring Backup Encryption for MySQL, MongoDB & PostgreSQL

$
0
0

What better way to start a new year than with a new product release?

Today we are excited to announce the 1.5.1 release of ClusterControl - the all-inclusive database management system that lets you easily deploy, monitor, manage and scale highly available open source databases - and load balancers - in any environment: on-premise or in the cloud.

ClusterControl 1.5.1 features encryption of backups for MySQL, MongoDB and PostgreSQL, a new topology viewer, support for MongoDB 3.4, several user experience improvements and more!

Feature Highlights

Full Backup and Restore Encryption for these supported backup methods

  • mysqldump, xtrabackup (MySQL)
  • pg_dump, pg_basebackup (PostgreSQL)
  • mongodump (MongoDB)

New Topology View (BETA) shows your replication topology (including load balancers) for your entire cluster to help you visualize your setup.

  • MySQL Replication Topology
  • MySQL Galera Topology

Improved MongoDB Support

  • Support for MongoDB v3.4
  • Fix to add back restore from backup
  • Multiple NICs support. Management/public IPs for monitoring connections and data/private IPs for replication traffic

Misc

Improved user experience featuring a new left-side navigation that includes:

  • Global settings breakout to make it easier to find settings related to a specific feature
  • Quick node actions that allow you to quickly perform actions on your node
ClusterControl
Single Console for Your Entire Database Infrastructure
Find out what else is new in ClusterControl

View Release Details and Resources

Improving Database Security: Backup & Restore Encryption

ClusterControl 1.5 introduces another step to ensuring your databases are kept secure and protected.

Backup & restore encryption means that backups are encrypted at rest using AES-256 CBC algorithm. An auto generated key will be stored in the cluster's configuration file under /etc/cmon.d. The backup files are transferred in encrypted format. Users can now secure their backups for offsite or cloud storage with the flip of a checkbox. This feature is available for select backup methods for MySQL, MongoDB & PostgreSQL.

New Topology View (beta)

This exciting new feature provides an “overhead” topology view of your entire cluster, including load balancers. While in beta, this feature currently supports MySQL Replication and Galera topologies. With this new feature, you can drag and drop to perform node actions. For example, you can drag a replication slave on top of a master node - which will prompt you to either rebuild the slave or change the replication master.

Improved User Experience

The new Left Side Navigation and the new quick actions and settings that accompany it mark the first major redesign to the ClusterControl interface in some time. ClusterControl offers a vast array of functionality, so much so that it can sometimes be overwhelming to the novice. This addition of the new navigation allows the user quick access to what they need on a regular basis and the new node quick actions lets users quickly run common commands and requests right from the navigation.

Download the new ClusterControl or request a demo.

How To Achieve PCI Compliance for MySQL & MariaDB with ClusterControl - The Webinar

$
0
0

Join Laurent Blume, Unix Systems Engineer & PCI Specialist and Vinay Joosery, CEO at Severalnines, as they discuss all there is to know about how to achieve PCI compliance for MySQL & MariaDB with ClusterControl in this new webinar on January 30th.

The Payment Card Industry Data Security Standard (PCI-DSS) is a set of technical and operational requirements defined by the PCI Security Standards Council (PCI SSC) to protect cardholder data. These standards apply to all entities that store, process or transmit cardholder data – with requirements for software developers and manufacturers of applications and devices used in those transactions.

PCI data that resides in a MySQL or MariaDB database must of course also adhere to these requirements, and database administrators must follow best practices to ensure the data is secured and compliant. The PCI standards are stringent and can easily require a spiraling amount of time spent on meeting their requirements. Database administrators can end up overwhelmed when using software that was not designed for compliance, often because it long predates PCI itself, as is the case for most database systems in use today.

That is why, as often as possible, reliable tools must be chosen to help with that compliance, easing out the crucial parts. Each time the compliance for one requirement can be shown to be implemented, working, and logged accordingly, time will be saved. If well-designed, it will only require regular software upgrades, a yearly review and a moderate amount of tweaking to follow the standard's evolution over time.

This new webinar focuses on PCI-DSS requirements for a MySQL or MariaDB database back-end managed by ClusterControl in order to help meet these requirements. It will provide a MySQL and MariaDB user focussed overview of what the PCI standards mean, how they impact database management and provide valuable tips and tricks on how to achieve PCI compliance for MySQL & MariaDB with ClusterControl.

Sign up here!

Date, Time & Registration

Europe/MEA/APAC

Tuesday, January 30th at 09:00 GMT / 10:00 CET (Germany, France, Sweden)

Register Now

North America/LatAm

Tuesday, January 30th at 09:00 PT (US) / 12:00 ET (US)

Register Now

Agenda

  • Introduction to the PCI-DSS standards
  • The impact of PCI on database management
  • Step by step review of the PCI requirements
  • How to meet the requirements for MySQL & MariaDB with ClusterControl
  • Conclusion
  • Q&A

Speakers

Laurent Blume, Unix Systems Engineer, PCI Specialist

Laurent’s career in IT started in 2000, his work since evolved from POS terminals for a jewelry store chain to infrastructure servers in a government aerospace R&D organization, even touching supercomputers. One constant throughout was the increasing need for security.

For the past 6 years, he has been in charge of first implementing, then keeping up with the PCI-DSS compliance of critical transnational payment authorization systems. Its implementation for databases has been an essential part of the task. For the last few years, it has expanded to the design and productization of MariaDB cluster backends for mobile contactless payments.

Vinay Joosery, CEO & Co-Founder, Severalnines

Vinay is a passionate advocate and builder of concepts and business around distributed database systems.

Prior to co-founding Severalnines, Vinay held the post of Vice-President EMEA at Pentaho Corporation - the Open Source BI leader. He has also held senior management roles at MySQL / Sun Microsystems / Oracle, where he headed the Global MySQL Telecoms Unit, and built the business around MySQL's High Availability and Clustering product lines. Prior to that, Vinay served as Director of Sales & Marketing at Ericsson Alzato, an Ericsson-owned venture focused on large scale real-time databases.

Updated: ClusterControl Tips & Tricks: Securing your MySQL Installation

$
0
0

Requires ClusterControl 1.2.11 or later. Applies to MySQL based clusters.

During the life cycle of Database installation it is common that new user accounts are created. It is a good practice to once in a while verify that the security is up to standards. That is, there should at least not be any accounts with global access rights, or accounts without password.

Using ClusterControl, you can at any time perform a security audit.

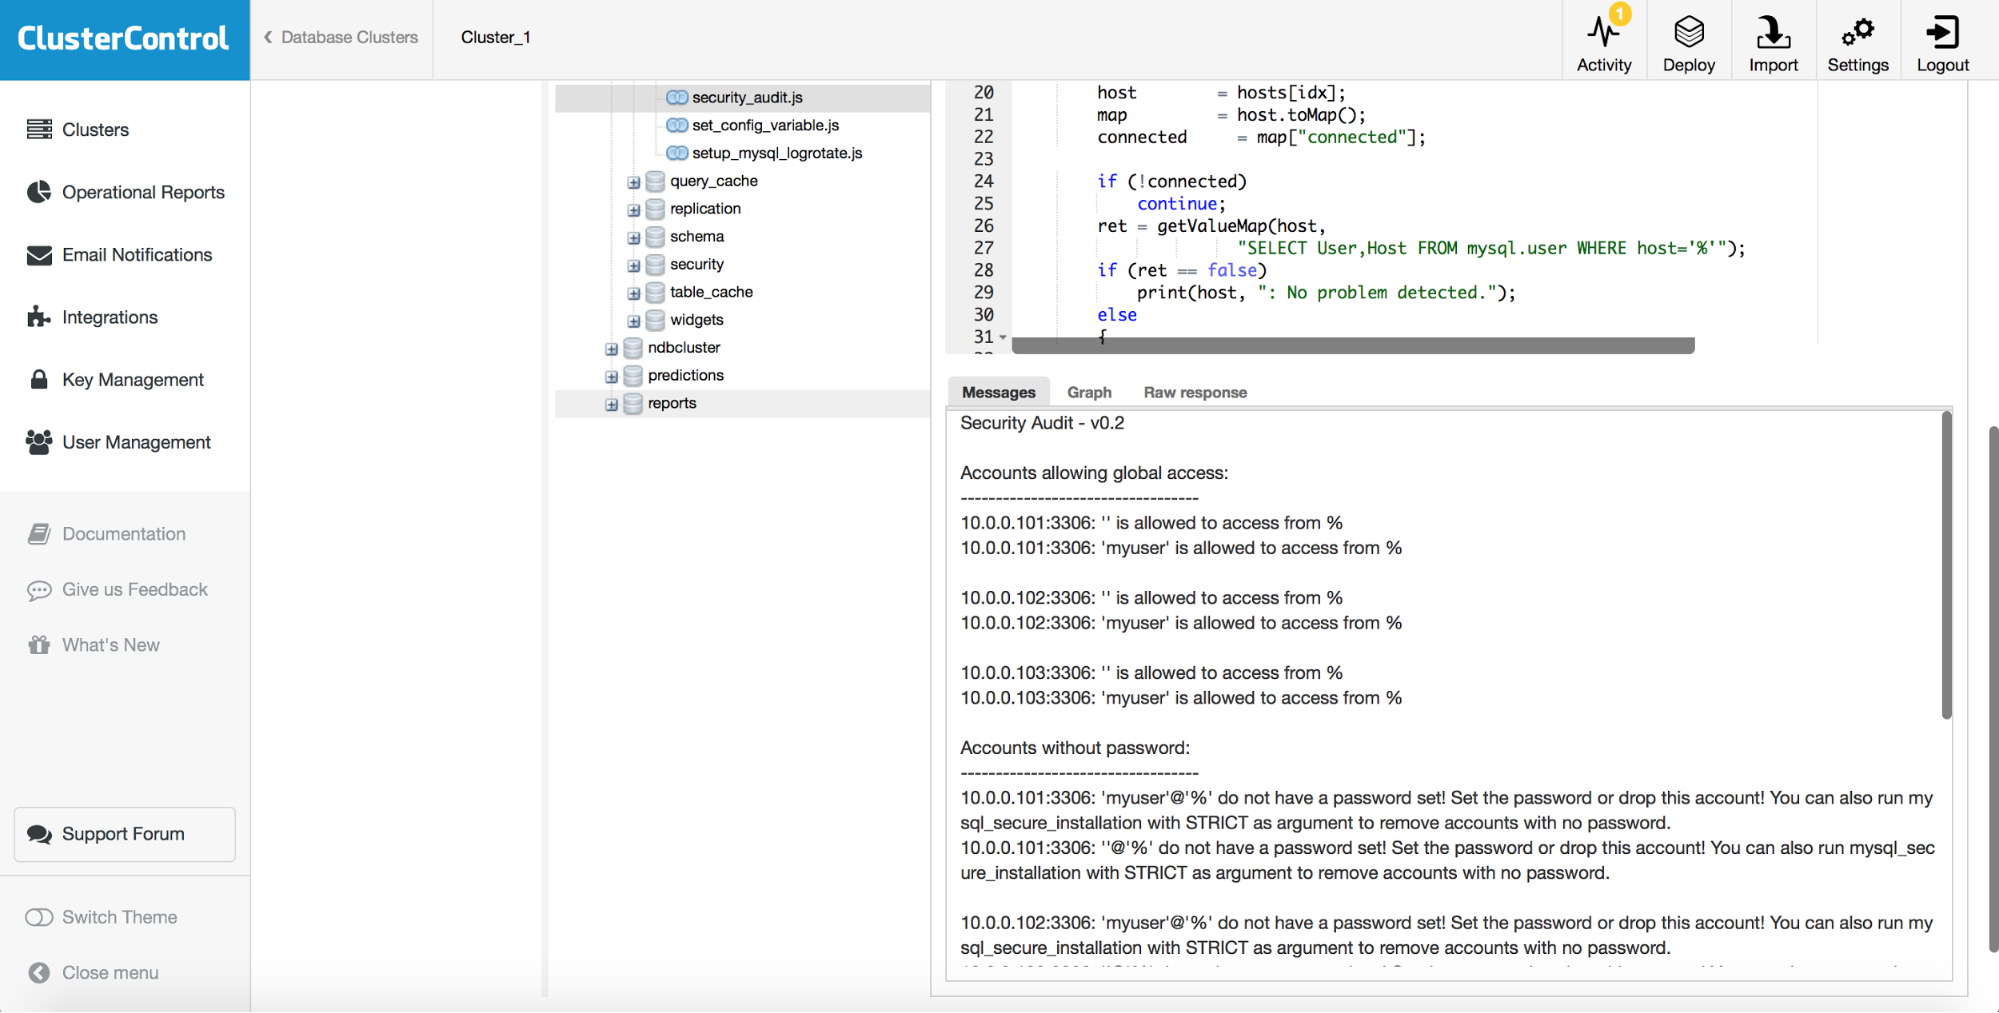
In the User Interface go to Manage > Developer Studio. Expand the folders so that you see s9s/mysql/programs. Click on security_audit.js and then press Compile and Run.

If there are problems you will clearly see it in the messages section:

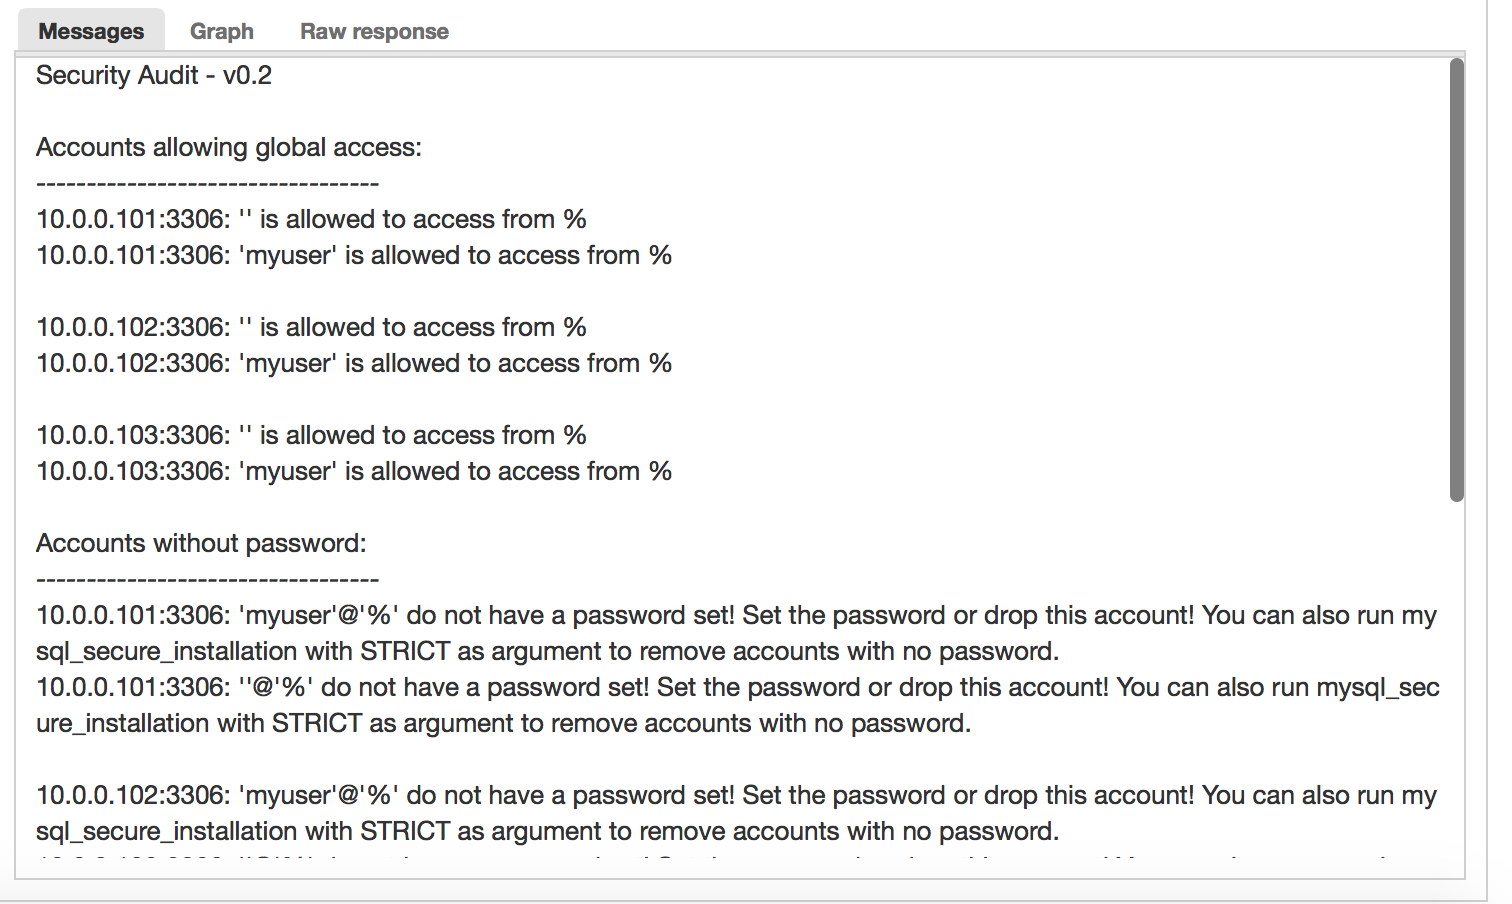
Enlarged Messages output:

Here we have accounts that can connect from any hosts and accounts which do not have a password. Those accounts should not exist in a secure database installation. That is rule number one. To correct this problem, click on mysql_secure_installation.js in the s9s/mysql/programs folder.

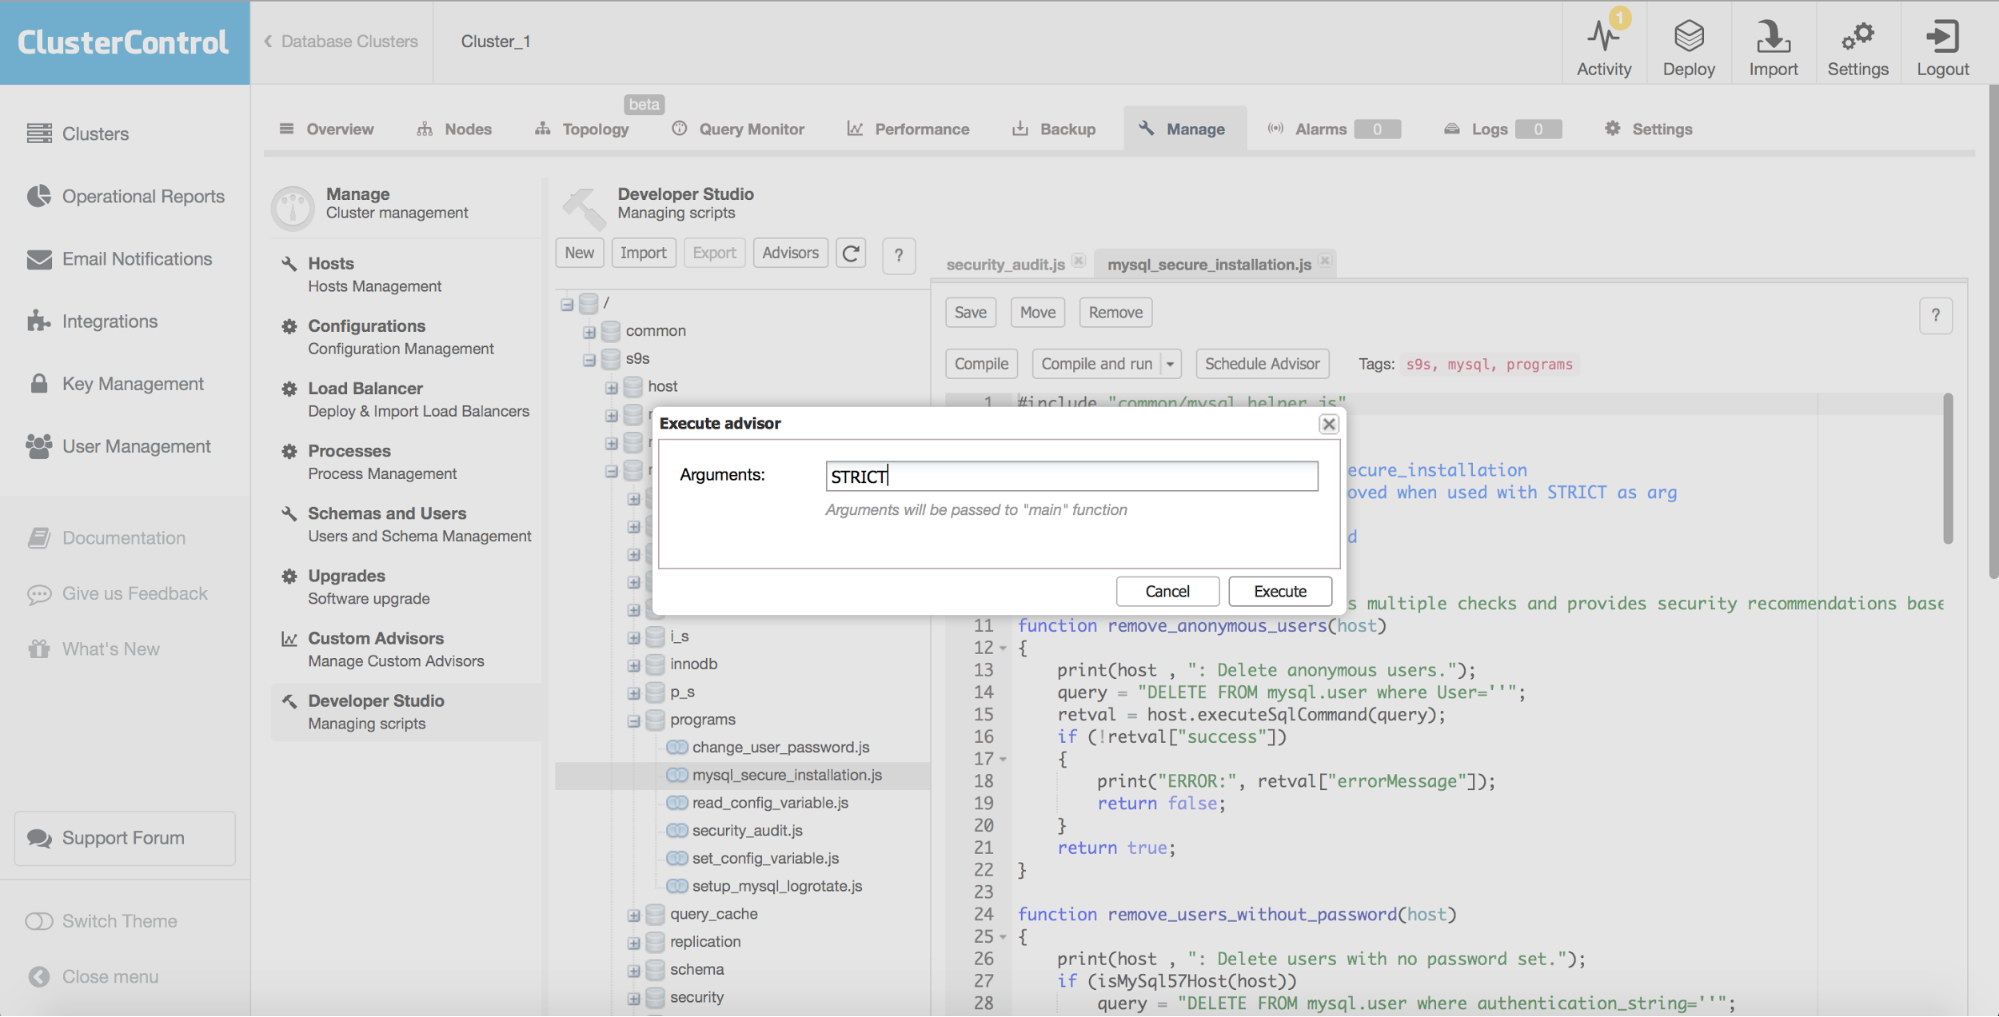
Click on the dropdown arrow next to Compile and Run and press Change Settings. You will see the following dialog and enter the argument “STRICT”:

Then press Execute. The mysql_secure_installation.js script will then do on each MySQL database instance part of the cluster:

  1. Delete anonymous users
  2. Dropping 'test' database (if exists).
  3. If STRICT is given as an argument to mysql_secure_installation.js it will also do:
    • Remove accounts without passwords.

In the Message box you will see:

The MySQL database servers part of this cluster have now been secured and you have reduced the risk of compromising your data.

You can re-run security_audit.js to verify that the actions have had effect.

Happy Clustering!

PS.: To get started with ClusterControl, click here!

How to Secure the ClusterControl Server

$
0
0

In our previous blog post, we showed you how you can secure your open source databases with ClusterControl. But what about the ClusterControl server itself? How do we secure it? This will be the topic for today’s blog. We assume the host is solely for ClusterControl usage, with no other applications running on it.

Firewall & Security Group

First and foremost, we should close down all unnecessary ports and only open the necessary ports used by ClusterControl. Internally, between ClusterControl and the database servers, only the netcat port matters, where the default port is 9999. This port needs to be opened only if you would like to store the backup on the ClusterControl server. Otherwise, you can close this down.

From the external network, it's recommended to only open access to either HTTP (80) or HTTPS (443) for the ClusterControl UI. If you are running the ClusterControl CLI called 's9s', the CMON-TLS endpoint needs to be opened on port 9501. It's also possible to install database-related applications on top of the ClusterControl server, like HAProxy, Keepalived, ProxySQL and such. In that case, you also have to open the necessary ports for these as well. Please refer to the documentation page for a list of ports for each service.

To setup firewall rules via iptables, on ClusterControl node, do:

$ iptables -A INPUT -p tcp --dport 9999 -j ACCEPT
$ iptables -A INPUT -p tcp --dport 80 -j ACCEPT
$ iptables -A INPUT -p tcp --dport 443 -j ACCEPT
$ iptables -A INPUT -p tcp --dport 9501 -j ACCEPT
$ iptables -A OUTPUT -p tcp --dport 22 -j ACCEPT

The above are the simplest commands. You can be stricter and extend the commands to follow your security policy - for example, by adding network interface, destination address, source address, connection state and what not.

Similar to running the setup in the cloud, the following is an example of inbound security group rules for the ClusterControl server on AWS:

Different cloud providers provide different security group implementations, but the basic rules are similar.

Encryption

ClusterControl supports encryption of communications at different levels, to ensure the automation, monitoring and management tasks are performed as securely as possible.

Running on HTTPS

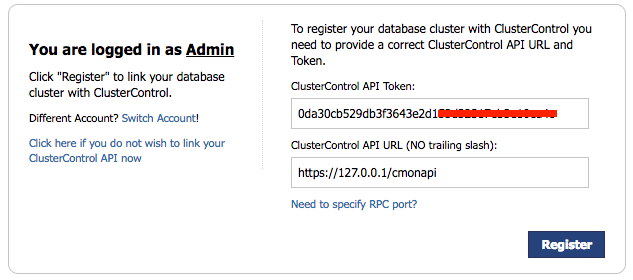
The installer script (install-cc.sh) will configure by default a self-signed SSL certificate for HTTPS usage. If you choose this access method as the main endpoint, you can block the plain HTTP service running on port 80 from the external network. However, ClusterControl still requires an access to CMONAPI (a legacy Rest-API interface) which runs by default on port 80 on the localhost. If you would like to block the HTTP port all over, make sure you change the ClusterControl API URL under Cluster Registrations page to use HTTPS instead:

The self-signed certificate configured by ClusterControl has 10 years (3650 days) of validity. You can verify the certificate validity by using the following command (on CentOS 7 server):

$  openssl x509 -in /etc/ssl/certs/s9server.crt -text -noout
...
        Validity
            Not Before: Apr  9 21:22:42 2014 GMT
            Not After : Mar 16 21:22:42 2114 GMT
...

Take note that the absolute path to the certificate file might be different depending on the operating system.

MySQL Client-Server Encryption

ClusterControl stores monitoring and management data inside MySQL databases on the ClusterControl node. Since MySQL itself supports client-server SSL encryption, ClusterControl is a capable of utilizing this feature to establish encrypted communication with MySQL server when writing and retrieving its data.

The following configuration options are supported for this purpose:

  • cmondb_ssl_key - path to SSL key, for SSL encryption between CMON and the CMON DB.
  • cmondb_ssl_cert - path to SSL cert, for SSL encryption between CMON and the CMON DB
  • cmondb_ssl_ca - path to SSL CA, for SSL encryption between CMON and the CMON DB

We covered the configuration steps in this blog post some time back.

There is a catch though. At the time of writing, the ClusterControl UI has a limitation in accessing CMON DB through SSL using the cmon user. As a workaround, we are going to create another database user for the ClusterControl UI and ClusterControl CMONAPI called cmonui. This user will not have SSL enabled on its privilege table.

mysql> GRANT ALL PRIVILEGES ON *.* TO 'cmonui'@'127.0.0.1' IDENTIFIED BY '<cmon password>';
mysql> FLUSH PRIVILEGES;

Update the ClusterControl UI and CMONAPI configuration files located at clustercontrol/bootstrap.php and cmonapi/config/database.php respectively with the newly created database user, cmonui :

# <wwwroot>/clustercontrol/bootstrap.php
define('DB_LOGIN', 'cmonui');
define('DB_PASS', '<cmon password>');
# <wwwroot>/cmonapi/config/database.php
define('DB_USER', 'cmonui');
define('DB_PASS', '<cmon password>');

These files will not be replaced when you perform an upgrade through package manager.

CLI Encryption

ClusterControl also comes with a command-line interface called 's9s'. This client parses the command line options and sends a specific job to the controller service listening on port 9500 (CMON) or 9501 (CMON with TLS). The latter is the recommended one. The installer script by default will configure s9s CLI to use 9501 as the endpoint port of the ClusterControl server.

Role-Based Access Control

ClusterControl uses Role-Based Access Control (RBAC) to restrict access to clusters and their respective deployment, management and monitoring features. This ensures that only authorized user requests are allowed. Access to functionality is fine-grained, allowing access to be defined by organisation or user. ClusterControl uses a permissions framework to define how a user may interact with the management and monitoring functionality, after they have been authorised to do so.

The RBAC user interface can be accessed via ClusterControl -> User Management -> Access Control:

All of the features are self-explanatory but if you want some additional description, please check out the documentation page.

If you are having multiple users involved in the database cluster operation, it's highly recommended to set access controls for them accordingly. You can also create multiple teams (organizations) and assign them with zero or more clusters.

Running on Custom Ports

ClusterControl can be configured to use custom ports for all the dependant services. ClusterControl uses SSH as the main communication channel to manage and monitor nodes remotely, Apache to serve the ClusterControl UI and also MySQL to store monitoring and management data. You can run these services on custom ports to reduce the attacking vector. The following ports are the usual targets:

  • SSH - default is 22
  • HTTP - default is 80
  • HTTPS - default is 443
  • MySQL - default is 3306

There are several things you have to change in order to run the above services on custom ports for ClusterControl to work properly. We have covered this in details in the documentation page, Running on Custom Port.

Permission and Ownership

ClusterControl configuration files hold sensitive information and should be kept discreet and well protected. The files must be permissible to user/group root only, without read permission to others. In case the permission and ownership have been wrongly set, the following command helps restore them back to the correct state:

$ chown root:root /etc/cmon.cnf /etc/cmon.d/*.cnf
$ chmod 700 /etc/cmon.cnf /etc/cmon.d/*.cnf

For MySQL service, ensure the content of the MySQL data directory is permissible to "mysql" group, and the user could be either "mysql" or "root":

$ chown -Rf mysql:mysql /var/lib/mysql

For ClusterControl UI, the ownership must be permissible to the Apache user, either "apache" for RHEL/CentOS or "www-data" for Debian-based OS.

The SSH key to connect to the database hosts is another very important aspect, as it holds the identity and must be kept with proper permission and ownership. Furthermore, SSH won't permit the usage of an unsecured key file when initiating the remote call. Verify the SSH key file used by the cluster, inside the generated configuration files under /etc/cmon.d/ directory, is set to the permissible to the osuser option only. For example, consider the osuser is "ubuntu" and the key file is /home/ubuntu/.ssh/id_rsa:

$ chown ubuntu:ubuntu /home/ubuntu/.ssh/id_rsa
$ chmod 700 /home/ubuntu/.ssh/id_rsa

Use a Strong Password

If you use the installer script to install ClusterControl, you are encouraged to use a strong password when prompted by the installer. There are at most two accounts that the installer script will need to configure (depending on your setup):

  • MySQL cmon password - Default value is 'cmon'.
  • MySQL root password - Default value is 'password'.

It is user's responsibility to use strong passwords in those two accounts. The installer script supports a bunch special characters for your password input, as mentioned in the installation wizard:

=> Set a password for ClusterControl's MySQL user (cmon) [cmon]
=> Supported special password characters: ~!@#$%^&*()_+{}<>?

Verify the content of /etc/cmon.cnf and /etc/cmon.d/cmon_*.cnf and ensure you are using a strong password whenever possible.

Changing the MySQL 'cmon' Password

If the configured password does not satisfy your password policy, to change the MySQL cmon password, there are several steps that you need to perform:

  1. Change the password inside the ClusterControl's MySQL server:

    $ ALTER USER 'cmon'@'127.0.0.1' IDENTIFIED BY 'newPass';
    $ ALTER USER 'cmon'@'{ClusterControl IP address or hostname}' IDENTIFIED BY 'newPass';
    $ FLUSH PRIVILEGES;
  2. Update all occurrences of 'mysql_password' options for controller service inside /etc/cmon.cnf and /etc/cmon.d/*.cnf:

    mysql_password=newPass
  3. Update all occurrences of 'DB_PASS' constants for ClusterControl UI inside /var/www/html/clustercontrol/bootstrap.php and /var/www/html/cmonapi/config/database.php:

    # <wwwroot>/clustercontrol/bootstrap.php
    define('DB_PASS', 'newPass');
    # <wwwroot>/cmonapi/config/database.php
    define('DB_PASS', 'newPass');
  4. Change the password on every MySQL server monitored by ClusterControl:

    $ ALTER USER 'cmon'@'{ClusterControl IP address or hostname}' IDENTIFIED BY 'newPass';
    $ FLUSH PRIVILEGES;
  5. Restart the CMON service to apply the changes:

    $ service cmon restart # systemctl restart cmon

Verify if the cmon process is started correctly by looking at the /var/log/cmon.log. Make sure you got something like below:

2018-01-11 08:33:09 : (INFO) Additional RPC URL for events: 'http://127.0.0.1:9510'
2018-01-11 08:33:09 : (INFO) Configuration loaded.
2018-01-11 08:33:09 : (INFO) cmon 1.5.1.2299
2018-01-11 08:33:09 : (INFO) Server started at tcp://127.0.0.1:9500
2018-01-11 08:33:09 : (INFO) Server started at tls://127.0.0.1:9501
2018-01-11 08:33:09 : (INFO) Found 'cmon' schema version 105010.
2018-01-11 08:33:09 : (INFO) Running cmon schema hot-fixes.
2018-01-11 08:33:09 : (INFO) Schema auto-upgrade succeed (version 105010).
2018-01-11 08:33:09 : (INFO) Checked tables - seems ok
2018-01-11 08:33:09 : (INFO) Community version
2018-01-11 08:33:09 : (INFO) CmonCommandHandler: started, polling for commands.

Running it Offline

ClusterControl is able to manage your database infrastructure in an environment without Internet access. Some features would not work in that environment (backup to cloud, deployment using public repos, upgrades), the major features are there and would work just fine. You also have a choice to initially deploy everything with Internet, and then cut off Internet once the setup is tested and ready to serve production data.

By having ClusterControl and the database cluster isolated from the outside world, you have taken off one of the important attacking vectors.

Summary

ClusterControl can help secure your database cluster but it doesn't get secured by itself. Ops teams must make sure that the ClusterControl server is also hardened from a security point-of-view.

Updated: Become a ClusterControl DBA: User Management

$
0
0

In the previous posts of this blog series, we covered deployment of clustering/replication (MySQL / Galera, MySQL Replication, MongoDB & PostgreSQL), management & monitoring of your existing databases and clusters, performance monitoring and health, how to make your setup highly available through HAProxy and MaxScale, how to prepare yourself against disasters by scheduling backups, how to manage your database configurations and in the last post how to manage your log files.

One of the most important aspects of becoming a ClusterControl DBA is to be able to delegate tasks to team members, and control access to ClusterControl functionality. This can be achieved by utilizing the User Management functionality, that allows you to control who can do what. You can even go a step further by adding teams or organizations to ClusterControl and map them to your DevOps roles.

Teams

Teams can be seen either as a full organization or groups of users. Clusters can be assigned to teams and in this way the cluster is only visible for the users in the team it has been assigned to. This allows you to run multiple teams or organizations within one ClusterControl environment. Obviously the ClusterControl admin account will still be able to see and manage all clusters.

You can create a new Team via Side Menu -> User Management -> Teams and clicking on the plus sign on the left side under Teams section:

After adding a new Team, you can assign users to the team.

Users

After selecting the newly created team, you can add new users to this team by pressing the plus sign on the right dialogue:

By selecting the role, you can limit the functionality of the user to either an Super Admin, Admin or User. You can extend these default roles in the Access Control section.

Access Control

Standard Roles

Within ClusterControl the default roles are: Super Admin, Admin and User. The Super Admin is the only account that can administer teams, users and roles. The Super Admin is also able to migrate clusters across across teams or organizations. The admin role belongs to a specific organization and is able to see all clusters in this organization. The user role is only able to see the clusters he/she created.

User Roles

You can add new roles within the role based access control screen. You can define the privileges per functionality whether the role is allowed (read-only), denied (deny), manage (allow change) or modify (extended manage).

If we create a role with limited access:

As you can see, we can create a user with limited access rights (mostly read-only) and ensure this user does not break anything. This also means we could add non-technical roles like Manager here.

Notice that the Super Admin role is not listed here as it is a default role with the highest level of privileges within ClusterControl and thus can’t be changed.

LDAP Access

ClusterControl supports Active Directory, FreeIPA and LDAP authentication. This allows you to integrate ClusterControl within your organization without having to recreate the users. In earlier blog posts we described how to set up ClusterControl to authenticate against OpenLDAP, FreeIPA and Active Directory.

Once this has been set up authentication against ClusterControl will follow the chart below:

Basically the most important part here is to map the LDAP group to the ClusterControl role. This can be done fairly easy in the LDAP Settings page under User Management.

The dialog above would map the DevopsTeam to the Limited User role in ClusterControl. Then repeat this for any other group you wish to map. After this any user authenticating against ClusterControl will be authenticated and authorized via the LDAP integration.

Final thoughts

Combining all the above allows you to integrate ClusterControl better into your existing organization, create specific roles with limited or full access and connect users to these roles. The beauty of this is that you are now much more flexible in how you organize around your database infrastructure: who is allowed to do what? You could for instance offload the task of backup checking to a site reliability engineer instead of having the DBA check them daily. Allow your developers to check the MySQL, Postgres and MongoDB log files to correlate them with their monitoring. You could also allow a senior developer to scale the database by adding more nodes/shards or have a seasoned DevOps engineer write advisors.

As you can see the possibilities here are endless, it is only a question of how to unlock them. In the Developer Studio blog series, we dive deeper into automation with ClusterControl and for DevOps integration we recently released CCBot.


New Whitepaper: How to Automate and Manage MongoDB with ClusterControl

$
0
0

At the time of writing this blog, MongoDB is the world’s leading NoSQL database server, and (per DB-Engines ranking, the most widely-known ranking in the database industry) the 5th database server overall in terms of popularity.

As you may have seen before, we’ve published a ‘Become a MongoDB DBA’ blog series, which covers all the need-to-know information when getting started with MongoDB (for example, when you’re rather a MySQL DBA) and we have now taken the next logical step in our work on MongoDB by producing this new white paper: MongoDB Management and Automation with ClusterControl.

This white paper extends on the Become a MongoDB DBA series by focussing further on how to manage and automate MongoDB with the help of ClusterControl, our all-inclusive management system for open source databases.

While MongoDB does have great features for developers, some key questions arise:

What of the operational management of a production environment?

How easy is it to deploy a distributed environment, and then manage it?

In this whitepaper, we cover some of the fundamentals of MongoDB, and show you how a clustered environment can be automated with ClusterControl.

Download the white paper

To summarise, in this white paper, we have reviewed the challenges involved in managing MongoDB at scale and have introduced mitigating features of ClusterControl. As a best of breed database management solution, ClusterControl brings consistency and reliability to your database environment, and simplifies your database operations at scale.

The main topics covered include...

Considerations for administering MongoDB

  • Built-in Redundancy
  • Scalability
  • Arbiters
  • Delayed Replica Set Members
  • Backups
  • Monitoring

Automation with ClusterControl

  • Deployment
  • Backup & Restore
  • Monitoring
  • MongoDB Advisors
  • Integrations
  • Command-Line Access

Download the white paper

ClusterControl
Single Console for Your Entire Database Infrastructure
Find out what else is new in ClusterControl

ClusterControl is the all-inclusive open source database management system for users with mixed environments that removes the need for multiple management tools. It provides advanced deployment, management, monitoring, and scaling functionality to get your MySQL, MongoDB, and PostgreSQL databases up- and- running using proven methodologies that you can depend on to work. At the core of ClusterControl is its automation functionality that lets you automate many of the database tasks you have to perform regularly like deploying new databases, adding and scaling new nodes, running backups and upgrades, and more.

Download ClusterControl

Updated: Become a ClusterControl DBA - Deploying your Databases and Clusters

$
0
0

We get some nice feedback with regards to our product ClusterControl, especially how easy it is to install and get going. Installing new software is one thing, but using it properly is another.

It is not uncommon to be impatient to test new software and one would rather toy around with a new exciting application than to read documentation before getting started. That is a bit unfortunate as you may miss important features or misunderstand how to use them.

This blog series covers all the basic operations of ClusterControl for MySQL, MongoDB & PostgreSQL with examples on how to make the most of your setup. It provides you with a deep dive on different topics to save you time.

These are the topics covered in this series:

  • Deploying the first clusters
  • Adding your existing infrastructure
  • Performance and health monitoring
  • Making your components HA
  • Workflow management
  • Safeguarding your data
  • Protecting your data
  • In depth use case

In today’s post, we’ll cover installing ClusterControl and deploying your first clusters.

Preparations

In this series, we will make use of a set of Vagrant boxes but you can use your own infrastructure if you like. In case you do want to test it with Vagrant, we made an example setup available from the following Github repository: https://github.com/severalnines/vagrant

Clone the repo to your own machine:

$ git clone git@github.com:severalnines/vagrant.git

The topology of the vagrant nodes is as follows:

  • vm1: clustercontrol
  • vm2: database node1
  • vm3: database node2
  • vm4: database node3

You can easily add additional nodes if you like by changing the following line:

4.times do |n|

The Vagrant file is configured to automatically install ClusterControl on the first node and forward the user interface of ClusterControl to port 8080 on your host that runs Vagrant. So if your host’s ip address is 192.168.1.10, you will find the ClusterControl UI here: http://192.168.1.10:8080/clustercontrol/

Installing ClusterControl

You can skip this if you chose to use the Vagrant file, and get the automatic installation. But installation of ClusterControl is straightforward and will take less than five minutes.

With the package installation, all you have to do is to issue the following three commands on the ClusterControl node to get it installed:

$ wget http://www.severalnines.com/downloads/cmon/install-cc
$ chmod +x install-cc
$ ./install-cc   # as root or sudo user

That’s it: it can’t get easier than this. If the installation script has not encountered any issues, then ClusterControl should be installed and up and running. You can now log into ClusterControl on the following URL: http://192.168.1.210/clustercontrol

After creating an administrator account and logging in, you will be prompted to add your first cluster.

Deploy a Galera cluster

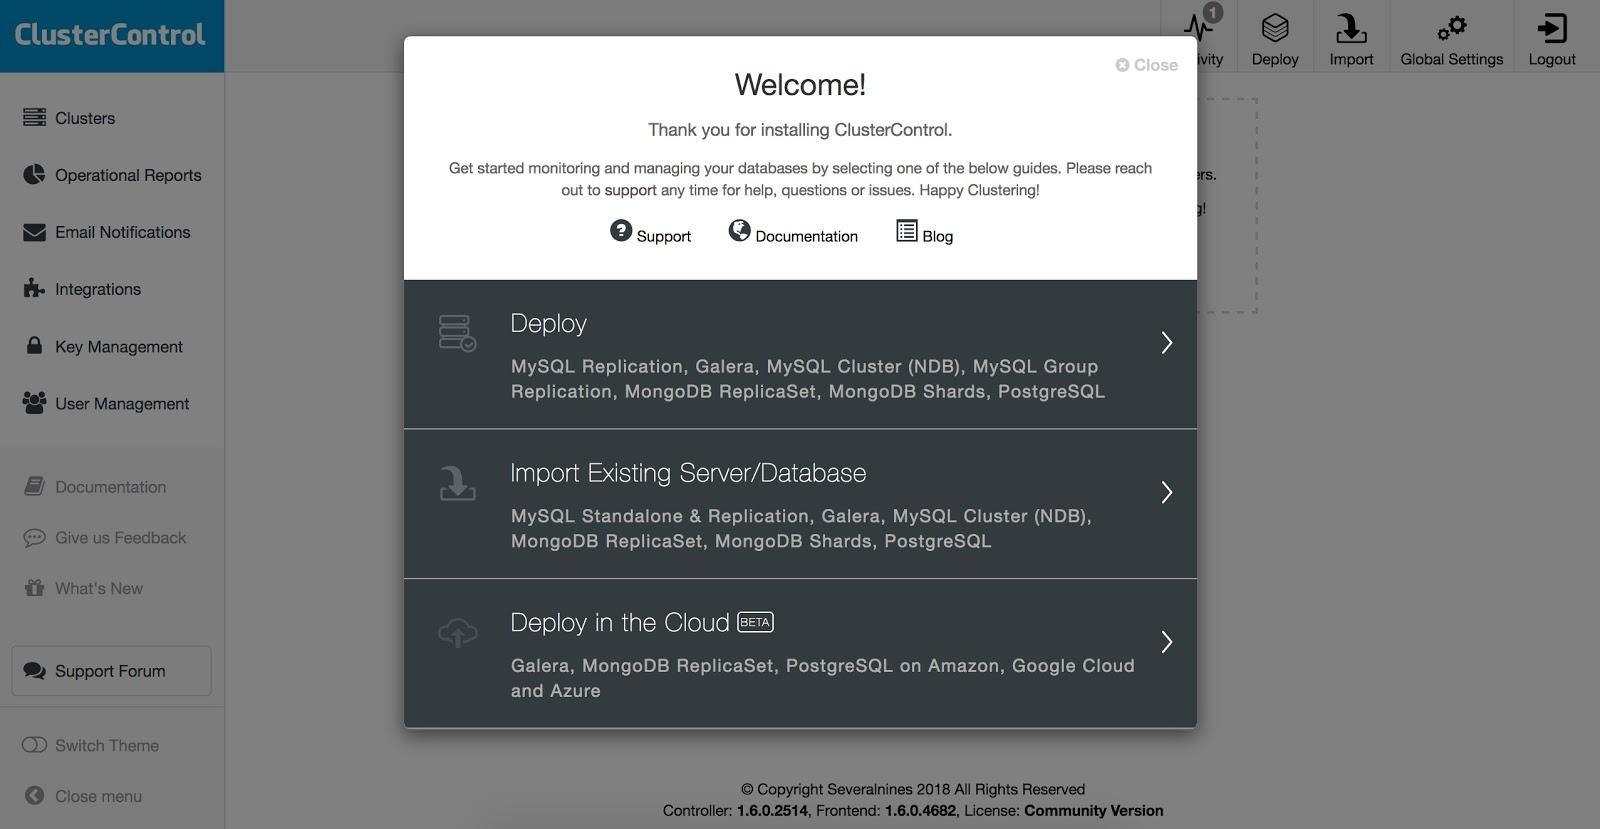
You will be prompted to create a new database server/cluster or import an existing (i.e., already deployed) server or cluster:

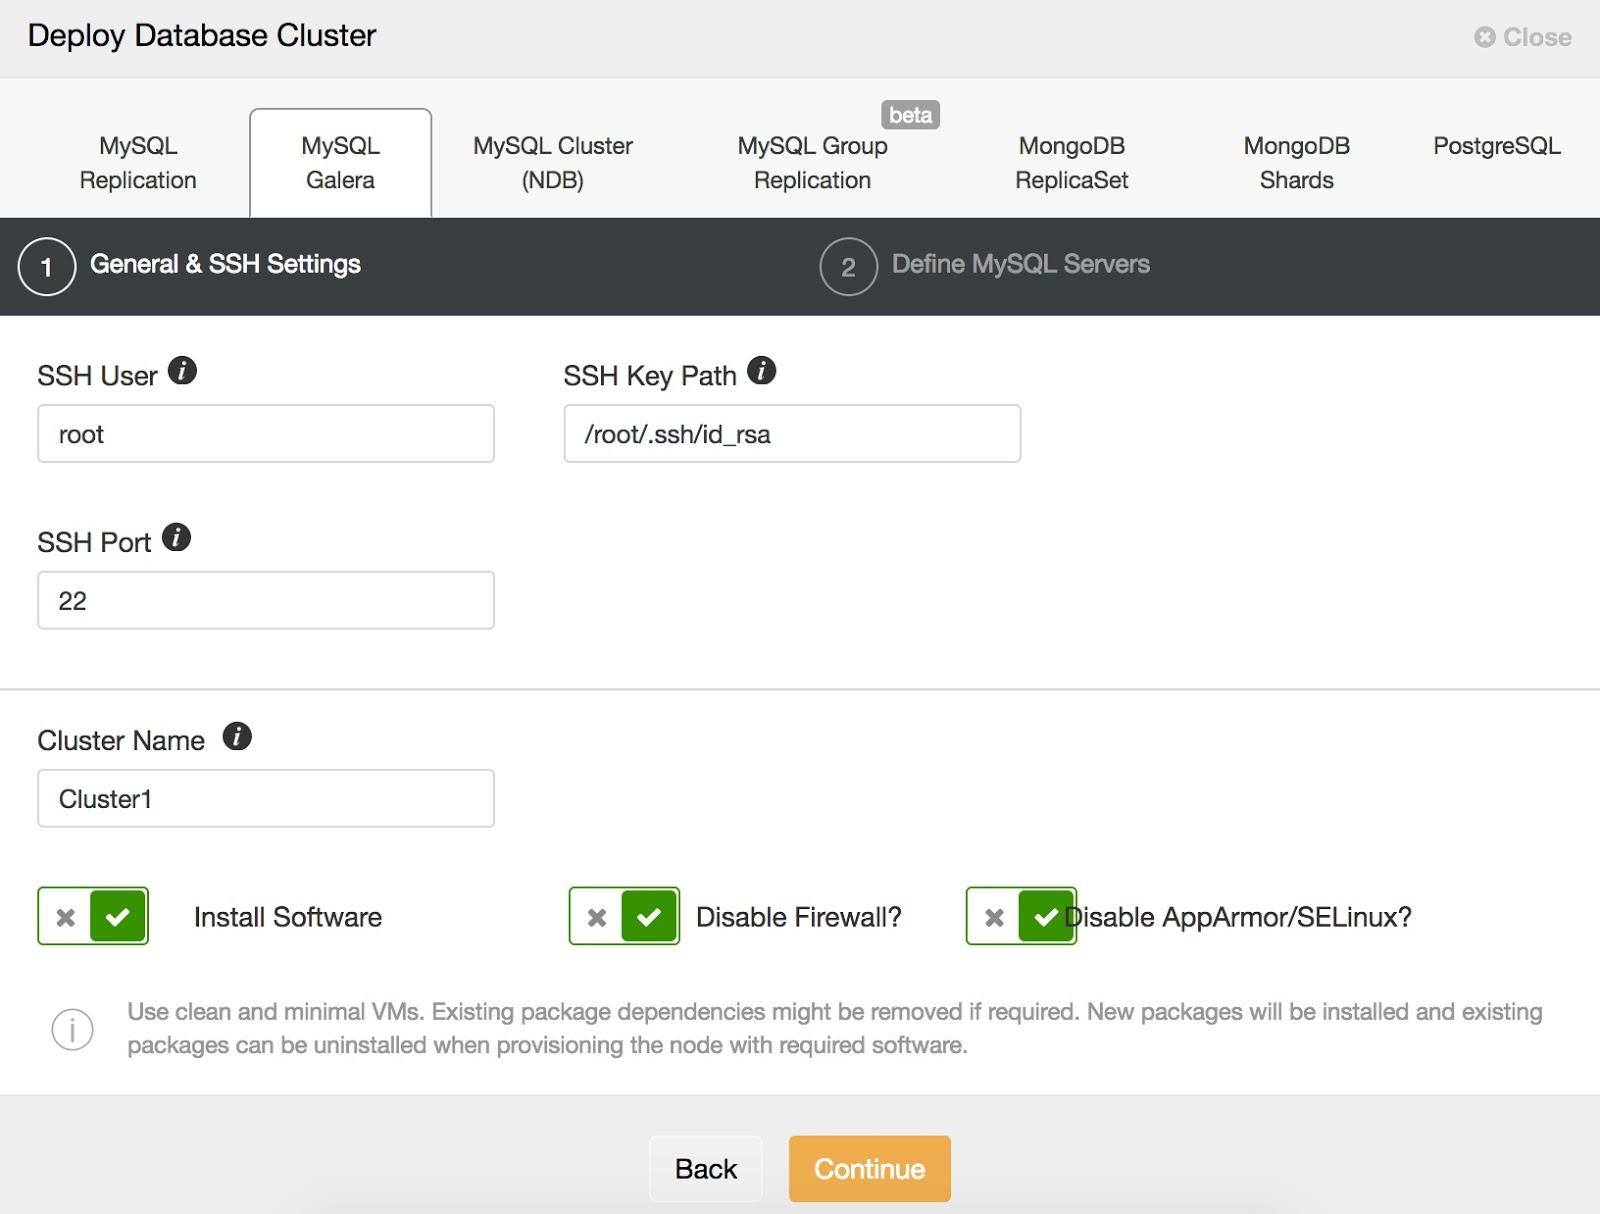
We are going to deploy a Galera cluster. There are two sections that need to be filled in. The first tab is related to SSH and general settings:

To allow ClusterControl to install the Galera nodes, we use the root user that was granted SSH access by the Vagrant bootstrap scripts. In case you chose to use your own infrastructure, you must enter a user here that is allowed to do passwordless SSH to the nodes that ClusterControl will control. Just keep in mind that you have to setup passwordless SSH from ClusterControl to all database nodes by yourself beforehand.

Also make sure you disable AppArmor/SELinux. See here why.

Then, proceed to the second stage and specify the database related information and the target hosts:

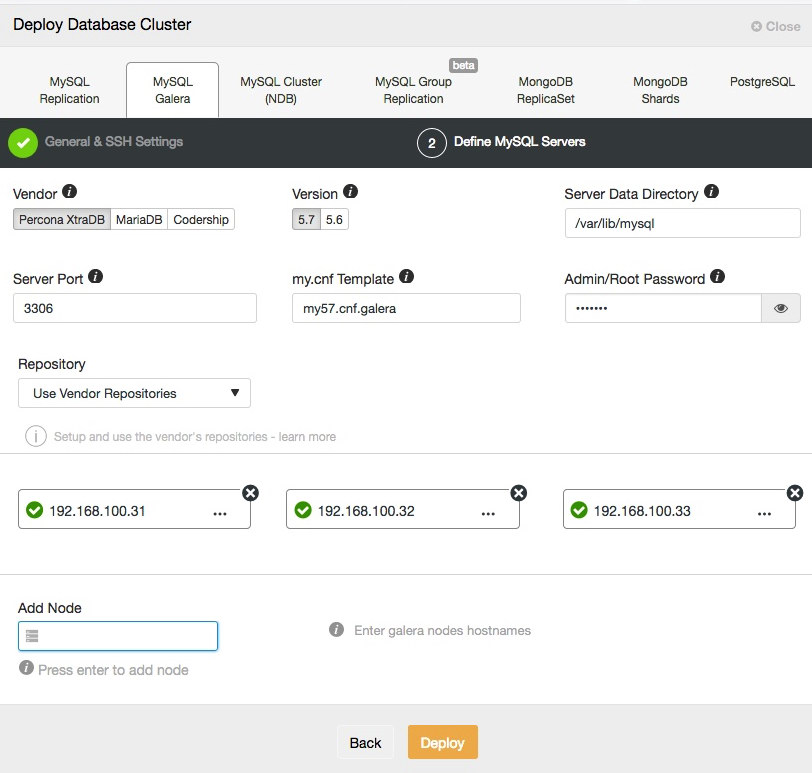
ClusterControl will immediately perform some sanity checks each time you press Enter when adding a node. You can see the host summary by hovering over each defined node. Once everything is green, it means that ClusterControl has connectivity to all nodes, you can click Deploy. A job will be spawned to build the new cluster. The nice thing is that you can keep track of the progress of this job by clicking on the Activity -> Jobs -> Create Cluster -> Full Job Details:

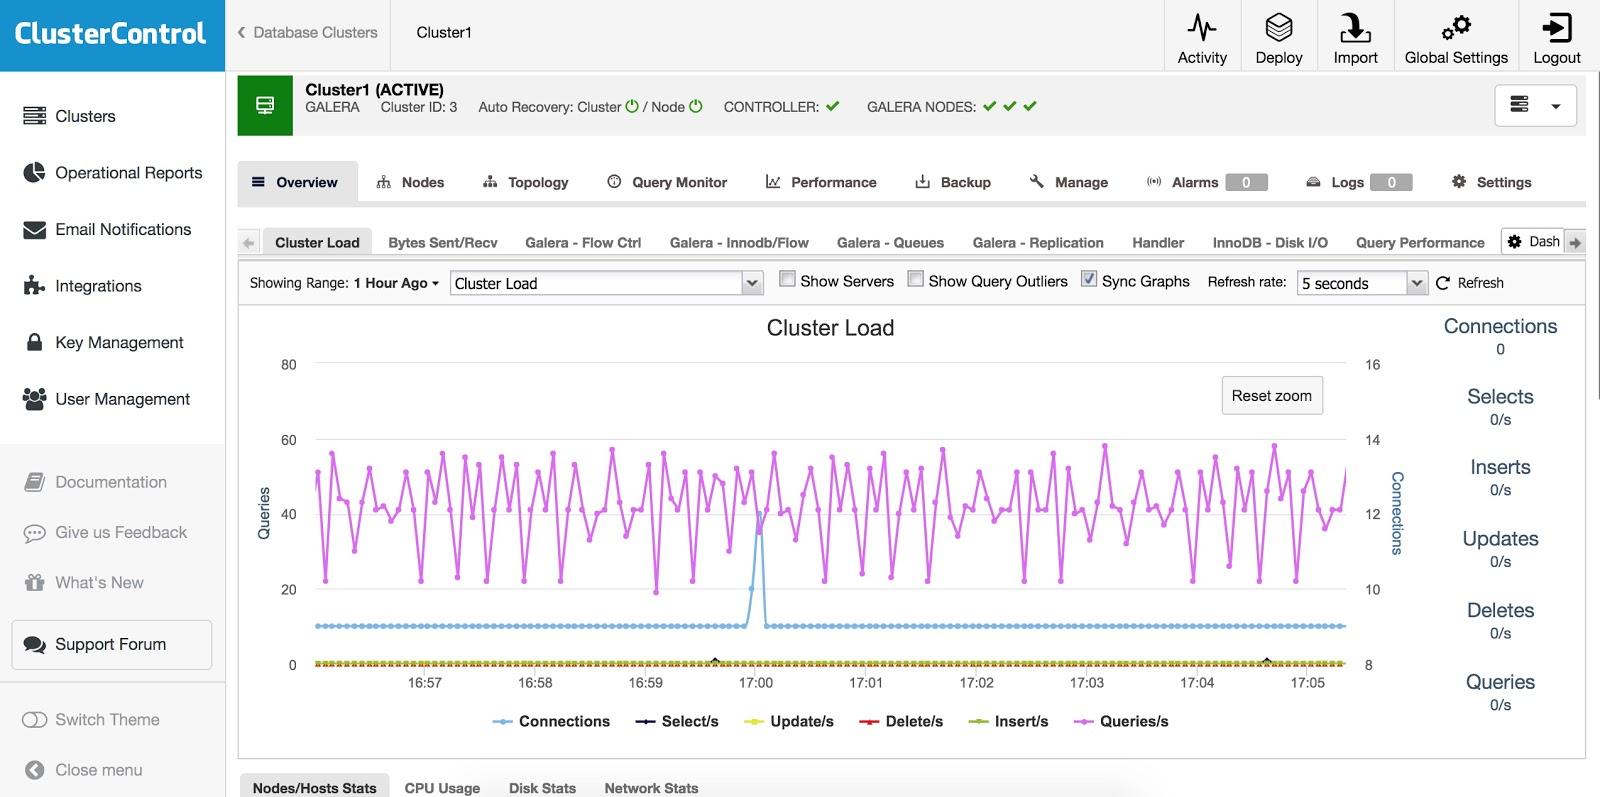
Once the job has finished, you have just created your first cluster. The cluster overview should look like this:

In the nodes tab, you can do about any operation you normally would do on a cluster. The query monitor gives you a good overview of both running and top queries. The performance tab will help you keep a close eye on the performance of your cluster and also features the advisors that help you act proactively on trends in data. The backup tab enables you to easily schedule backups and store them on local or cloud storage. The manage tab enables you to expand your cluster or make it highly available for your applications through a load balancer.

All this functionality will be covered in later blog posts in this series.

Deploy a MySQL Replication Cluster

Deploying a MySQL Replication setup is similar to Galera database deployment, except that it has an additional tab in the deployment dialog where you can define the replication topology:

You can set up standard master-slave replication, as well as master-master replication. In case of the latter, only one master will remain writable at a time. Keep in mind that master-master replication doesn't come with conflict resolution and guaranteed data consistency, as in the case of Galera. Use this setup with caution, or look into Galera cluster. Once everything is green and you have clicked Deploy, a job will be spawned to build the new cluster.

Again, the deployment progress is available under Activity -> Jobs.

To scale out the slave (read copy), simply use the “Add Node” option in the cluster list:

After adding the slave node, ClusterControl will provision the slave with a copy of the data from its master using Xtrabackup or from any existing PITR compatible backups for that cluster.

Deploy PostgreSQL Replication

ClusterControl supports the deployment of PostgreSQL version 9.x and higher. The steps are similar with MySQL Replication deployment, where at the end of the deployment step, you can define the database topology when adding the nodes:

Similar to MySQL Replication, once the deployment completes, you can scale out by adding replications slave to the cluster. The step is as simple as selecting the master and filling in the FQDN for the new slave:

ClusterControl will then perform the necessary data staging from the chosen master using pg_basebackup, configure the replication user and enable the streaming replication. The PostgreSQL cluster overview gives you some insight into your setup:

Just like with the Galera and MySQL cluster overviews, you can find all the necessary tabs and functions here: the query monitor, performance, backup tabs all enable you to do the necessary operations.

Deploy a MongoDB Replica Set

Deploying a new MongoDB Replica Set is similar to the other clusters. From the Deploy Database Cluster dialog, pick MongoDB ReplicatSet, define the preferred database options and add the database nodes:

You can either choose to install Percona Server for MongoDB from Percona or MongoDB Server from MongoDB, Inc (formerly 10gen). You also need to specify the MongoDB admin user and password since ClusterControl will deploy by default a MongoDB cluster with authentication enabled.

After installing the cluster, you can add an additional slave or arbiter node into the replica set using the "Add Node" menu under the same dropdown from the cluster overview:

After adding the slave or arbiter to the replica set, a job will be spawned. Once this job has finished it will take a short while before MongoDB adds it to the cluster and it becomes visible in the cluster overview:

Final thoughts

With these three examples we have shown you how easy it is to set up different clusters from scratch in only a couple of minutes. The beauty of using this Vagrant setup is that, as easy as spawning this environment, you can also take it down and then spawn again. Impress your fellow colleagues by showing how quickly you can setup a working environment.

Of course it would be equally interesting to add existing hosts and already-deployed clusters into ClusterControl, and that’s what we'll cover next time.

How to Get Started with ClusterControl

$
0
0

Managing database production systems takes a ton of work. Even with all the passion you can muster, it is never an easy undertaking. For one, the times when you had single database vendor are gone. The competition in the market is very strong. Developers, architects, everyone takes what’s best for their application. You regularly need to improve your staff’s technical skills because these days companies need to develop fast and enter the market as soon as possible. On the other side, the number of database software features is growing, and it is not easy to stay on top of everything. Your stakeholders expect you to keep your environment up and running, secure and flexible enough so you can participate in automated testing and deployments.

With this blog post w are going to show you how to become a modern DBA and achieve your goals with ClusterControl, the ready-made solution that will automate your database system lifecycle no time.

Installation

Let's start with the ClusterControl installation process. There are two basic methods to choose from, repository or manual installation. In both cases, the process is simple and straightforward. If you have an open internet connection, you can install Cloud Control from the package repository. You can download the Severalnines repository from the Severalnines download page:

wget http://www.severalnines.com/downloads/cmon/s9s-repo.repo -P /etc/yum.repos.d/
rpm --import http://repo.severalnines.com/severalnines-repos.asc

For the offline installation, the first step is to download the binaries and execute the wizard script, which will guide you through the installation process. A helper script will install and configure ClusterControl packages in an internetless environment.

/var/www/clustercontrol/app/tools/setup-cc.sh

After the installation, which usually takes several minutes, you will be able to login to the web interface. Make sure to use Firefox or Chrome. What you can see now is the ClusterControl web interface configured and ready to start. So let's try it.

During the first login, you will be asked to create an account; you will need that later so make sure to store the password in a safe place. ClusterControl allows creating multiple user accounts based on their roles and you can synchronize logins with your LDAP server.

ClusterControl Login page

Because at this point you do not have any cluster deployed you will see a prompt to either deploy a new cluster or import / add existing nodes. But don’t worry, you do not need to install any agent; ClusterControl will ask you instead to provide ssh authentication keys. If you do not know how to create ssh keys, please check our documentation.

So you have your first nodes added to ClusterControl. Usually, at this point, we look around, check current performance, graphs, active connections, explore monitoring metrics. However, we would like to encourage you to check several unique functions that will significantly automate your work for newly added nodes.

Cluster Topology

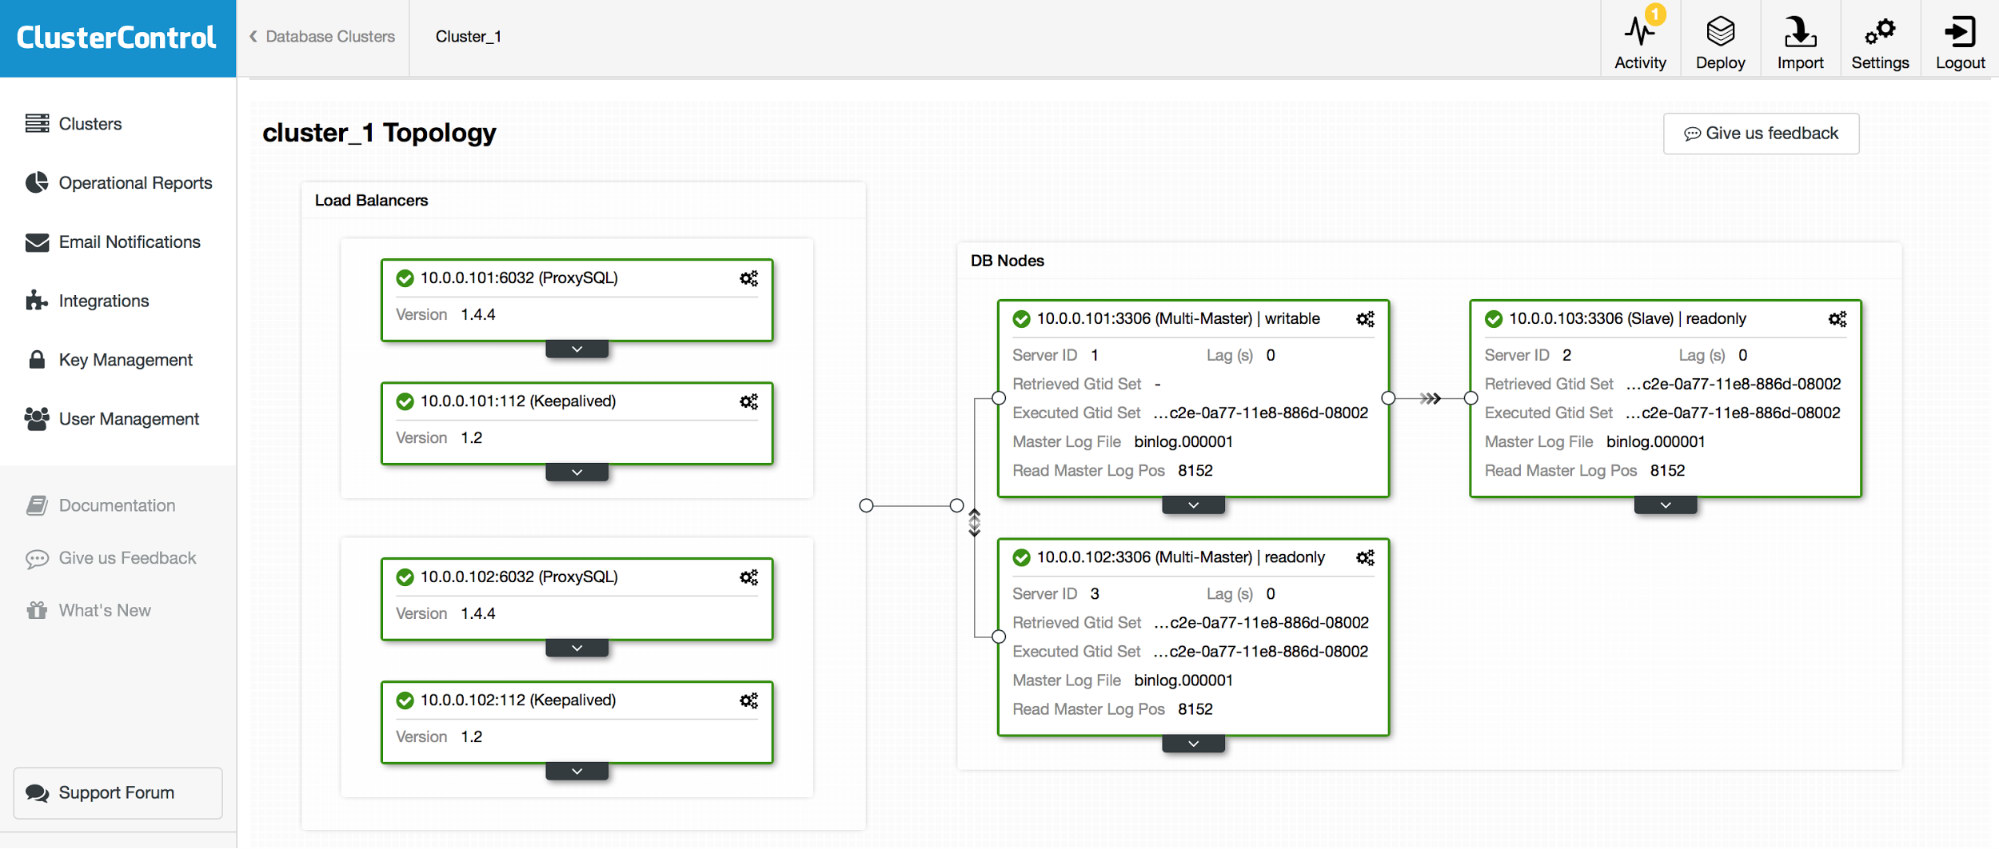
The Cluster Topology view allows you to check the graphical interpretation of your environment. ClusterControl scans your configuration and based on these, it creates visual blocks and connections between them. From here you can manage your database nodes, do switchovers or even reboot the nodes and sync data. You can also see here if there are ongoing issues. Besides that ClusterControl adds additional pre-checks for the actions that you want to perform. Predefined checks do not allow to execute tasks that may cause data loss or fail to complete. You will find topology very useful in sophisticated matrix environments as well as three node cluster.

ClusterControl topology view

Various Advisors

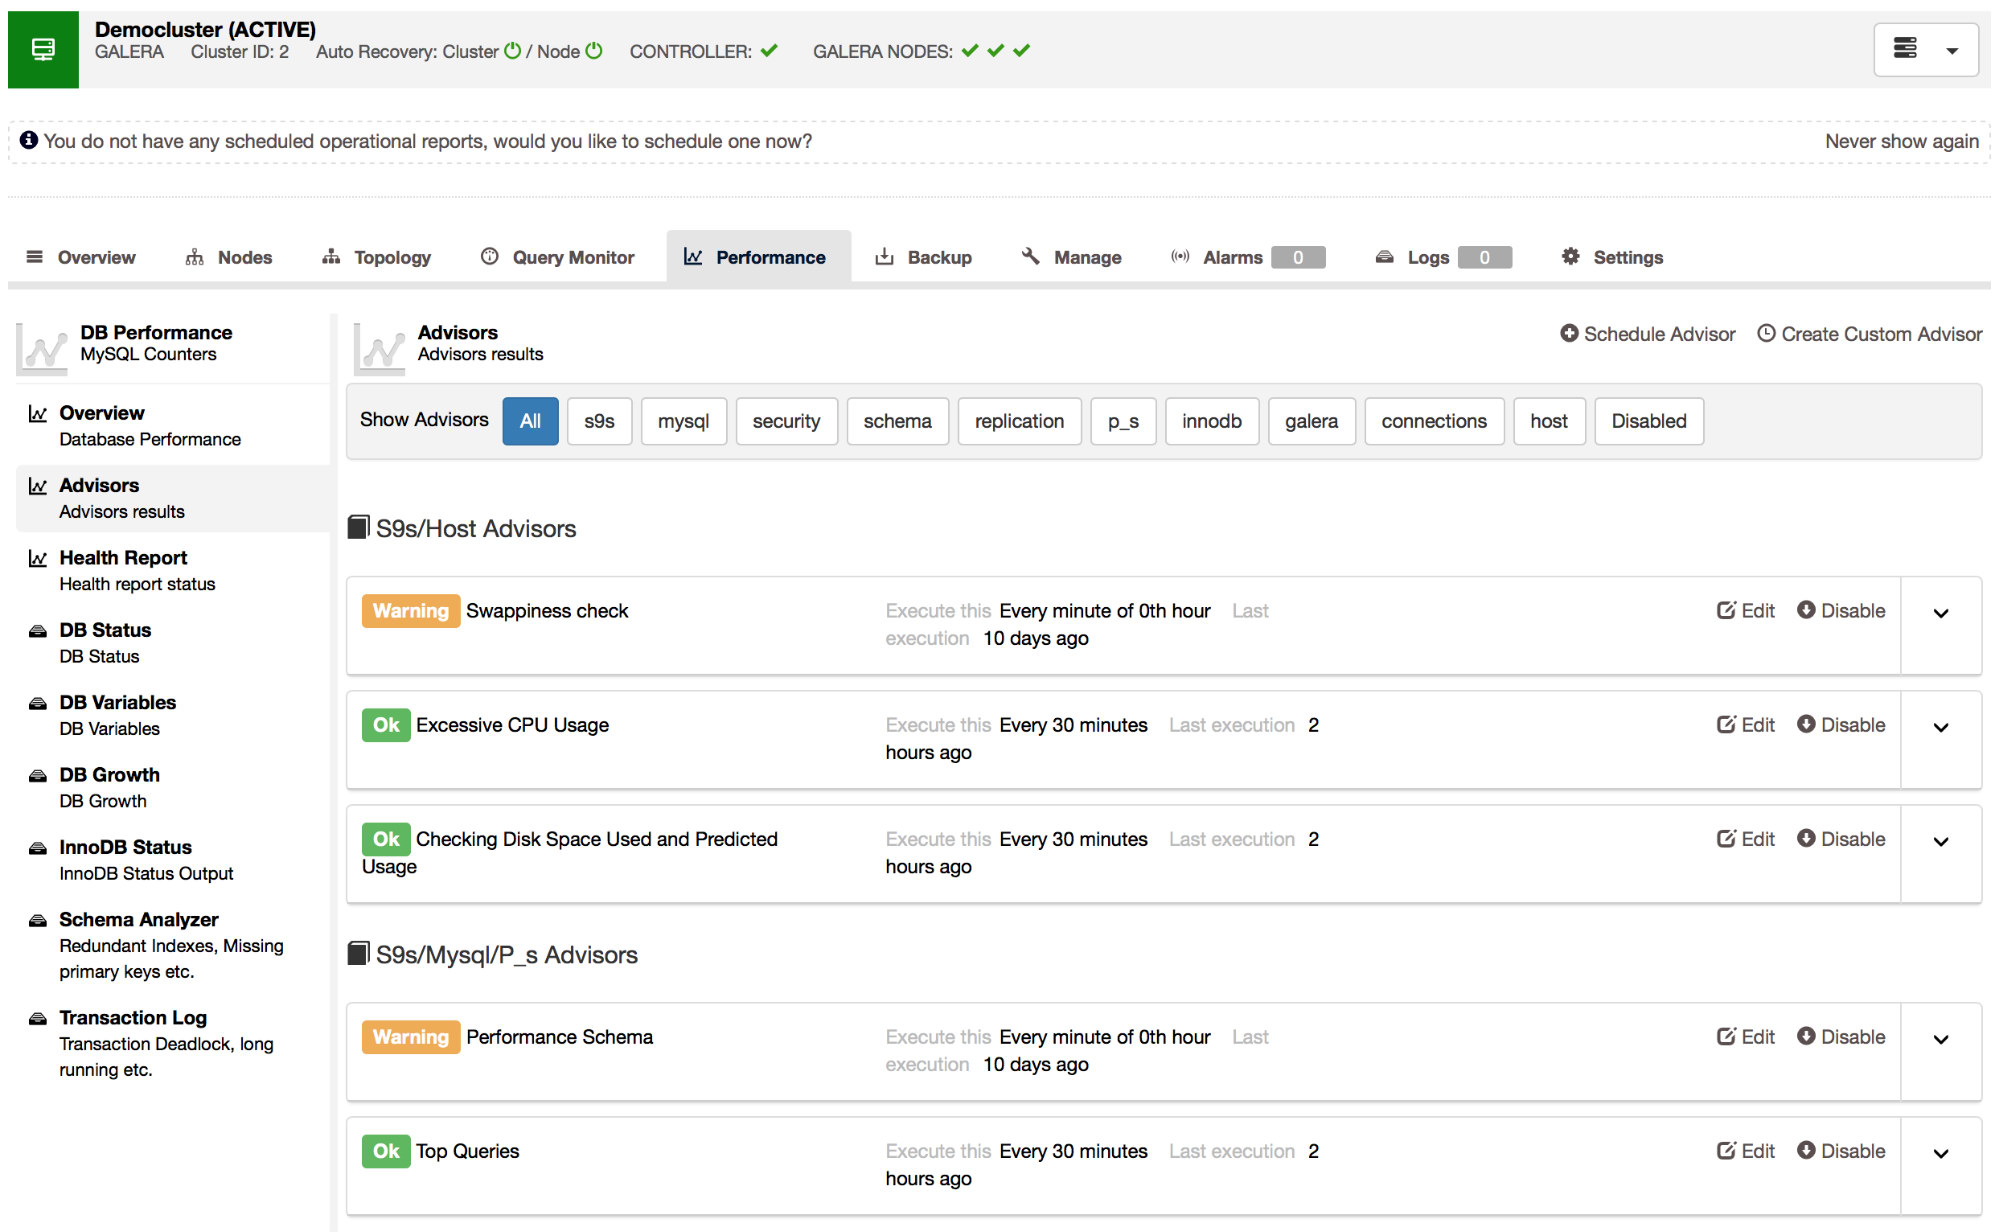
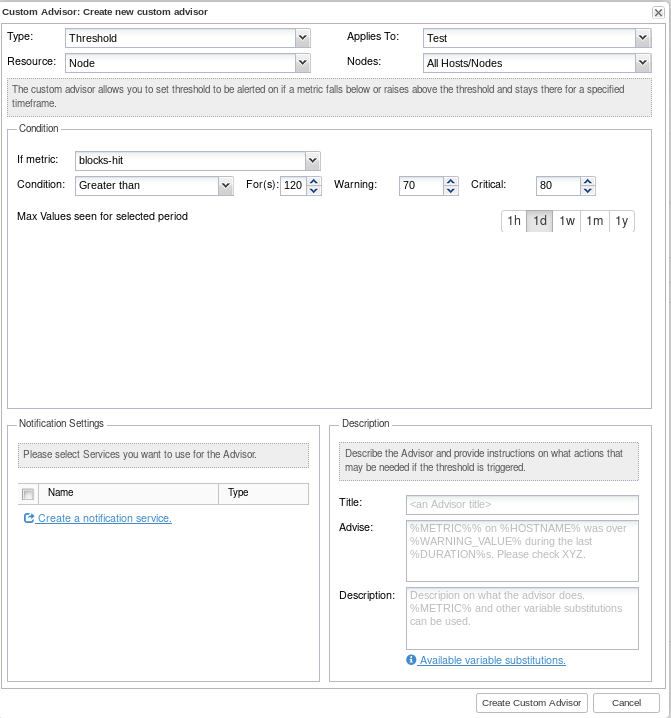
We build numerous advisors in ClusterControl for each type of database system so you can see if your system is set correctly. These custom advisors allows you to set the threshold to be alerted on if a metric falls below or rises above the threshold and stays there for a specified timeframe. Built in advisors are divided into multiple sections: All, s9s, mysql, security, schema, replication, Percona schema, InnoDB, Galera, connections, and hosts. Among the different types of advisors, you can see security checks, resource usage thresholds through to more sophisticated ones such as an advisor that determines the write load on a Galera cluster and estimates if the Galera cache file is sufficient in size to sustain a replication window threshold.

ClusterControl Advisors

Operational reports

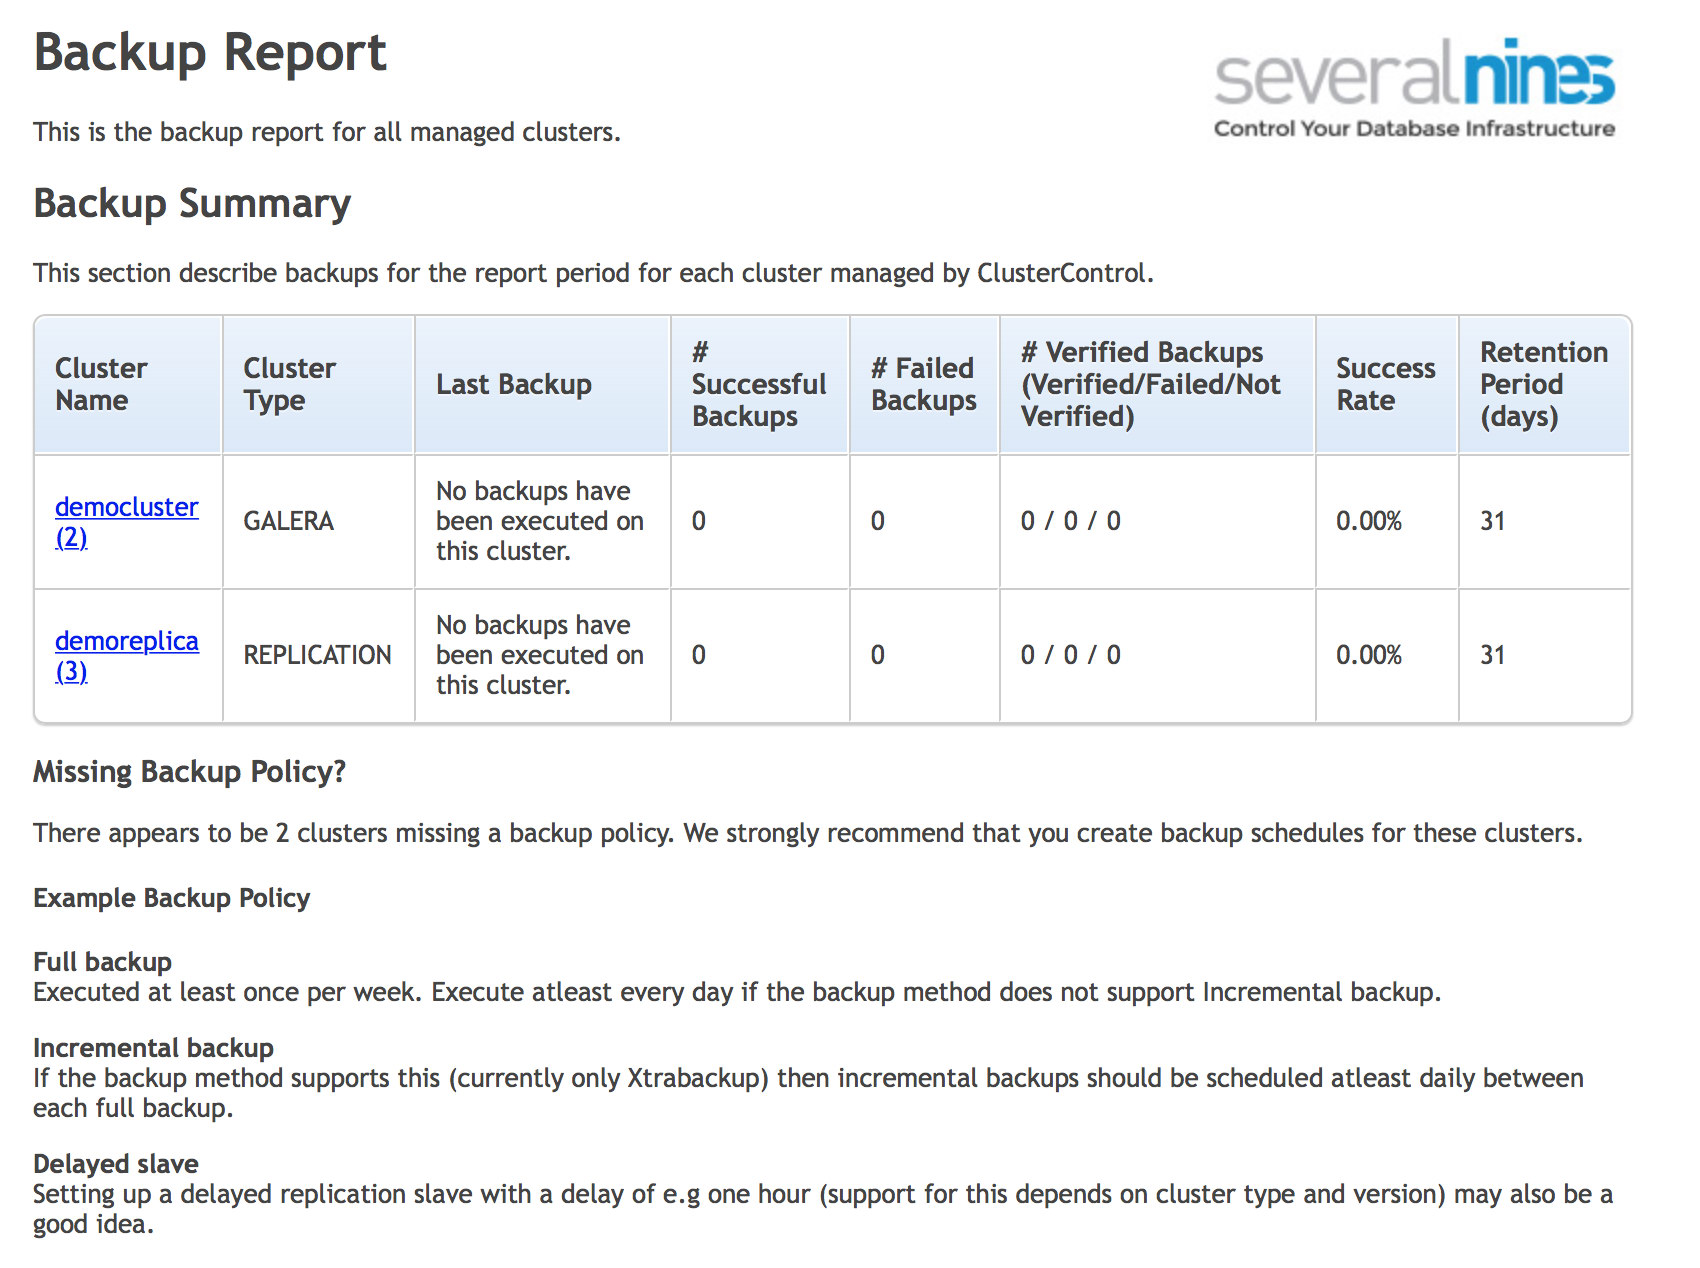
Operational reports can help you with daily checks that you need to perform in your environment. You can schedule cross environment reports like "Daily System Report,""Package Upgrade Report,""Schema Change Report" as well as "Backups" and "Availability" reports. It will help you to keep your environment secure and operational, and you will see recommendations on how to fix gaps. Below you can see an example of a backup report for a three node cluster. Such reports can be addressed to Sysops, DevOps or even managers who would like to get regular status updates about a given system’s health.

ClusterControl backup report

Manage Upgrades

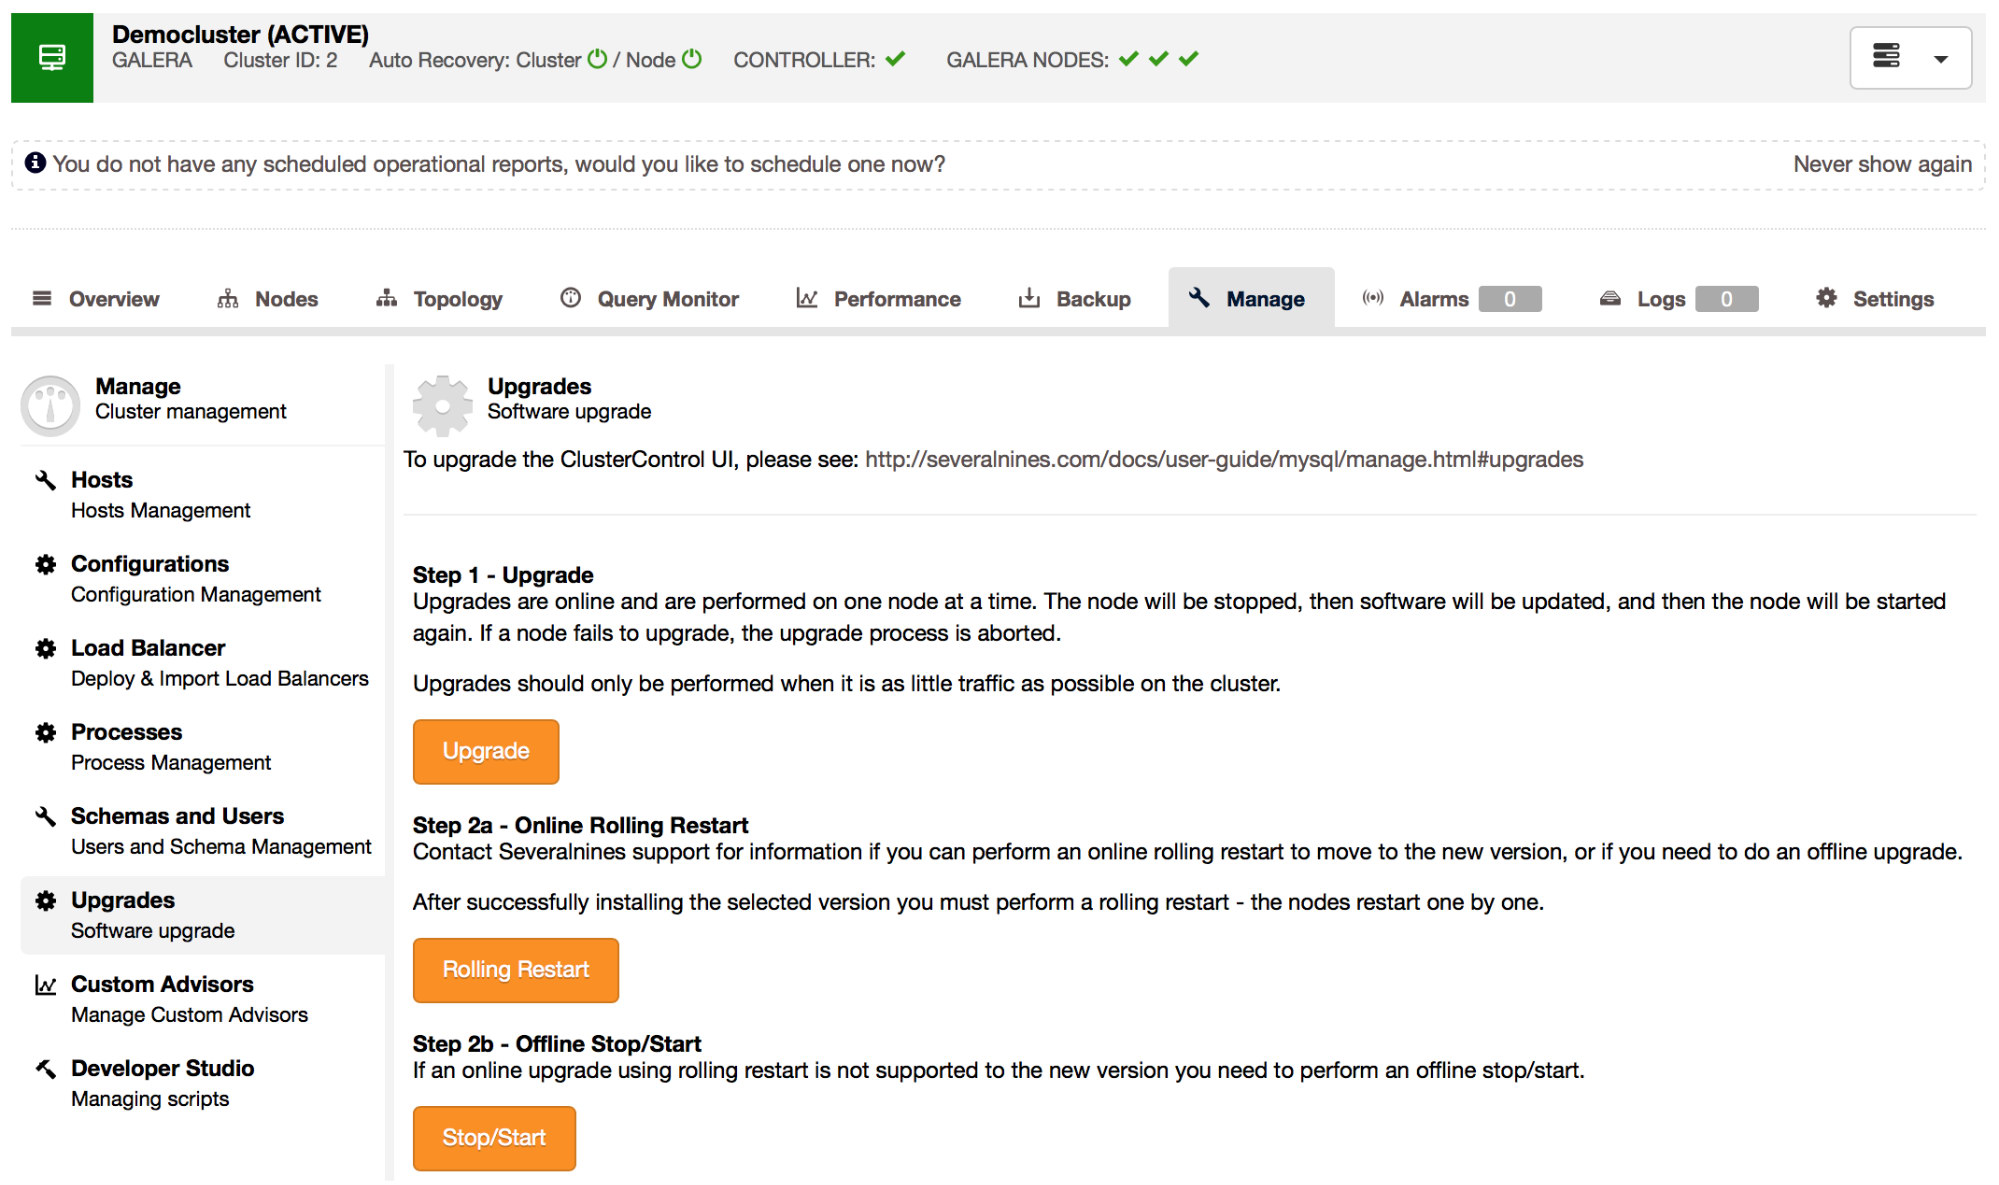
In ClusterControl’s database management section you can find multiple options, such as host configuration, database configuration, load balancers, processes management, schema and users management mentioned advisors, developer studio, and upgrades. Let's take a look at upgrades. If the database versions support it, you can execute your nodes upgrade in rolling restart mode. If a rolling restart is not supported, then you can either stop start nodes from the ClusterControl GUI. Upgrades are performed online and are performed on one node at a time. The node will be stopped, then the software will be updated, and then the node will be started again. ClusterControl monitors the entire process and if a node fails to upgrade then the whole process is aborted, and new nodes will not get the update.

ClusterControl Manage Upgrade

Third party integration

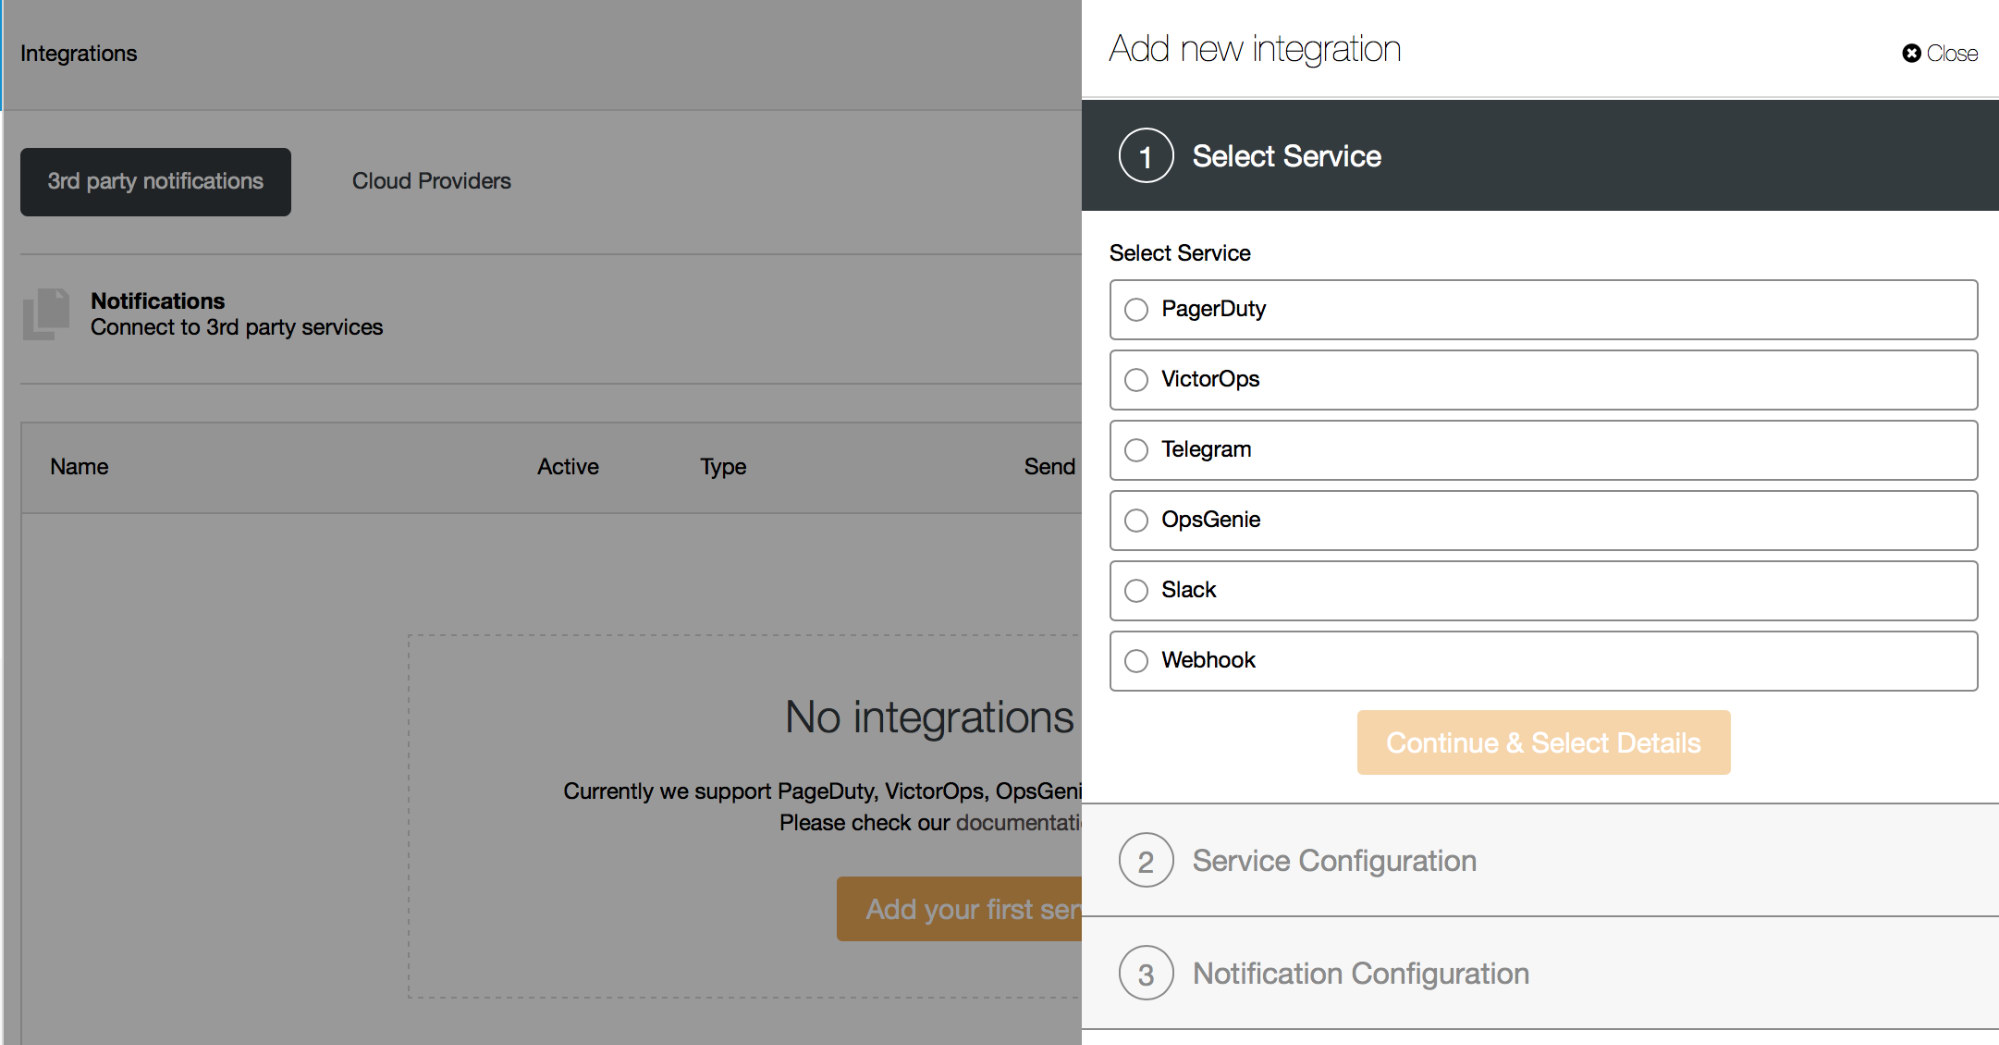
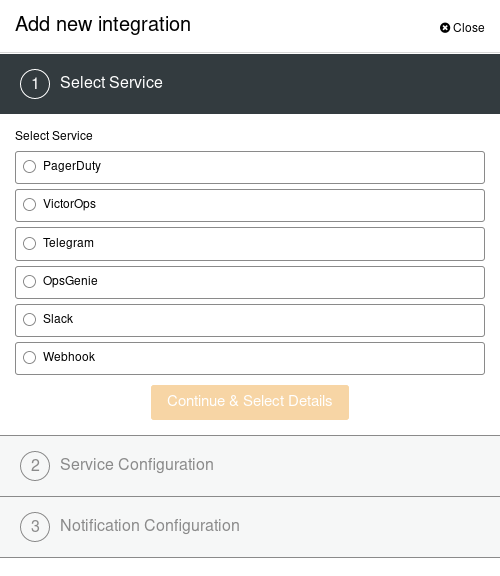
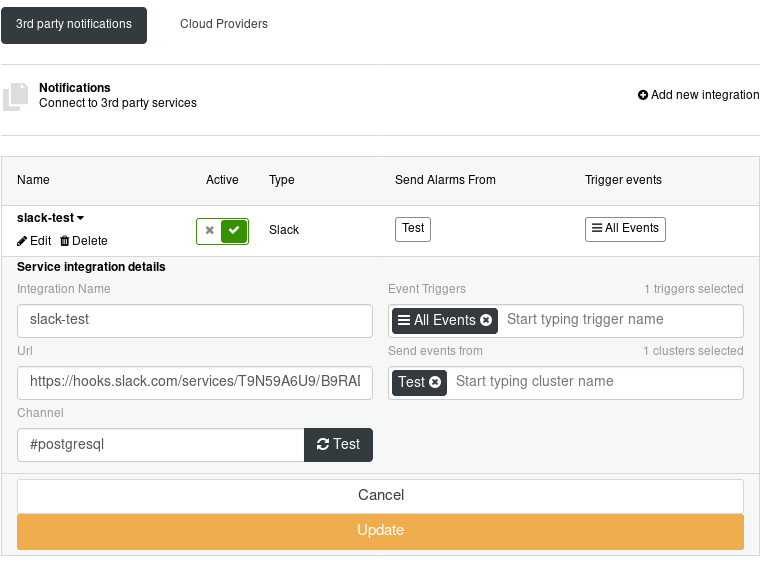
Third party tools integration enables you to automate alerts with other popular systems. Currently, we support PagerDuty, VictorOps, OpsGenie, Slack, Telegram, and Webhooks. For example, you can create a slack channel that will get notifications from your database systems, so interested teams can see it from there or page your DBA when the system is down via PagerDuty; and if your other ticketing systems uses Webhooks, you can integrate it as well.

ClusterControl third party tool integration

We hope this blog post will help you to take your first steps with ClusterControl. If you have any questions or need any assistance during the initial configuration, installation or if you need a demonstration session, please do not hesitate to contact our team.

Join Us in Amsterdam for a Meetup with OptimaData & VidaXL

$
0
0

Severalnines, our partner OptimaData, and customer VidaXL are joining forces to present the meetup “How to Manage Fast Growing Databases” in Amsterdam featuring a myriad of technical information and tips on load balancing, automation, open source database management and more!

Join us on April 10th at Circl (Gustav Mahlerplein 1B, Amsterdam) where we will have 2 great talks lined up for you.

First Krzysztof Książek – Senior Support Engineer at Severalnines- will kick off and give you an extensive insight into the vast array of options to load balance your MySQL databases.

Furthermore we are very pleased that Zeger Knops- Head of Technology VidaXL has agreed to share his experiences with Database Automation within the fast growing international platform of VidaXL.

AGENDA

  • 18:00 - 18:25: Arrival and Drinks
  • 18:25 - 18:30: Welcome by organizers
  • 18:30 - 19:15: Krzysztof Książek, Senior Support Engineer at Severalnines; Talk on MySQL Load balancers (Specifically MaxScale, ProxySQL, HAProxy, MySQL Router & nginx)
  • 19:15 - 20:00: Zeger Knops, Head of Business Technology at VidaXL; Talk on Leveraging Database Automation in a Fast-paces Global Environment.

Sign Up Here

Program

Krzysztof Książek - Senior Support Engineer Severalnines

MySQL Load Balancers - MaxScale, ProxySQL, HAProxy, MySQL Router & nginx - a close-up look

Load balancing MySQL connections and queries using HAProxy has been popular in the past years. Recently however, we have seen the arrival of MaxScale, MySQL Router, ProxySQL and now also Nginx as a reverse proxy.For which use cases do you use them and how well do they integrate in your environment? This session aims to give a solid grounding in load balancer technologies for MySQL and MariaDB. We will review the main open-source options available: from application connectors (php-mysqlnd, jdbc), TCP reverse proxies (HAProxy, Keepalived, Nginx) and SQL-aware load balancers (MaxScale, ProxySQL, MySQL Router) and take a look into the best practices for backend health checks to ensure load balanced connections are routed to the correct nodes in several MySQL clustering topologies. You'll gain a good understanding of how the different options compare, and enough knowledge to decide which ones to explore further.

Zeger Knops – Head of Business Technology VidaXL

Leveraging database automation software in a fast paced international global e-commerce environment VidaXL is a rapidly growing international online retailer with is base in the Netherlands. Currently the company operates with 1000 employees 29 local webshops in Europe, US and Australia. Each business day it processes 15000 orders per day for their 2.5 million customers world wide. VidaXL is in the process of expanding its product catalogue to over 10,000,000 items within a short period of time. Scaling from thousands to millions of products is a giant leap and required a strong infrastructure foundation and high performing and high available (MySQL and MongoDB) databases. To achieve this VidaXL has opted for database management automation software (ClusterControl) to achieve that In his talk Zeger will share his experience with you.

Location

This meetup will be held at the magnificent circular building Circl in Amsterdam. In the Event space where this meetup will take place at Circl you will get a welcome drink, before the start of the agenda.

Circl is very easy to reach. From the Amsterdam Zuid train station you can walk to Circl in a few minutes. At station Amsterdam Zuid also stop metro line 51, metro line 50 and tram 5. Also bus number 62 stops nearby, stop Hogewerf.

Travelling by car? The address of Circl is Gustav Mahlerplein 1B. Parking is possible at Q-Park Mahler (Aaron Coplandstraat 8, Amsterdam) or Q-Park Symphony (Leo Smitstraat 4, Amsterdam).

Learn More

About Severalnines

Severalnines provides automation and management software for database clusters. We help companies deploy their databases in any environment, and manage all operational aspects to achieve high-scale availability.

Severalnines' products are used by developers and administrators of all skills levels to provide the full 'deploy, manage, monitor, scale' database cycle, thus freeing them from the complexity and learning curves that are typically associated with highly available database clusters. Severalnines is often called the “anti-startup” as it is entirely self-funded by its founders. The company has enabled over 32,000 deployments to date via its popular product ClusterControl. Currently counting BT, Orange, Cisco, CNRS, Technicolor, AVG, Ping Identity and Paytrail as customers. Severalnines is a private company headquartered in Stockholm, Sweden with offices in Singapore, Japan and the United States.

About OptimaData BV

OptimaData is a full-service, multi-platform database services provider. OptimaData provides all services related to database management such as consultancy, managed services and training. In addition, OptimaData provides recruitment services for temporary and permanent database staff. OptimaData is a trusted partner for database related expertise and services for medium and large companies such as Travix, IceMobile, Budget Energie, Basecone and Volksbank.

Read About Our Partnership

About VidaXL

vidaXL is a rapidly growing international online retailer. Our success is based on our belief that things can always be better and cheaper: ‘Expect more’. Because nobody likes to pay too much for products. We are continually expanding our product range and offer the best products for the best price. We like to go the extra mile for our customers by improving popular products and making them even cheaper.

Read the Case Study

Updated: Become a ClusterControl DBA: Managing your Database Configurations

$
0
0

In the past five posts of the blog series, we covered deployment of clustering/replication (MySQL / Galera, MySQL Replication, MongoDB & PostgreSQL), management & monitoring of your existing databases and clusters, performance monitoring and health, how to make your setup highly available through HAProxy and MaxScale and in the last post, how to prepare yourself for disasters by scheduling backups.

Since ClusterControl 1.2.11, we made major enhancements to the database configuration manager. The new version allows changing of parameters on multiple database hosts at the same time and, if possible, changing their values at runtime.

We featured the new MySQL Configuration Management in a Tips & Tricks blog post, but this blog post will go more in depth and cover Configuration Management within ClusterControl for MySQL, PostgreSQL and MongoDB.

ClusterControl Configuration management

The configuration management interface can be found under Manage > Configurations. From here, you can view or change the configurations of your database nodes and other tools that ClusterControl manages. ClusterControl will import the latest configuration from all nodes and overwrite previous copies made. Currently there is no historical data kept.

If you’d rather like to manually edit the config files directly on the nodes, you can re-import the altered configuration by pressing the Import button.

And last but not least: you can create or edit configuration templates. These templates are used whenever you deploy new nodes in your cluster. Of course any changes made to the templates will not retroactively applied to the already deployed nodes that were created using these templates.

MySQL Configuration Management

As previously mentioned, the MySQL configuration management got a complete overhaul in ClusterControl 1.2.11. The interface is now more intuitive. When changing the parameters ClusterControl checks whether the parameter actually exists. This ensures your configuration will not deny startup of MySQL due to parameters that don’t exist.

From Manage -> Configurations, you will find an overview of all config files used within the selected cluster, including load balancer nodes.

We use a tree structure to easily view hosts and their respective configuration files. At the bottom of the tree, you will find the configuration templates available for this cluster.

Changing parameters

Suppose we need to change a simple parameter like the maximum number of allowed connections (max_connections), we can simply change this parameter at runtime.

First select the hosts to apply this change to.

Then select the section you want to change. In most cases, you will want to change the MYSQLD section. If you would like to change the default character set for MySQL, you will have to change that in both MYSQLD and client sections.

If necessary you can also create a new section by simply typing the new section name. This will create a new section in the my.cnf.

Once we change a parameter and set its new value by pressing “Proceed”, ClusterControl will check if the parameter exists for this version of MySQL. This is to prevent any non-existent parameters to block the initialization of MySQL on the next restart.

When we press “proceed” for the max_connections change, we will receive a confirmation that it has been applied to the configuration and set at runtime using SET GLOBAL. A restart is not required as max_connections is a parameter we can change at runtime.

Now suppose we want to change the bufferpool size, this would require a restart of MySQL before it takes effect:

And as expected the value has been changed in the configuration file, but a restart is required. You can do this by logging into the host manually and restarting the MySQL process. Another way to do this from ClusterControl is by using the Nodes dashboard.

Restarting nodes in a Galera cluster

You can perform a restart per node by selecting “Restart Node” and pressing the “Proceed” button.

When you select “Initial Start” on a Galera node, ClusterControl will empty the MySQL data directory and force a full copy this way. This is, obviously, unnecessary for a configuration change. Make sure you leave the “initial” checkbox unchecked in the confirmation dialog. This will stop and start MySQL on the host but depending on your workload and bufferpool size this could take a while as MySQL will start flushing the dirty pages from the InnoDB bufferpool to disk. These are the pages that have been modified in memory but not on disk.

Restarting nodes in a MySQL master-slave topologies

For MySQL master-slave topologies you can’t just restart node by node. Unless downtime of the master is acceptable, you will have to apply the configuration changes to the slaves first and then promote a slave to become the new master.

You can go through the slaves one by one and execute a “Restart Node” on them.

After applying the changes to all slaves, promote a slave to become the new master:

After the slave has become the new master, you can shutdown and restart the old master node to apply the change.

Importing configurations

Now that we have applied the change directly on the database, as well as the configuration file, it will take until the next configuration import to see the change reflected in the configuration stored in ClusterControl. If you are less patient, you can schedule an immediate configuration import by pressing the “Import” button.

PostgreSQL Configuration Management

For PostgreSQL, the Configuration Management works a bit different from the MySQL Configuration Management. In general, you have the same functionality here: change the configuration, import configurations for all nodes and define/alter templates.

The difference here is that you can immediately change the whole configuration file and write this configuration back to the database node.

If the changes made requires a restart, a “Restart” button will appear that allows you to restart the node to apply the changes.

MongoDB Configuration Management

The MongoDB Configuration Management works similar to the MySQL Configuration Management: you can change the configuration, import configurations for all nodes, change parameters and alter templates.

Changing the configuration is pretty straightforward, by using Change Parameter dialog (as described in the "Changing Parameters" section::

Once changed, you can see the post-modification action proposed by ClusterControl in the "Config Change Log" dialog:

You can then proceed to restart the respective MongoDB nodes, one node at a time, to load the changes.

Final thoughts

In this blog post we learned about how to manage, alter and template your configurations in ClusterControl. Changing the templates can save you a lot of time when you have deployed only one node in your topology. As the template will be used for new nodes, this will save you from altering all configurations afterwards. However for MySQL and MongoDB based nodes, changing the configuration on all nodes has become trivial due to the new Configuration Management interface.

As a reminder, we recently covered in the same series deployment of clustering/replication (MySQL / Galera, MySQL Replication, MongoDB & PostgreSQL), management & monitoring of your existing databases and clusters, performance monitoring and health, how to make your setup highly available through HAProxy and MaxScale and in the last post, how to prepare yourself for disasters by scheduling backups.

Updated: Become a ClusterControl DBA: Making your DB components HA via Load Balancers

$
0
0

Choosing your HA topology

There are various ways to retain high availability with databases. You can use Virtual IPs (VRRP) to manage host availability, you can use resource managers like Zookeeper and Etcd to (re)configure your applications or use load balancers/proxies to distribute the workload over all available hosts.

The Virtual IPs need either an application to manage them (MHA, Orchestrator), some scripting (Keepalived, Pacemaker/Corosync) or an engineer to manually fail over and the decision making in the process can become complex. The Virtual IP failover is a straightforward and simple process by removing the IP address from one host, assigning it to another and use arping to send a gratuitous ARP response. In theory a Virtual IP can be moved in a second but it will take a few seconds before the failover management application is sure the host has failed and acts accordingly. In reality this should be somewhere between 10 and 30 seconds. Another limitation of Virtual IPs is that some cloud providers do not allow you to manage your own Virtual IPs or assign them at all. E.g., Google does not allow you to do that on their compute nodes.

Resource managers like Zookeeper and Etcd can monitor your databases and (re)configure your applications once a host fails or a slave gets promoted to master. In general this is a good idea but implementing your checks with Zookeeper and Etcd is a complex task.

A load balancer or proxy will sit in between the application and the database host and work transparently as if the client would connect to the database host directly. Just like with the Virtual IP and resource managers, the load balancers and proxies also need to monitor the hosts and redirect the traffic if one host is down. ClusterControl supports two proxies: HAProxy and ProxySQL and both are supported for MySQL master-slave replication and Galera cluster. HAProxy and ProxySQL both have their own use cases, we will describe them in this post as well.

Why do you need a load balancer?

In theory you don’t need a load balancer but in practice you will prefer one. We’ll explain why.

If you have virtual IPs setup, all you have to do is point your application to the correct (virtual) IP address and everything should be fine connection wise. But suppose you have scaled out the number of read replicas, you might want to provide virtual IPs for each of those read replicas as well because of maintenance or availability reasons. This might become a very large pool of virtual IPs that you have to manage. If one of those read replicas had a failure, you need to re-assign the virtual IP to another host or else your application will connect to either a host that is down or in worst case, a lagging server with stale data. Keeping the replication state to the application managing the virtual IPs is therefore necessary.

Also for Galera there is a similar challenge: you can in theory add as many hosts as you’d like to your application config and pick one at random. The same problem arises when this host is down: you might end up connecting to an unavailable host. Also using all hosts for both reads and writes might also cause rollbacks due to the optimistic locking in Galera. If two connections try to write to the same row at the same time, one of them will receive a roll back. In case your workload has such concurrent updates, it is advised to only use one node in Galera to write to. Therefore you want a manager that keeps track of the internal state of your database cluster.

Both HAProxy and ProxySQL will offer you the functionality to monitor the MySQL/MariaDB database hosts and keep state of your cluster and its topology. For replication setups, in case a slave replica is down, both HAProxy and ProxySQL can redistribute the connections to another host. But if a replication master is down, HAProxy will deny the connection and ProxySQL will give back a proper error to the client. For Galera setups, both load balancers can elect a master node from the Galera cluster and only send the write operations to that specific node.

On the surface HAProxy and ProxySQL may seem to be similar solutions, but they differ a lot in features and the way they distribute connections and queries. HAProxy supports a number of balancing algorithms like least connections, source, random and round-robin while ProxySQL distributes connections using the weight-based round-robin algorithm (equal weight means equal distribution). Since ProxySQL is an intelligent proxy, it is database aware and is also able to analyze your queries. ProxySQL is able to do read/write splitting based on query rules where you can forward the queries to the designated slaves or master in your cluster. ProxySQL includes additional functionality like query rewriting, caching and query firewall with real-time, in-depth statistics generation about the workload.

That should be enough background information on this topic, so let’s see how you can deploy both load balancers for MySQL replication and Galera topologies.

Deploying HAProxy

Using ClusterControl to deploy HAProxy on a Galera cluster is easy: go to the relevant cluster and select “Add Load Balancer”:

And you will be able to deploy an HAProxy instance by adding the host address and selecting the server instances you wish to include in the configuration:

By default the HAProxy instance will be configured to send connections to the server instances receiving the least number of connections, but you can change that policy to either round robin or source.

Under advanced settings you can set timeouts, maximum amount of connections and even secure the proxy by whitelisting an IP range for the connections.

Under the nodes tab of that cluster, the HAProxy node will appear:

Now your Galera cluster is also available via the newly deployed HAProxy node on port 3307. Don’t forget to GRANT your application access from the HAProxy IP, as now the traffic will be incoming from the proxy instead of the application hosts. Also, remember to point your application connection to the HAProxy node.

Now suppose the one server instance would go down, HAProxy will notice this within a few seconds and stop sending traffic to this instance:

The two other nodes are still fine and will keep receiving traffic. This retains the cluster highly available without the client even noticing the difference.

Deploying a secondary HAProxy node

Now that we have moved the responsibility of retaining high availability over the database connections from the client to HAProxy, what if the proxy node dies? The answer is to create another HAProxy instance and use a virtual IP controlled by Keepalived as shown in this diagram:

The benefit compared to using virtual IPs on the database nodes is that the logic for MySQL is at the proxy level and the failover for the proxies is simple.

So let’s deploy a secondary HAProxy node:

After we have deployed a secondary HAProxy node, we need to add Keepalived:

And after Keepalived has been added, your nodes overview will look like this:

So now instead of pointing your application connections to the HAProxy node directly you have to point them to the virtual IP instead.

In the example here, we used separate hosts to run HAProxy on, but you could easily add them to existing server instances as well. HAProxy does not bring much overhead, although you should keep in mind that in case of a server failure, you will lose both the database node and the proxy.

Deploying ProxySQL

Deploying ProxySQL to your cluster is done in a similar way to HAProxy: "Add Load Balancer" in the cluster list under ProxySQL tab.

In the deployment wizard, specify where ProxySQL will be installed, the administration user/password, the monitoring user/password to connect to the MySQL backends. From ClusterControl, you can either create a new user to be used by the application (the user will be created on both MySQL and ProxySQL) or use the existing database users (the user will be created on ProxySQL only). Set whether are you are using implicit transactions or not. Basically, if you don’t use SET autocommit=0 to create new transaction, ClusterControl will configure read/write split.

After ProxySQL has been deployed, it will be available under the Nodes tab:

Opening the ProxySQL node overview will present you the ProxySQL monitoring and management interface, so there is no reason to log into ProxySQL on the node anymore. ClusterControl covers most of the ProxySQL important stats like memory utilization, query cache, query processor and so on, as well as other metrics like hostgroups, backend servers, query rule hits, top queries and ProxySQL variables. In the ProxySQL management aspect, you can manage the query rules, backend servers, users, configuration and scheduler right from the UI.

Check out our ProxySQL tutorial page which covers extensively on how to perform database Load Balancing for MySQL and MariaDB with ProxySQL.

Deploying Garbd

Galera implements a quorum-based algorithm to select a primary component through which it enforces consistency. The primary component needs to have a majority of votes (50% + 1 node), so in a 2 node system, there would be no majority resulting in split brain. Fortunately, it is possible to add a garbd (Galera Arbitrator Daemon), which is a lightweight stateless daemon that can act as the odd node. The added benefit by adding the Galera Arbitrator is that you can now do with only two nodes in your cluster.

If ClusterControl detects that your Galera cluster consists of an even number of nodes, you will be given the warning/advice by ClusterControl to extend the cluster to an odd number of nodes:

Choose wisely the host to deploy garbd on, as it will receive all replicated data. Make sure the network can handle the traffic and is secure enough. You could choose one of the HAProxy or ProxySQL hosts to deploy garbd on, like in the example below:

Take note that starting from ClusterControl 1.5.1, garbd cannot be installed on the same host as ClusterControl due to risk of package conflicts.

After installing garbd, you will see it appear next to your two Galera nodes:

Final thoughts

We showed you how to make your MySQL master-slave and Galera cluster setups more robust and retain high availability using HAProxy and ProxySQL. Also garbd is a nice daemon that can save the extra third node in your Galera cluster.

This finalizes the deployment side of ClusterControl. In our next blog, we will show you how to integrate ClusterControl within your organization by using groups and assigning certain roles to users.

The Best Alert and Notification Tools for PostgreSQL

$
0
0

As part of their enterprise monitoring system, organizations rely on alerts and notifications as their first line of defense to achieving high availability and consequently lowering outage costs.

Alerts and notifications are sometimes used interchangeably, for example we can say “I have received a high load system alert”, and replacing “alert” with “notification” will not change the message meaning. However, in the world of management systems it is important to note the difference: alerts are events generated as a result of a system trouble and notifications are used to deliver information about system status, including trouble. As an example the Severalnines blog Introducing the ClusterControl Alerting Integrations discusses one of the ClusterControl’s integration features, the notification system which is able to deliver alerts via email, chat services, and incident management systems. Also see PostgreSQL Wiki — Alerts and Status Notifications.

In order to accurately monitor the PostgreSQL database activity, a management system relies on the database activity metrics, custom features or monitor advisors, and monitoring log files.

In this article I review the tools listed in the PostgreSQL Wiki, the Monitoring and PostgreSQL GUI sections, skipping those that aren’t actively maintained, or do not provide alerting and notifications either within the product or with a free trial account. While not an exhaustive review, each tool was installed and configured up to the point where I could understand its alerting and notification capabilities.

Nagios

Nagios is a popular on-premise, general purpose monitoring system that offers an wide range of plugins. While Nagios Core is open source, the recommended solution for monitoring PostgreSQL is Nagios XI.

Notification settings are per user, and in order to change them the administrator must “login as” the user — Nagios uses the term masquerade as. Once on the account setting page, the user can choose to enable or disable the notification methods:

Nagios XI Notification Preferences

In order to configure the types of notifications, head to the “Notification Methods” page:

Nagios XI Notification Methods

See the Nagios XI User Guide for more details.

To configure alerts, log in as administrator and select the database configuration wizard:

Nagios XI Database Configuration Wizard

Once configured, the alerts can be viewed by selecting any of the default views, dashboards, or we can configure a custom one. Out of the box, Nagios XI provides the following PostgreSQL monitors:

Nagios XI PostgreSQL monitors

Note that out of the box Nagios XI doesn’t provide any metrics based on the PostgreSQL Statistics Collector, instead each metric must be defined using the “Postgres Query” configuration wizard:

Nagios XI Postgres Query

Datadog

Datadog is a general purpose SaaS monitoring tool featuring a very large set of integrations with a variety of services. To start monitoring, select the PostgreSQL integration, and then choose the notifications integrations such as email, chat (e.g. Slack), or incident response systems such as PagerDuty:

Datadog Integrations

In order to receive notifications via the integration channels configured earlier, we need to create at least one Datadog monitor, in the case of PostgreSQL monitoring an “integration” monitor type:

Datadog PostgreSQL Integration

The first step in configuring the monitor is selecting an alert type:

Datadog Detection Method

Next, configure one or more metrics:

Datador Metrics Configuration

Configure the conditions for triggering the alert:

Datadog Alert Trigger

Notifications can be customized using template variables:

Datadog Postgres Integration

Finally provide a list of recipients to receive notifications:

Datadog Notification Recipients

The events Datadog can monitor on are listed under the PostgreSQL integration “Metrics” section, and are based on the PostgreSQL Statistics Collector predefined views:

Datadog Postgres Integration Metrics

In order to monitor for events not provided with the default integration, Datadog provides customers with the option of creating custom metrics limited to the Datadog plan.

Okmeter

Okmeter is also part of the SaaS general purpose monitoring family, and just as other SaaS tools, requires an agent on the monitored host. Once the agent is installed, a set of default event triggers are enabled, including a PostgreSQL connection check:

Okmeter Autotriggers

Getting more PostgreSQL metrics requires adding a PostgreSQL “server”:

Okmeter - Adding a server

In order to monitor PostgreSQL statistics, similarly to Nagios and Datadog, we must configure custom metrics as explained in the Okmeter Documentation — Sending Custom metrics. Or, edit the “PostgreSQL server” metric above to include for views in the “okmeter.pg_stats” function.

The Okmeter query statistics documentation page explains how to enable tracking of execution statistics for the SQL statements. Note that there are a few limitations in using the “pg_stat_statements” views e.g. maximum number of distinct statements that can be recorded by a module — see the PostgreSQL documentation on pg_stat_statements for details.

The notification contacts page is where notifications are configured for each user:

Okmeter Contact Notification

Notification messages can be further customized using templates:

Okmeter Notification Message Template

Circonus

Circonus, another SaaS general monitoring product, features a PostgreSQL “check” which can be enabled individually or added as part of the one-step install:

Circonus Check setup

According to Circonus PostgreSQL documentation the check is performed from a remote location via direct SQL statements. After configuring the PostgreSQL host to accept connections from a Circonus broker, the wizard will present a list of available metrics:

Circonus PostgreSQL check

In order to configure alerts, each metric is associated with a set of rules and a list of contacts to be notified.

Circonus Metric Details

Alerts are categorized based on severity levels:

Circonus Rulesets Severity Levels

Notification channels include SMS, OpsGenie, Slack, VictorOps, and PagerDuty (no email). The screenshot below shows a Slack integration:

Circonus Contact Groups

In order to configure notifications, each metric in the check must be assigned rules and contacts. Note that contacts must be created prior to editing the metric:

Circonus Rulesets
Circonus Rulesets

New Relic

New Relic is another SaaS general monitoring system. When it comes to PostgreSQL there are (as of this writing) three available plugins. The most recent one is the Blue Medora plugin:

New Relic PostgreSQL plugin from Blue Medora

Once the plugin is working it becomes visible on the plugins page and we are ready to configure alerts:

New Relic Alerts Setup

New Relic uses the concept of alert policies to group alerts into incidents. Before configuring a policy we must setup the notifications channels. Out of the box, New Relic integrates with all popular incident response systems, as well as email:

New Relic Channel Types

Note that the integration must be first enabled in the notification application. For example selecting Slack from the list of channel types:

New Relic Slack Integration

Next create an “alert policy”:

New Relic Alert Policy

An alert policy requires an “alert condition”. The next set of screenshots show the steps to achieve just that:

New Relic PostgreSQL Condition Category
New Relic PostgreSQL Condition Entity
New Relic PostgreSQL Condition Threshold

Finally select the notification channels tab in order to modify the default:

New Relic PostgreSQL Notification Channels

Optionally, add the alert condition to New Relic Insights (requires additional subscription):

New Relic Insights
New Relic Insights

Postgres Enterprise Manager

PEM or Postgres Enterprise Manager is a tool for managing, tuning, and monitoring PostgreSQL.

It comes with a very rich set of predefined metrics:

Postgres Enterprise Manager Predefined Metrics

In order to modify the default alerts, or create custom ones, use the alert templates:

Postgres Enterprise Manager Custom Alert Template

PEM relies on email and SNMP for notifications, so it can easily integrate with monitoring systems such as Nagios, but there aren’t any integrations with the popular incident management systems (PagerDuty, VictorOps, OpsGenie), or chat services (Slack) found in the other products.

Postgres Enterprise Manager Email & SNMP alerting

pgwatch2

pgwatch2 is another PostgreSQL centric monitoring tool, self-hosted solution.

In order to define alerts, we must first create a custom dashboard and define the metric:

pgwatch2 Dashboard Metrics

Next, configure the alert:

pgwatch2 Dashboard Alert Config

Once configured, the alerts will show up on the Alerts List page:

pgwatch2 Dashboard Alert List

pgwatch2 integrates with all popular notification systems. Here’s an example of adding a Slack channel:

pgwatch2 Slack Integration

To view the notification channels configured in the system, open up the “Notification channels” page:

pgwatch2 Notification Channels

Additional metrics can be added as documented in the pgwatch2 Features section.

ClusterControl

ClusterControl is an on premise database oriented management system with support for PostgreSQL, MySQL, MariaDB, and MongoDB.

First step is adding a notification integration. More information about available integrations is available at Introducing the ClusterControl Alerting Integrations:

ClusterControl Integrations

For the purpose of this demo, I’ve configured Slack:

ClusterControl Slack Integration

ClusterControl also offers the option of notifying via email:

ClusterControl Notifications via Email

Once notifications are in place, create custom advisors in order to trigger alerts based on specific criteria:

ClusterControl Custom Advisors
ClusterControl
Single Console for Your Entire Database Infrastructure
Find out what else is new in ClusterControl

Conclusion

The article wasn’t intended to be a deep dive into the functionality of each tool, rather I attempted to outline what I considered to be the important features related to alerting and notifications for PostgreSQL, specifically.

One of the lessons learned is that the selection process should take several factors in consideration:

  • on premise or SaaS
  • agent-based or remote check
  • integration with incident management systems and chat services
  • availability of monitored metrics, out of the box, and plugins
  • ability to add custom metrics
  • alert management features (e.g. grouping)
  • complexity vs granularity in the user interface
  • additional functionality (management, tuning, API, etc.)

Also, if one solution doesn’t meet all the business and/or technical requirements, it is always possible to use a combination of services.


Comparing Database Proxy Failover Times - ProxySQL, MaxScale and HAProxy

$
0
0

ClusterControl can be used to deploy highly available replication setups. It supports switchover and failover for GTID-based MySQL or MariaDB replication setups. ClusterControl can deploy different types of proxies for traffic routing: ProxySQL, HAProxy and MaxScale. These are integrated to handle topology changes related to failovers or switchovers. In this blog post, we’ll take a look at how this works and what you can expect from each of the proxies.

First, let’s go through some definitions and terminology. ClusterControl can be configured to perform a recovery of a failed replication master - it can promote a slave to become the new master, make any required topology changes and restore entire setup’s ability to accept writes. This is what we will call a “failover”. ClusterControl can also perform a master switch - sometimes it’s required to change a master. Typical scenario would be a heavy schema change, which has to be executed in a rolling fashion. Towards the end of the procedure, you’ll have to promote one of the slaves, which already has the change applied, before performing the change on the old master.

The main difference between “failover” and “switchover” is that failover, by definition, is an emergency situation where the master is already unavailable. On the other hand, switchover is a more controllable process over which ClusterControl has full control. If we are talking about failover, there is no way to handle it gracefully as application already lost connections due to master crash. As such, no matter which proxy you will use, application will always have to reconnect.

So, applications need to be able to handle transaction failures and retry them. The other important thing when speaking about failover is the proxy’s ability to check the health of the database servers. Without health checks, the proxy cannot know the status of the server, and therefore cannot decide to failover traffic. ClusterControl automatically configures these healthchecks when deploying the proxy.

Failover

ProxySQL

Let’s take a look at how the failover may look like from the application point of view. We will first connect to the database using ProxySQL version 1.4.6.

root@vagrant:~# while true  ;do time sysbench /root/sysbench/src/lua/oltp_read_write.lua --threads=4 --max-requests=0 --time=3600 --mysql-host=10.0.0.105 --mysql-user=sbtest --mysql-password=pass --mysql-port=6033 --tables=32 --report-interval=1 --skip-trx=on --table-size=10000 --db-ps-mode=disable run ; done
sysbench 1.1.0-651e7fd (using bundled LuaJIT 2.1.0-beta3)

Running the test with following options:
Number of threads: 4
Report intermediate results every 1 second(s)
Initializing random number generator from current time


Initializing worker threads...

Threads started!

[ 1s ] thds: 4 tps: 29.51 qps: 585.28 (r/w/o: 465.27/120.01/0.00) lat (ms,95%): 196.89 err/s: 0.00 reconn/s: 0.00
[ 2s ] thds: 4 tps: 44.61 qps: 784.77 (r/w/o: 603.28/181.49/0.00) lat (ms,95%): 116.80 err/s: 0.00 reconn/s: 0.00
[ 3s ] thds: 4 tps: 46.98 qps: 829.66 (r/w/o: 646.74/182.93/0.00) lat (ms,95%): 121.08 err/s: 0.00 reconn/s: 0.00
[ 4s ] thds: 4 tps: 49.04 qps: 886.64 (r/w/o: 690.50/195.14/1.00) lat (ms,95%): 112.67 err/s: 0.00 reconn/s: 0.00
[ 5s ] thds: 4 tps: 47.98 qps: 887.64 (r/w/o: 689.72/197.92/0.00) lat (ms,95%): 106.75 err/s: 0.00 reconn/s: 0.00
FATAL: mysql_drv_query() returned error 2013 (Lost connection to MySQL server during query) for query 'UPDATE sbtest8 SET k=k+1 WHERE id=5019'
FATAL: `thread_run' function failed: /usr/local/share/sysbench/oltp_common.lua:461: SQL error, errno = 2013, state = 'HY000': Lost connection to MySQL server during query
FATAL: mysql_drv_query() returned error 2013 (Lost connection to MySQL server during query) for query 'DELETE FROM sbtest6 WHERE id=4957'
FATAL: `thread_run' function failed: /usr/local/share/sysbench/oltp_common.lua:490: SQL error, errno = 2013, state = 'HY000': Lost connection to MySQL server during query
FATAL: mysql_drv_query() returned error 2013 (Lost connection to MySQL server during query) for query 'SELECT SUM(k) FROM sbtest23 WHERE id BETWEEN 4986 AND 5085'
FATAL: `thread_run' function failed: /usr/local/share/sysbench/oltp_common.lua:435: SQL error, errno = 2013, state = 'HY000': Lost connection to MySQL server during query
FATAL: mysql_drv_query() returned error 2013 (Lost connection to MySQL server during query) for query 'DELETE FROM sbtest21 WHERE id=5218'
FATAL: `thread_run' function failed: /usr/local/share/sysbench/oltp_common.lua:490: SQL error, errno = 2013, state = 'HY000': Lost connection to MySQL server during query

real    0m5.903s
user    0m0.092s
sys    0m1.252s
sysbench 1.1.0-651e7fd (using bundled LuaJIT 2.1.0-beta3)

Running the test with following options:
Number of threads: 4
Report intermediate results every 1 second(s)
Initializing random number generator from current time


Initializing worker threads...

FATAL: unable to connect to MySQL server on host '10.0.0.105', port 6033, aborting...
FATAL: error 2003: Can't connect to MySQL server on '10.0.0.105' (111)
FATAL: `thread_init' function failed: /usr/local/share/sysbench/oltp_common.lua:352: connection creation failed
FATAL: unable to connect to MySQL server on host '10.0.0.105', port 6033, aborting...
FATAL: error 2003: Can't connect to MySQL server on '10.0.0.105' (111)
FATAL: `thread_init' function failed: /usr/local/share/sysbench/oltp_common.lua:352: connection creation failed
FATAL: unable to connect to MySQL server on host '10.0.0.105', port 6033, aborting...
FATAL: error 2003: Can't connect to MySQL server on '10.0.0.105' (111)
FATAL: `thread_init' function failed: /usr/local/share/sysbench/oltp_common.lua:352: connection creation failed
FATAL: unable to connect to MySQL server on host '10.0.0.105', port 6033, aborting...
FATAL: error 2003: Can't connect to MySQL server on '10.0.0.105' (111)
FATAL: `thread_init' function failed: /usr/local/share/sysbench/oltp_common.lua:352: connection creation failed
FATAL: Threads initialization failed!

real    0m0.021s
user    0m0.012s
sys    0m0.000s
sysbench 1.1.0-651e7fd (using bundled LuaJIT 2.1.0-beta3)

Running the test with following options:
Number of threads: 4
Report intermediate results every 1 second(s)
Initializing random number generator from current time


Initializing worker threads...

Threads started!

[ 1s ] thds: 4 tps: 0.00 qps: 55.81 (r/w/o: 55.81/0.00/0.00) lat (ms,95%): 0.00 err/s: 0.00 reconn/s: 0.00
[ 2s ] thds: 4 tps: 0.00 qps: 0.00 (r/w/o: 0.00/0.00/0.00) lat (ms,95%): 0.00 err/s: 0.00 reconn/s: 0.00
[ 3s ] thds: 4 tps: 0.00 qps: 0.00 (r/w/o: 0.00/0.00/0.00) lat (ms,95%): 0.00 err/s: 0.00 reconn/s: 0.00
[ 4s ] thds: 4 tps: 0.00 qps: 0.00 (r/w/o: 0.00/0.00/0.00) lat (ms,95%): 0.00 err/s: 0.00 reconn/s: 0.00
[ 5s ] thds: 4 tps: 0.00 qps: 0.00 (r/w/o: 0.00/0.00/0.00) lat (ms,95%): 0.00 err/s: 0.00 reconn/s: 0.00
[ 6s ] thds: 4 tps: 0.00 qps: 0.00 (r/w/o: 0.00/0.00/0.00) lat (ms,95%): 0.00 err/s: 0.00 reconn/s: 0.00
[ 7s ] thds: 4 tps: 0.00 qps: 0.00 (r/w/o: 0.00/0.00/0.00) lat (ms,95%): 0.00 err/s: 0.00 reconn/s: 0.00
[ 8s ] thds: 4 tps: 0.00 qps: 0.00 (r/w/o: 0.00/0.00/0.00) lat (ms,95%): 0.00 err/s: 0.00 reconn/s: 0.00
[ 9s ] thds: 4 tps: 0.00 qps: 0.00 (r/w/o: 0.00/0.00/0.00) lat (ms,95%): 0.00 err/s: 0.00 reconn/s: 0.00
[ 10s ] thds: 4 tps: 0.00 qps: 3.00 (r/w/o: 0.00/3.00/0.00) lat (ms,95%): 0.00 err/s: 0.00 reconn/s: 0.00
[ 11s ] thds: 4 tps: 58.99 qps: 1026.91 (r/w/o: 792.93/233.98/0.00) lat (ms,95%): 9977.52 err/s: 0.00 reconn/s: 0.00

As we can see from the above, the new master became available within ~11 seconds of the crash. During this time, ClusterControl promoted one of the slaves to become a new master and it became available for writes.

HAProxy

Below is an excerpt from the output of our sysbench application, when failover happened while we connected via HAProxy. HAProxy was deployed with version 1.5.14.

root@vagrant:~# while true  ;do date ; time sysbench /root/sysbench/src/lua/oltp_read_write.lua --threads=4 --max-requests=0 --time=3600 --mysql-host=10.0.0.105 --mysql-user=sbtest --mysql-password=pass --mysql-port=3307 --tables=32 --report-interval=1 --skip-trx=on --table-size=10000 --db-ps-mode=disable run ; done
Mon Mar 26 13:24:36 UTC 2018
sysbench 1.1.0-651e7fd (using bundled LuaJIT 2.1.0-beta3)

Running the test with following options:
Number of threads: 4
Report intermediate results every 1 second(s)
Initializing random number generator from current time


Initializing worker threads...

Threads started!

[ 1s ] thds: 4 tps: 38.62 qps: 748.66 (r/w/o: 591.21/157.46/0.00) lat (ms,95%): 204.11 err/s: 0.00 reconn/s: 0.00
[ 2s ] thds: 4 tps: 45.25 qps: 797.34 (r/w/o: 619.37/177.97/0.00) lat (ms,95%): 142.39 err/s: 0.00 reconn/s: 0.00
[ 3s ] thds: 4 tps: 46.04 qps: 833.66 (r/w/o: 647.51/186.15/0.00) lat (ms,95%): 155.80 err/s: 0.00 reconn/s: 0.00
[ 4s ] thds: 4 tps: 38.03 qps: 698.50 (r/w/o: 548.39/150.11/0.00) lat (ms,95%): 161.51 err/s: 0.00 reconn/s: 0.00
FATAL: mysql_drv_query() returned error 2013 (Lost connection to MySQL server during query) for query 'INSERT INTO sbtest26 (id, k, c, pad) VALUES (5019, 4641, '59053342586-08172779908-92479743240-43242105725-10632773383-95161136797-93281862044-04686210438-11173993922-29424780352', '31974441818-04649488782-29232641118-20479872868-43849012112')'
FATAL: `thread_run' function failed: /usr/local/share/sysbench/oltp_common.lua:491: SQL error, errno = 2013, state = 'HY000': Lost connection to MySQL server during query
FATAL: mysql_drv_query() returned error 2013 (Lost connection to MySQL server during query) for query 'INSERT INTO sbtest5 (id, k, c, pad) VALUES (4990, 5016, '24532768797-67997552950-32933774735-28931955363-94029987812-56997738696-36504817596-46223378508-29593036153-06914757723', '96663311222-58437606902-85941187037-63300736065-65139798452')'
FATAL: `thread_run' function failed: /usr/local/share/sysbench/oltp_common.lua:491: SQL error, errno = 2013, state = 'HY000': Lost connection to MySQL server during query
FATAL: mysql_drv_query() returned error 2013 (Lost connection to MySQL server during query) for query 'DELETE FROM sbtest25 WHERE id=4996'
FATAL: `thread_run' function failed: /usr/local/share/sysbench/oltp_common.lua:490: SQL error, errno = 2013, state = 'HY000': Lost connection to MySQL server during query
FATAL: mysql_drv_query() returned error 2013 (Lost connection to MySQL server during query) for query 'UPDATE sbtest16 SET k=k+1 WHERE id=5269'
FATAL: `thread_run' function failed: /usr/local/share/sysbench/oltp_common.lua:461: SQL error, errno = 2013, state = 'HY000': Lost connection to MySQL server during query

real    0m4.270s
user    0m0.068s
sys    0m0.928s

...

Mon Mar 26 13:24:47 UTC 2018
sysbench 1.1.0-651e7fd (using bundled LuaJIT 2.1.0-beta3)

Running the test with following options:
Number of threads: 4
Report intermediate results every 1 second(s)
Initializing random number generator from current time


Initializing worker threads...

FATAL: unable to connect to MySQL server on host '10.0.0.105', port 3307, aborting...
FATAL: error 2013: Lost connection to MySQL server at 'reading initial communication packet', system error: 0
FATAL: `thread_init' function failed: /usr/local/share/sysbench/oltp_common.lua:352: connection creation failed
FATAL: unable to connect to MySQL server on host '10.0.0.105', port 3307, aborting...
FATAL: error 2013: Lost connection to MySQL server at 'reading initial communication packet', system error: 2
FATAL: `thread_init' function failed: /usr/local/share/sysbench/oltp_common.lua:352: connection creation failed
FATAL: Threads initialization failed!

real    0m0.036s
user    0m0.004s
sys    0m0.008s

...

Mon Mar 26 13:25:03 UTC 2018
sysbench 1.1.0-651e7fd (using bundled LuaJIT 2.1.0-beta3)

Running the test with following options:
Number of threads: 4
Report intermediate results every 1 second(s)
Initializing random number generator from current time


Initializing worker threads...

Threads started!

[ 1s ] thds: 4 tps: 50.58 qps: 917.42 (r/w/o: 715.10/202.33/0.00) lat (ms,95%): 153.02 err/s: 0.00 reconn/s: 0.00
[ 2s ] thds: 4 tps: 50.17 qps: 956.33 (r/w/o: 749.61/205.72/1.00) lat (ms,95%): 121.08 err/s: 0.00 reconn/s: 0.00

In total, the process took 12 seconds.

MaxScale

Let’s take a look at how MaxScale handles failover. We use MaxScale with version 2.1.9.

root@vagrant:~# while true ; do date ; time sysbench /root/sysbench/src/lua/oltp_read_write.lua --threads=4 --max-requests=0 --time=3600 --mysql-host=10.0.0.106 --mysql-user=myuser --mysql-password=pass --mysql-port=4008 --tables=32 --report-interval=1 --skip-trx=on --table-size=100000 --db-ps-mode=disable run ; done
Mon Mar 26 15:16:34 UTC 2018
sysbench 1.1.0-651e7fd (using bundled LuaJIT 2.1.0-beta3)

Running the test with following options:
Number of threads: 4
Report intermediate results every 1 second(s)
Initializing random number generator from current time


Initializing worker threads...

Threads started!

[ 1s ] thds: 4 tps: 34.82 qps: 658.54 (r/w/o: 519.27/125.34/13.93) lat (ms,95%): 137.35 err/s: 0.00 reconn/s: 0.00
[ 2s ] thds: 4 tps: 35.01 qps: 655.23 (r/w/o: 513.18/142.05/0.00) lat (ms,95%): 207.82 err/s: 0.00 reconn/s: 0.00
[ 3s ] thds: 4 tps: 39.01 qps: 696.16 (r/w/o: 542.13/154.04/0.00) lat (ms,95%): 139.85 err/s: 0.00 reconn/s: 0.00
[ 4s ] thds: 4 tps: 40.91 qps: 724.41 (r/w/o: 557.77/166.63/0.00) lat (ms,95%): 125.52 err/s: 0.00 reconn/s: 0.00
FATAL: mysql_drv_query() returned error 1053 (Server shutdown in progress) for query 'UPDATE sbtest28 SET k=k+1 WHERE id=49992'
FATAL: `thread_run' function failed: /usr/local/share/sysbench/oltp_common.lua:461: SQL error, errno = 1053, state = '08S01': Server shutdown in progress
FATAL: mysql_drv_query() returned error 1053 (Server shutdown in progress) for query 'UPDATE sbtest14 SET k=k+1 WHERE id=59650'
FATAL: `thread_run' function failed: /usr/local/share/sysbench/oltp_common.lua:461: SQL error, errno = 1053, state = '08S01': Server shutdown in progress
FATAL: mysql_drv_query() returned error 1053 (Server shutdown in progress) for query 'UPDATE sbtest12 SET k=k+1 WHERE id=50288'
FATAL: `thread_run' function failed: /usr/local/share/sysbench/oltp_common.lua:461: SQL error, errno = 1053, state = '08S01': Server shutdown in progress
FATAL: mysql_drv_query() returned error 1053 (Server shutdown in progress) for query 'UPDATE sbtest25 SET k=k+1 WHERE id=50105'
FATAL: `thread_run' function failed: /usr/local/share/sysbench/oltp_common.lua:461: SQL error, errno = 1053, state = '08S01': Server shutdown in progress

real    0m5.043s
user    0m0.080s
sys    0m1.044s


Mon Mar 26 15:16:53 UTC 2018
sysbench 1.1.0-651e7fd (using bundled LuaJIT 2.1.0-beta3)

Running the test with following options:
Number of threads: 4
Report intermediate results every 1 second(s)
Initializing random number generator from current time


Initializing worker threads...

Threads started!

[ 1s ] thds: 4 tps: 46.82 qps: 905.61 (r/w/o: 710.34/195.27/0.00) lat (ms,95%): 101.13 err/s: 0.00 reconn/s: 0.00

Failover summary

It is important to clarify that this is not a scientific benchmark - most of the time is used by ClusterControl to perform the failover. Proxies typically need a couple of seconds at most to detect the topology change. We used sysbench as our application. It was configured to run auto-committed transactions, so neither explicit transactions nor prepared statements have been used. Sysbench’s read/write workload is pretty fast. If you have long-running transactions or queries, the failover performance will differ. You can see our scenario as a best case.

ClusterControl
Single Console for Your Entire Database Infrastructure
Find out what else is new in ClusterControl

Switchover

As we mentioned earlier, when executing a switchover ClusterControl has more control of the master. Under some circumstances (like no transactions, no long running writes, etc.), it may be able to perform a graceful master switch, as long as the proxy supports this. Unfortunately, as of now, none of the proxies deployable by ClusterControl can handle graceful switchover. In the past, ProxySQL had this capability therefore we decided to investigate closer and got in touch with ProxySQL creator, René Cannaò. During the investigation we identified a regression which should be fixed in the next release of ProxySQL. In the meantime, to showcase how ProxySQL should behave, we used ProxySQL patched with a small workaround which we compiled from source.

[ 16s ] thds: 4 tps: 39.01 qps: 711.11 (r/w/o: 555.09/156.02/0.00) lat (ms,95%): 173.58 err/s: 0.00 reconn/s: 0.00
[ 17s ] thds: 4 tps: 49.00 qps: 879.06 (r/w/o: 678.05/201.01/0.00) lat (ms,95%): 102.97 err/s: 0.00 reconn/s: 0.00
[ 18s ] thds: 4 tps: 42.86 qps: 768.57 (r/w/o: 603.09/165.48/0.00) lat (ms,95%): 176.73 err/s: 0.00 reconn/s: 0.00
[ 19s ] thds: 4 tps: 28.07 qps: 521.26 (r/w/o: 406.98/114.28/0.00) lat (ms,95%): 235.74 err/s: 0.00 reconn/s: 0.00
[ 20s ] thds: 4 tps: 0.00 qps: 0.00 (r/w/o: 0.00/0.00/0.00) lat (ms,95%): 0.00 err/s: 0.00 reconn/s: 0.00
[ 21s ] thds: 4 tps: 0.00 qps: 0.00 (r/w/o: 0.00/0.00/0.00) lat (ms,95%): 0.00 err/s: 0.00 reconn/s: 0.00
[ 22s ] thds: 4 tps: 0.00 qps: 0.00 (r/w/o: 0.00/0.00/0.00) lat (ms,95%): 0.00 err/s: 0.00 reconn/s: 0.00
[ 23s ] thds: 4 tps: 13.98 qps: 249.59 (r/w/o: 193.68/55.91/0.00) lat (ms,95%): 4055.23 err/s: 0.00 reconn/s: 0.00
[ 24s ] thds: 4 tps: 81.06 qps: 1449.01 (r/w/o: 1123.79/325.23/0.00) lat (ms,95%): 62.19 err/s: 0.00 reconn/s: 0.00
[ 25s ] thds: 4 tps: 52.02 qps: 923.42 (r/w/o: 715.32/208.09/0.00) lat (ms,95%): 390.30 err/s: 0.00 reconn/s: 0.00
[ 26s ] thds: 4 tps: 59.00 qps: 1082.94 (r/w/o: 844.96/237.99/0.00) lat (ms,95%): 164.45 err/s: 0.00 reconn/s: 0.00
[ 27s ] thds: 4 tps: 50.99 qps: 900.75 (r/w/o: 700.81/199.95/0.00) lat (ms,95%): 130.13 err/s: 0.00 reconn/s: 0.00

As you can see, no queries are executed for 4 seconds but no error is returned to the application and after this pause, the traffic starts to flow once more.

To summarize, we have shown that ClusterControl, when used with ProxySQL or MaxScale or HAProxy, can perform a failover with a downtime of 10 - 15 seconds. With respect to a planned master switch, none of the proxies can handle the procedure without errors at the time of writing. However, it is expected that the next ProxySQL version will allow a switchover of a few seconds without any error showing up in the application.

Database Automation Behind Sweden’s New Electronic Identity Freja eID

$
0
0

Severalnines is excited to announce its newest customer Verisec AB, an international IT security company on the cutting edge of digital security, creating solutions that make systems secure and easily accessible for industries like banking, government and businesses worldwide.

Verisec is the creator of the Freja eID platform, a scalable and secure authentication and identity management platform. It provides electronic identities on mobile phones, that allows users to log in, sign and approve transactions and agreements with fingerprints or PIN. It also lets users monitor and control their digital activities, which helps avoid ID theft and fraud. The eID is officially approved by the Swedish E-identification board with the quality mark “Svensk e-legitimation”.

In the case study, you can learn how the sensitive nature of an identity service raises the bar on the underlying data management - from regulatory compliance, security, and tight SLAs with resolution of service interruptions or performance problems within narrow time windows. In addition, the case study will show how Verisec’s entire lifecycle could be automated via ClusterControl.

Read the case study to learn more.

ClusterControl
Single Console for Your Entire Database Infrastructure
Find out what else is new in ClusterControl

About ClusterControl

ClusterControl is the all-inclusive open source database management system for users with mixed environments that removes the need for multiple management tools. ClusterControl provides advanced deployment, management, monitoring, and scaling functionality to get your MySQL, MongoDB, and PostgreSQL databases up-and-running using proven methodologies that you can depend on to work. At the core of ClusterControl is it’s automation functionality that let’s you automate many of the database tasks you have to perform regularly, like deploying new databases, detecting anomalies, recovering nodes from failures, adding and scaling new nodes, running backups and upgrades, and more.

About Severalnines

Severalnines provides automation and management software for database clusters. We help companies deploy their databases in any environment, and manage all operational aspects to achieve high-scale availability.

Severalnines' products are used by developers and administrators of all skills levels to provide the full 'deploy, manage, monitor, scale' database cycle, thus freeing them from the complexity and learning curves that are typically associated with highly available database clusters. Severalnines is often called the “anti-startup” as it is entirely self-funded by its founders. The company has enabled over 12,000 deployments to date via its popular product ClusterControl. Currently counting BT, Orange, Cisco, CNRS, Technicolor, AVG, Ping Identity and Paytrail as customers. Severalnines is a private company headquartered in Stockholm, Sweden with offices in Singapore, Japan and the United States.

Announcing ClusterControl 1.6 - automation and management of open source databases in the cloud

$
0
0

Today we are excited to announce the 1.6 release of ClusterControl - the all-inclusive database management system that lets you easily deploy, monitor, manage and scale highly available open source databases - and load balancers - in any environment: on-premise or in the cloud.

ClusterControl 1.6 introduces a new set of cloud features in BETA status that allow users to deploy and manage their open source database clusters on public clouds such AWS, Google Cloud and Azure. The release also provides a Point In Time Recovery functionality for MySQL/MariaDB systems, as well as new topology views for PostgreSQL Replication clusters, MongoDB ReplicaSets and Sharded clusters.

Release Highlights

Deploy and manage clusters on public Clouds (BETA)

  • Supported cloud providers: Amazon Web Services (VPC), Google Cloud, and Azure
  • Supported databases: MySQL/MariaDB Galera, Percona XtraDB Cluster, PostgreSQL, MongoDB ReplicaSet

Point In Time Recovery - PITR (MySQL)

  • Position and time-based recovery for MySQL based clusters

Enhanced Topology View

  • Support added for PostgreSQL Replication clusters; MongoDB ReplicaSets and Sharded clusters

Additional Highlights

  • Deploy multiple clusters in parallel and increase deployment speed
  • Enhanced Database User Management for MySQL/MariaDB based systems
  • Support for MongoDB 3.6
ClusterControl
Single Console for Your Entire Database Infrastructure
Find out what else is new in ClusterControl

View Release Details and Resources

Release Details

Deploy and manage open source database clusters on public Clouds (BETA)

With this latest release, we continue to add deeper cloud functionality to ClusterControl. Users can now launch cloud instances and deploy database clusters on AWS, Google Cloud and Azure right from their ClusterControl console; and they can now also upload/download backups to Azure cloud storage. Supported cloud providers currently include Amazon Web Services (VPC), Google Cloud, and Azure as well as the following databases: MySQL/MariaDB Galera, PostgreSQL, MongoDB ReplicaSet.

Point In Time Recovery - PITR (MySQL)

Point-in-Time recovery of MySQL & MariaDB involves restoring the database from backups prior to the target time, then uses incremental backups and binary logs to roll the database forward to the target time. Typically, database administrators use backups to recover from different types of cases such as a database upgrade that fails and corrupts the data or storage media failure/corruption. But what happens when an incident occurs at a time in between two backups? This is where binary logs come in: as they store all of the changes, users can also use them to replay traffic. ClusterControl automates that process for you and helps you minimize data loss after an outage.

New Topology View

The ClusterControl Topology View provides a visual representation of your database nodes and load balancers in real time, in a simple and friendly interface without the need to install any additional tools. Distributed databases or clusters typically consist of multiple nodes and node types, and it can be a challenge to understand how these work together. If you also have load balancers in the mix, hosts with multiple IP addresses and more, then the setup can quickly become too complex to visualise. That’s where the new ClusterControl Topology View comes in: it shows all the different nodes that form part of your database cluster (whether database nodes, load balancers or arbitrators), as well as the connections between them in an easy to view visual. With this release, we have added support for PostgreSQL Replication clusters as well as MongoDB ReplicaSets and Sharded clusters.

Enhanced Database User Management for MySQL based clusters

One important aspect of being a database administrator is to protect access to the company’s data. We have redesigned our DB User Management for MySQL based clusters with a more modern user interface, which makes it easier to view and manage the database accounts and privileges directly from ClusterControl.

Additional New Functionalities

  • Improved cluster deployment speed by utilizing parallel jobs. Deploy multiple clusters in parallel.
  • Support to deploy and manage MongoDB cluster on v3.6

Download ClusterControl today!

Happy Clustering!

How to Go Into Production With MongoDB - Top Ten Tips

$
0
0

After the successful development of the application and prior to dedicating yourself to the production of MongoDB, reckon with these quick guidelines in order to ensure a smooth and efficient flow as well as to achieve optimal performance.

1) Deployment Options

Selection of Right Hardware

For optimal performance, it’s preferable to use SSD rather than the HDD. It is necessary to take care whether your storage is local or remote and take measures accordingly. It’s better to use RAID for protection of hardware defects and recovery scheme, but don’t rely completely on it, as it doesn’t offer any protection against adverse failures. For execution on disks, RAID-10 is a good fit in terms of performance and availability which lacks often in other RAID levels. The right hardware is the building block for your application for optimized performance and to avoid any major debacle.

Cloud Hosting

A range of cloud vendors is available which offer pre-installed MongoDB database hosts. The selection of best choice is the founding step for your application to grow and make first impressions on the target market. MongoDB Atlas is one of the possible choices which offers a complete solution for cloud interface with features like deployment of your nodes and a snapshot of your data stored in Amazon S3. ClusterControl is another good available option for easy deployment and scaling. Which offers a variety of features like easy addition and removal of nodes, resize instances, and cloning of your production cluster. You can try ClusterControl here without being charged. Other available options are RackSpace ObjectRocket and MongoStitch.

2) RAM

Frequently accessed items are cached in RAM, so that MongoDB can provide optimal response time. RAM usually depends on the amount of data you are going to store, the number of collections, and indexes. Make sure you have enough RAM to accommodate your indexes otherwise it will drastically affect your application performance on production. More RAM means less page fault and better response time.

3) Indexing

For applications which include chronic write requests, indexing plays an imperative role. According to MongoDB docs:

“If a write operation modifies an indexed field, MongoDB updates all indexes that have the modified field as a key”

So, be careful while choosing indexes as it may affect your DB performance.

Indexing Example: Sample entry in the restaurant database

{
  "address": {
     "building": "701",
     "street": "Harley street",
     "zipcode": "71000"
  },
  "cuisine": "Bakery",
  "grades": [
     { "date": { "$date": 1393804800000 }, "grade": "A", "score": 2 },
     { "date": { "$date": 1378857600000 }, "grade": "A", "score": 6 },
     { "date": { "$date": 1358985600000 }, "grade": "A", "score": 10 },
     { "date": { "$date": 1322006400000 }, "grade": "A", "score": 9 },
     { "date": { "$date": 1299715200000 }, "grade": "B", "score": 14 }
  ],
  "name": "Bombay Bakery",
  "restaurant_id": "187521"
}
  1. Creating Index on Single Field

    > db.restaurants.createIndex( { "cuisine": 1 } );
    {
         "createdCollectionAutomatically" : false,
         "numIndexesBefore" : 1,
         "numIndexesAfter" : 2,
         "ok" : 1
    }

    In above example ascending order index is created on cuisine field.

  2. Creating Index on Multiple Fields

    > db.restaurants.createIndex( { "cuisine": 1 , "address.zipcode": -1 } );
    {
            "createdCollectionAutomatically" : false,
            "numIndexesBefore" : 2,
            "numIndexesAfter" : 3,
            "ok" : 1
    }

    Here compound index is created on cuisine and zip code fields. The -ve number defines descending order.

4) Be Prepared for Sharding

MongoDB partitions the data into different machines using a mechanism known as sharding. It is not advised to add sharding in the beginning unless you are expecting hefty datasets. Do remember to keep your application performance in line you need a good sharding key, according to your data patterns as it directly affects your response time. Balancing of data across shards is automatic. However, it’s better to be prepared and have a proper plan. So you can consolidate whenever your application demands.

5) Best practices for OS Configuration

  • XFS File System
    • It’s highly scalable, high performance 64-bit journaling file system. Revamps I/O performance by permitting fewer and larger I/O operations.
  • Put file descriptor limit.
  • Disable transparent huge pages and Nonuniform Access Memory (NUMA).
  • Change the default TCP keepalive time to 300 seconds (for Linux) and 120 seconds (for Azure).

Try these commands for changing default keepalive time;

For Linux

sudo sysctl -w net.ipv4.tcp_keepalive_time=<value>

For Windows

Type this command in Command Prompt as an Administrator, where <value> is expressed in hexadecimal (e.g. 120000 is 0x1d4c0):

reg add HKLM\SYSTEM\CurrentControlSet\Services\Tcpip\Parameters\ /t REG_DWORD /v KeepAliveTime /d <value>

6) Ensuring High Availability using Replication

Going on production without replication can cause your app sudden down failures. Replication takes care of the problem if a node fails. Manage read, write operations for your secondary MongoDB instances according to your application needs.

Keep these things in mind while Replicating:

  • For high availability, deploy your replica set into a minimum of three data centers.
  • Ensure that MongoDB instances have 0 or 1 votes.
  • Ensure full bi-directional network connectivity between all MongoDB instances.

Example of creating a replica set with 4 local MongoDB instances:

  1. Creating 4 local MongoDB instances

    First, create data directories

    mkdir -p /data/m0
    mkdir -p /data/m1
    mkdir -p /data/m2
    mkdir -p /data/m3
  2. Start 4 local instances

    mongod --replSet cluster1 --port 27017 --dbpath /data/m0
    mongod --replSet cluster2 --port 27018 --dbpath /data/m1
    mongod --replSet cluster1 --port 27019 --dbpath /data/m2
    mongod --replSet cluster1 --port 27020 --dbpath /data/m3
  3. Add the instances to the cluster and initiate

    mongo myhost:34014
    myConfig = {_id: ‘cluster1’, members: [
        {_id: 0, host: ‘myhost1:27017’},
        {_id: 1, host: ‘myhost2:27018’},
        {_id: 2, host: ‘myhost3:27019’},
        {_id: 3, host: ‘myhost4:27020’}]
    }
    rs.initiate(myConfig);

Security Measures

7) Secure Machines

Open ports on machines hosting MongoDB are vulnerable to various malicious attacks. More than 30 thousand MongoDB databases had been compromised in a ransomware attack due to lag in proper security configuration. While going on production close your public ports of MongoDB server. However, You should keep one port open for SSh purpose.

Enabling Authentication on MongoDB instance:

  1. Launch mongod.conf file in your favorite editor.

  2. Append these lines at the end of the config file.

    security:
          authorization: enabled
  3. Append these lines at the end of the config file.

    service mongod restart
  4. Confirm the status

    service mongod status

Restraining external access

Open mongod.conf file again to set limited IPs access your server.

bind_ip=127.0.0.1

By adding this line, it means you can only access your server through 127.0.0. (which is localhost). You can also add multiple IPs in bind option.

bind_ip=127.0.0.1,168.21.200.200

It means you can access from localhost and your private network.
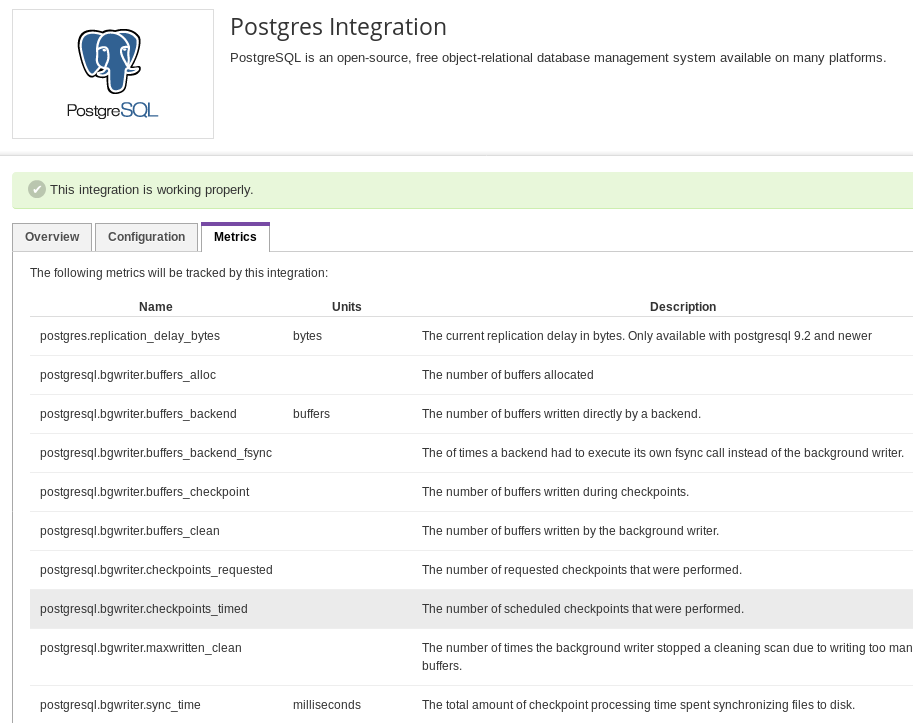
8) Password Protection

To add an extra security layer to your machines enable access control and enforce authentication. Despite the fact that you have restrained MongoDB server to accept connections from the outside world, there is still a possibility of any malicious scripts to get into your server. So, don’t be reluctant to set a username/password for your database and assign required permissions. Enabled access control will allow users only to perform actions determined by their roles.
Here are the steps to create a user and assigning database access with specific roles.

In the first place we will create a user (in this case, it’s admin) for managing all users and databases and then we will create specific database owner having only read and write privileges on one MongoDB database instance.

Create an admin user for managing others users for database instances

  1. Open your Mongo shell and switch to the admin database:

    use admin
  2. Create a user for admin database

    db.createUser({ user: "admin", pwd: "admin_password", roles: [{ role: "userAdminAnyDatabase", db: "admin" }] })
  3. Authenticate newly created user

    db.auth("admin", "admin_password")
  4. Creating specific instance user:

    use database_1
    db.createUser({ user: "user_1", pwd: "your_password", roles: [{ role: "dbOwner", db: "database_1" }] })
  5. Now verify, if a user has been successfully created or not.

    db.auth("user_1", "your_password")
    show collections

That’s it! You have successfully secured your database instances with proper authentication. You can add as many users as you want following the same procedure.

9) Encryption and Protection of Data

If you are using Wiredtiger as a storage engine then you can use it’s encryption at rest configuration to encrypt your data. If not, then encryption should be performed on the host using a file system, devices or physical encryption.

10) Monitor Your Deployment

Once you have finished the deployment of MongoDB into production, then you must track the performance activity to prevent early possible problems. There is a range of strategies you can adapt to monitor your data performance in the production environment.

  • MongoDB includes utilities, which return statistics about instance performance and activity. Utilities are used to pinpoint issues and analyze normal operations.

  • Use mongostat to apprehend arrangement of operation types and capacity planning.

  • For tracking reports and read-write activities, mongotop is recommended.

mongotop 15

This command will return output after every 15 seconds.

                     ns    total    read    write          2018-04-22T15:32:01-05:00
   admin.system.roles      0ms     0ms      0ms
 admin.system.version      0ms     0ms      0ms
             local.me      0ms     0ms      0ms
       local.oplog.rs      0ms     0ms      0ms
   local.replset.minvalid  0ms     0ms      0ms
    local.startup_log      0ms     0ms      0ms
 local.system.indexes      0ms     0ms      0ms
  local.system.namespaces  0ms     0ms      0ms
 local.system.replset      0ms     0ms      0ms     
                     ns    total    read    write          2018-04-22T15:32:16-05:00
   admin.system.roles      0ms     0ms      0ms
 admin.system.version      0ms     0ms      0ms
             local.me      0ms     0ms      0ms
       local.oplog.rs      0ms     0ms      0ms
   local.replset.minvalid  0ms     0ms      0ms
    local.startup_log      0ms     0ms      0ms
 local.system.indexes      0ms     0ms      0ms
  local.system.namespaces  0ms     0ms      0ms
 local.system.replset      0ms     0ms      0ms

MongoDB Monitoring Service (MMS) is another available option that monitors your MongoDB cluster and makes it convenient for you to have a sight of production deployment activities.

And of course there is ClusterControl by Severalnines, the automation and management system for open source databases. ClusterControl enables easy deployment of clusters with automated security settings and makes it simple to troubleshoot your database by providing easy-to-use management automation that includes repair and recovery of broken nodes, automatic upgrades, and more. You can get started with its (free forever) Community Edition, with which you can deploy and monitor MongoDB as well as create custom advisors in order to tune your monitoring efforts to those aspects that are specific to your setup. Download it free here.

Getting the Most Out of ClusterControl Community Edition

$
0
0

ClusterControl is an agentless management and monitoring system that helps to deploy, manage, monitor and scale our databases from a friendly interface. It allows us to perform, in a few seconds, database management tasks that would take us hours of work and research to do manually.

It can be easily installed in a dedicated VM or physical host using an installation script or we can consult the official documentation available on the Severalnines web site for more options.

ClusterControl comes in three versions, Community, Advanced and Enterprise.

The main features of each are the following:

ClusterControl Versions Features

To test the system, we provide a trial period of 30 days. During that period, we can make use of all the functionalities that available in the product, such as importing our existing databases or clusters, adding load balancers, scaling with additional nodes, and automatic recovery from failures, among others.

ClusterControl has support for the top open source database technologies MySQL, MariaDB, MongoDB, PostgreSQL, Galera Cluster and more. It supports nearly two dozen database versions, that one can try on premises or in the cloud. This enables you to test which database technology, or which high availability configuration, is the most suitable for your application.

Next, let’s have a detailed look of what we can do with the Community version (after the trial period), at no cost and without time limit.

Deploy

ClusterControl allows you to deploy a number of high availability configurations in the Community Edition. To perform a deployment, simply select the option "Deploy" and follow the instructions that appear.

ClusterControl Deploy Image 1

When selecting Deploy, we must specify User, Key or Password and port to connect by SSH to our servers. We also need the name for our new cluster and if we want ClusterControl to install the corresponding software and configurations for us.

ClusterControl Deploy Image 2

For our example we will create a Galera Cluster with 3 nodes.

ClusterControl Deploy Image 3

After configuring the SSH access information, we must enter the data of our database, such as Vendor, Version, data dir and access to the database.

We can also specify which repository to use and add our servers to the cluster that we are going to create.

When adding our servers, we can enter IP or hostname. For the latter, we must have a DNS server or have added our PostgreSQL servers to the local resolution file (/etc/hosts) of our ClusterControl, so it can resolve the corresponding name that you want to add.

We can monitor the status of the creation of our new cluster from the ClusterControl activity monitor.

ClusterControl Deploy Image 4

Once the task is finished, we can see our cluster in the main ClusterControl screen. Note that it is also possible to use the ClusterControl CLI for those who prefer command line.

ClusterControl
Single Console for Your Entire Database Infrastructure
Find out what else is new in ClusterControl

Monitoring

ClusterControl Community Edition allows us to monitor our servers in real time. It provides us from a high-level, multi-datacenter view to a deep-dive node view. This means that we can see a unified view of all of our deployments across data centers, as well as the possibility to drill down into individual nodes as required. We will have graphs with basic host statistics, such as CPU, Network, Disk, RAM, IOPS, as well as database metrics.

If you go to the Cluster, you can check an overview of it.

ClusterControl Monitoring Overview

If you go to Cluster -> Nodes, you can check the status, graphs, performance, or variables of them.

ClusterControl Monitoring Nodes

You can check your database queries from the Query Monitor in Cluster -> Query Monitor.

ClusterControl Monitoring Queries

Also, you have information about your database performance in Cluster -> Performance.

ClusterControl Monitoring Performance

Using these functionalities we can identify slow or incorrect queries very easily, optimize them, and improve the performance of our systems.

In this way, we can have our cluster fully monitored, without adding additional tools or utilities ,and for free.

Performance Advisors

We have a number of predefined advisors, starting from simple ones like CPU usage, disk space, top queries, to more advanced ones detecting redundant indexes, queries not using indexes that cause table scans, and so on.

We can see the predefined advisors in Cluster -> Performance -> Advisors.

Advisors
Advisors

Here we can see details, disable, enable or edit our Advisors.

Also we can easily configure our own advisors. We can check our custom advisors in Cluster -> Manage -> Custom Advisors.

Custom Advisors
Custom Advisors

Develop custom advisors

We can also create our own advisors using the Developer Studio tool, available in Cluster -> Manage -> Developer Studio.

Developer Studio
Developer Studio

With this tool, you can create your own custom database advisors to monitor specific items to let you know if something goes wrong.

Topology View

To use this feature, you need to go to Cluster -> Topology.

From the Topology view, you can get a visual representation of your cluster, quickly see how they are organized and the health status of each node. This is particularly useful when having e.g., replication setups with multiple masters. You can also detect problems very easily, as each object presents a quick summary of its status.

ClusterControl Topology View

You can also check details about replication and operative system from each node.

Community Support

Finally, for any question or problem that comes our way, we have community support available, where both the Severalnines technicians and the community itself can help us solve our problems.

We also have a number of free resources available, such as blogs, webinars, documentation, or tips and tricks for ClusterControl on our website.

Conclusion

As we saw in this blog, ClusterControl Community Edition gives us the possibility to deploy database clusters and get a real-time view of database status and queries. This can help save time and work in our daily tasks, and is a great way to get started. Do give it a try and let us know what you think. There are other useful features in the commercial edition, such as security, backups, automatic recovery, load balancers and more, that can be activated by upgrading our license.

Viewing all 385 articles
Browse latest View live