Quantcast
Channel: Severalnines - clustercontrol
Viewing all 385 articles
Browse latest View live

Updated: Become a ClusterControl DBA: Safeguarding your Data

$
0
0

In the past four posts of the blog series, we covered deployment of clustering/replication (MySQL/Galera, MySQL Replication, MongoDB & PostgreSQL), management & monitoring of your existing databases and clusters, performance monitoring and health and in the last post, how to make your setup highly available through HAProxy and ProxySQL.

So now that you have your databases up and running and highly available, how do you ensure that you have backups of your data?

You can use backups for multiple things: disaster recovery, to provide production data to test against development or even to provision a slave node. This last case is already covered by ClusterControl. When you add a new (replica) node to your replication setup, ClusterControl will make a backup/snapshot of the master node and use it to build the replica. It can also use an existing backup to stage the replica, in case you want to avoid that extra load on the master. After the backup has been extracted, prepared and the database is up and running, ClusterControl will automatically set up replication.

Creating an Instant Backup

In essence, creating a backup is the same for Galera, MySQL replication, PostgreSQL and MongoDB. You can find the backup section under ClusterControl > Backup and by default you would see a list of created backup of the cluster (if any). Otherwise, you would see a placeholder to create a backup:

From here you can click on the "Create Backup" button to make an instant backup or schedule a new backup:
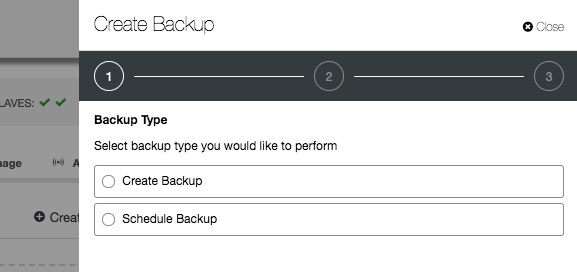
All created backups can also be uploaded to cloud by toggling "Upload Backup to the Cloud", provided you supply working cloud credentials. By default, all backups older than 31 days will be deleted (configurable via Backup Retention settings) or you can choose to keep it forever or define a custom period.

"Create Backup" and "Schedule Backup" share similar options except the scheduling part and incremental backup options for the latter. Therefore, we are going to look into Create Backup feature (a.k.a instant backup) in more depth.

As all these various databases have different backup tools, there is obviously some difference in the options you can choose. For instance with MySQL you get to choose between mysqldump and xtrabackup (full and incremental). For MongoDB, ClusterControl supports mongodump and mongodb-consistent-backup (beta) while PostgreSQL, pg_dump and pg_basebackup are supported. If in doubt which one to choose for MySQL, check out this blog about the differences and use cases for mysqldump and xtrabackup.

Backing up MySQL and Galera

As mentioned in the previous paragraph, you can make MySQL backups using either mysqldump or xtrabackup (full or incremental). In the "Create Backup" wizard, you can choose which host you want to run the backup on, the location where you want to store the backup files, and its directory and specific schemas (xtrabackup) or schemas and tables (mysqldump).
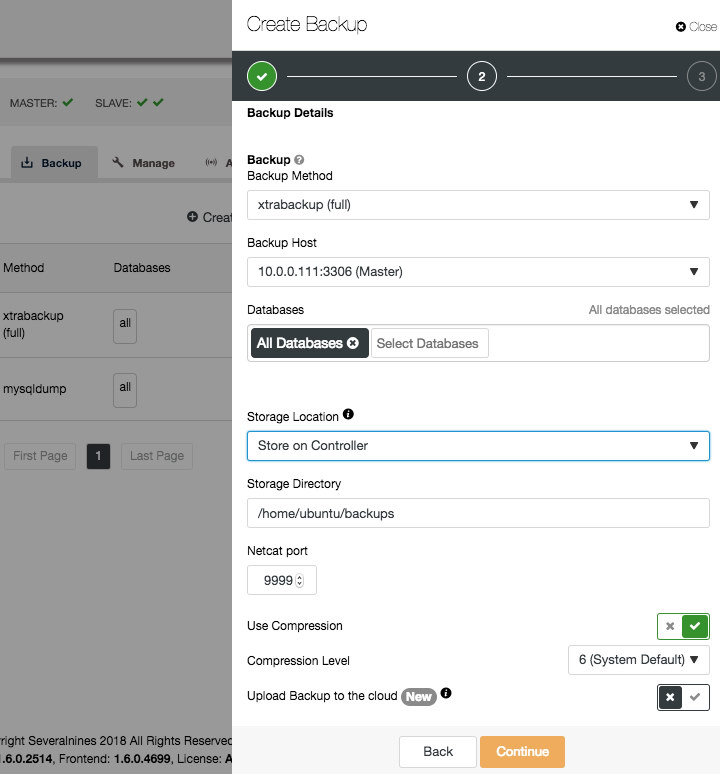
If the node you are backing up is receiving (production) traffic, and you are afraid the extra disk writes will become intrusive, it is advised to send the backups to the ClusterControl host by choosing "Store on Controller" option. This will cause the backup to stream the files over the network to the ClusterControl host and you have to make sure there is enough space available on this node and the streaming port is opened on the ClusterControl host.

There are also several other options whether you would want to use compression and the compression level. The higher the compression level is, the smaller the backup size will be. However, it requires higher CPU usage for the compression and decompression process.

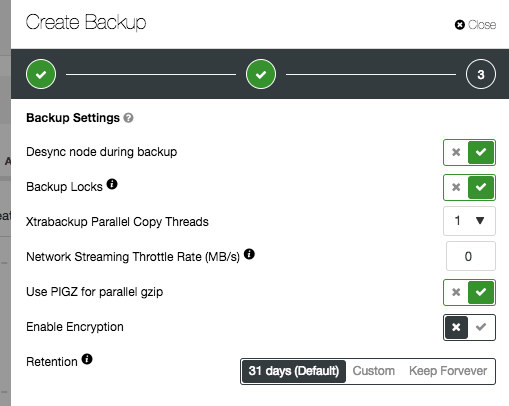
If you would choose xtrabackup as the method for the backup, it would open up extra options: desync, backup locks, compression and xtrabackup parallel threads/gzip. The desync option is only applicable to desync a node from a Galera cluster. Backup locks uses a new MDL lock type to block updates to non-transactional tables and DDL statements for all tables which is more efficient for InnoDB-specific workload. If you are running on Galera Cluster, enabling this option is recommended.
After scheduling an instant backup you can keep track of the progress of the backup job in the Activity > Jobs:

After it has finished, you should be able to see the a new entry under the backup list.

Backing up PostgreSQL

Similar to the instant backups of MySQL, you can run a backup on your Postgres database. With Postgres backups there are two backup methods supported - pg_dumpall or pg_basebackup. Take note that ClusterControl will always perform a full backup regardless of the chosen backup method.
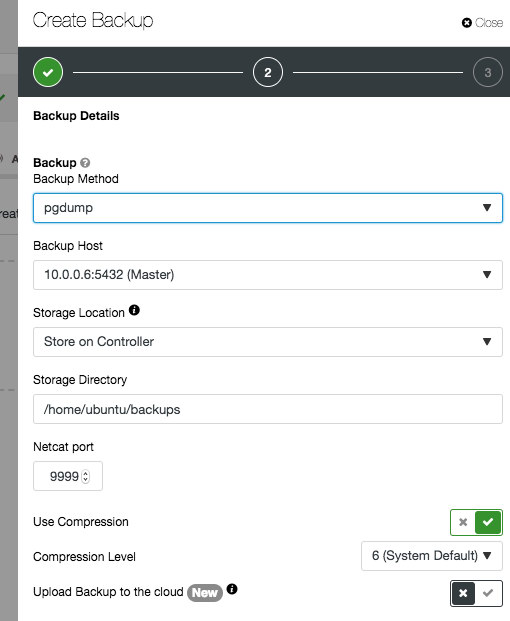
We have covered this aspect in this details in Become a PostgreSQL DBA - Logical & Physical PostgreSQL Backups.

Backing up MongoDB

For MongoDB, ClusterControl supports the standard mongodump and mongodb-consistent-backup developed by Percona. The latter is still in beta version which provides cluster-consistent point-in-time backups of MongoDB suitable for sharded cluster setups. As the sharded MongoDB cluster consists of multiple replica sets, a config replica set and shard servers, it is very difficult to make a consistent backup using only mongodump.
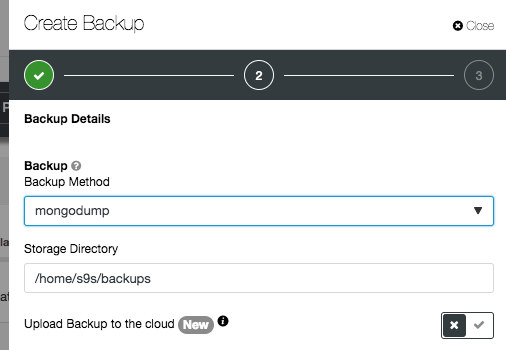
Note that in the wizard, you don't have to pick a database node to be backed up. ClusterControl will automatically pick the healthiest secondary replica as the backup node. Otherwise, the primary will be selected. When the backup is running, the selected backup node will be locked until the backup process completes.

Scheduling Backups

Now that we have played around with creating instant backups, we now can extend that by scheduling the backups.

The scheduling is very easy to do: you can select on which days the backup has to be made and at what time it needs to run.
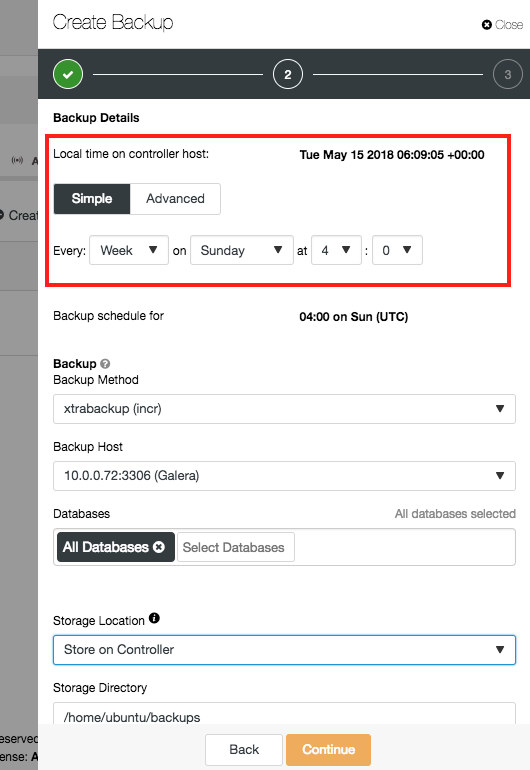
For xtrabackup there is an additional feature: incremental backups. An incremental backup will only backup the data that changed since the last backup. Of course, the incremental backups are useless if there would not be full backup as a starting point. Between two full backups, you can have as many incremental backups as you like. But restoring them will take longer.

Once scheduled the job(s) should become visible under the "Scheduled Backup" tab and you can edit them by clicking on the "Edit" button. Like with the instant backups, these jobs will schedule the creation of a backup and you can keep track of the progress via the Activity tab.
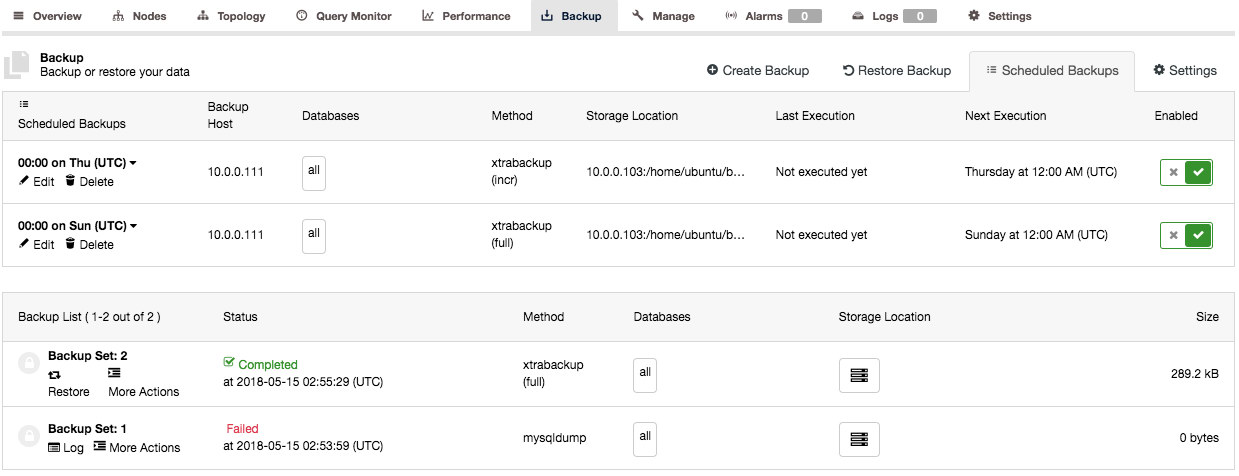
Backup List

You can find the Backup List under ClusterControl > Backup and this will give you a cluster level overview of all backups made. Clicking on each entry will expand the row and expose more information about the backup:
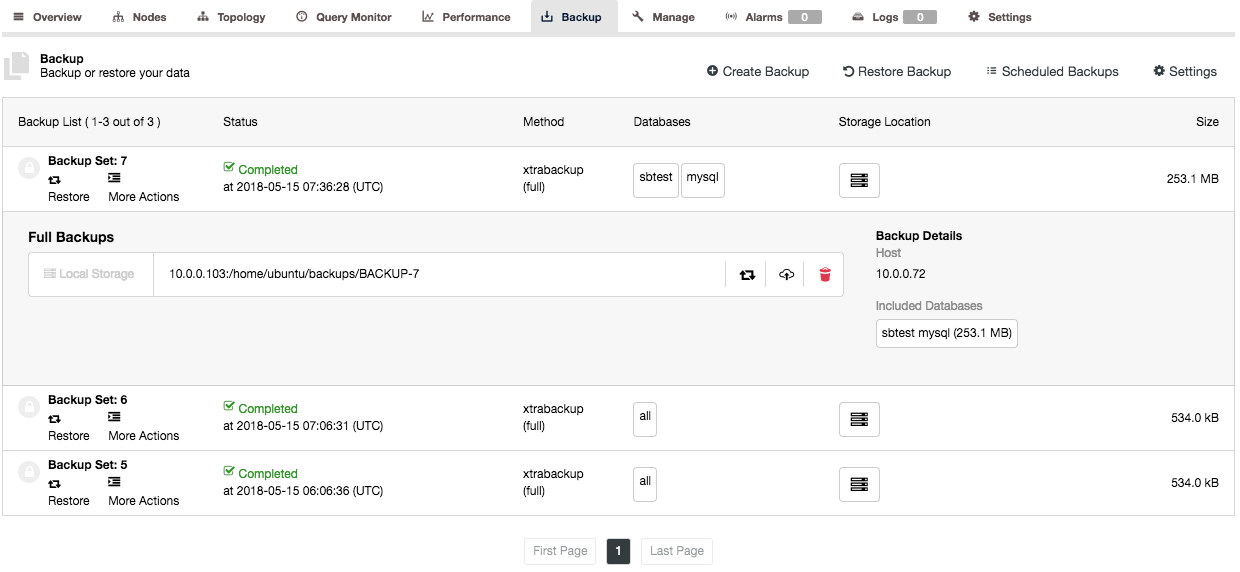
Each backup is accompanied with a backup log when ClusterControl executed the job, which is available under "More Actions" button.

Offsite Backup in Cloud

Since we have now a lot of backups stored on either the database hosts or the ClusterControl host, we also want to ensure they don’t get lost in case we face a total infrastructure outage. (e.g. DC on fire or flooded) Therefore ClusterControl allows you to store or copy your backups offsite on cloud. The supported cloud platforms are Amazon S3, Google Cloud Storage and Azure Cloud Storage.

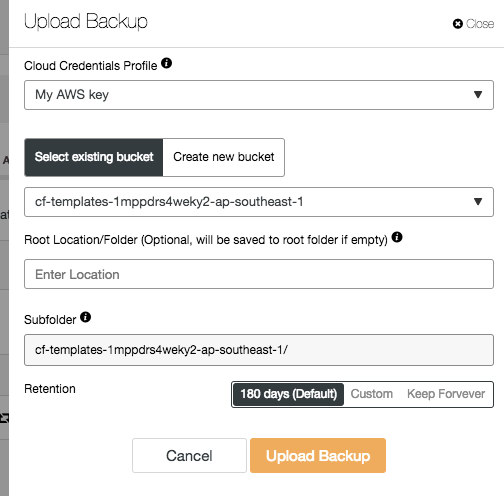
The upload process happens right after the backup is successfully created (if you toggle "Upload Backup to the Cloud") or you can manually click on the cloud icon button of the backup list:

Choose the cloud credential and specify the backup location accordingly:
Restore and/or Verify Backup

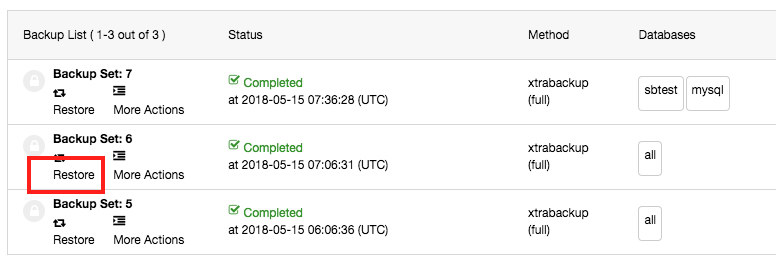
From the Backup List interface, you can directly restore a backup to a host in the cluster by clicking on the "Restore" button for the particular backup or click on the "Restore Backup" button:
One nice feature is that it is able to restore a node or cluster using the full and incremental backups as it will keep track of the last full backup made and start the incremental backup from there. Then it will group a full backup together with all incremental backups till the next full backup. This allows you to restore starting from the full backup and applying the incremental backups on top of it.

ClusterControl supports restore on an existing database node or restore and verify on a new standalone host:
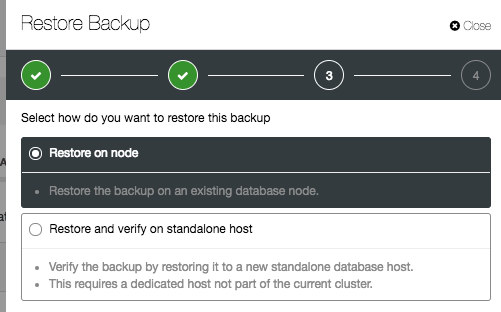
These two options are pretty similar, except the verify one has extra options for the new host information. If you follow the restoration wizard, you will need to specify a new host. If "Install Database Software" is enabled, ClusterControl will remove any existing MySQL installation on the target host and reinstall the database software with the same version as the existing MySQL server.
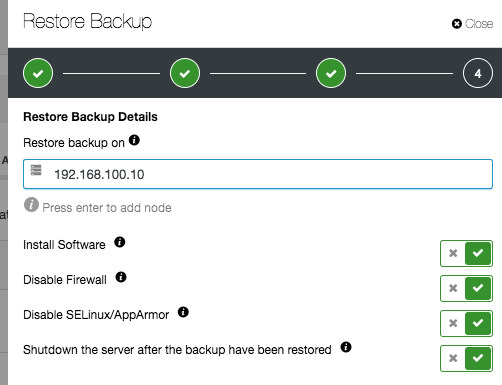
Once the backup is restored and verified, you will receive a notification on the restoration status and the node will be shut down automatically.

Point-in-Time Recovery

For MySQL, both xtrabackup and mysqldump can be used to perform point-in-time recovery and also to provision a new replication slave for master-slave replication or Galera Cluster. A mysqldump PITR-compatible backup contains one single dump file, with GTID info, binlog file and position. Thus, only the database node that produces binary log will have the "PITR compatible" option available:
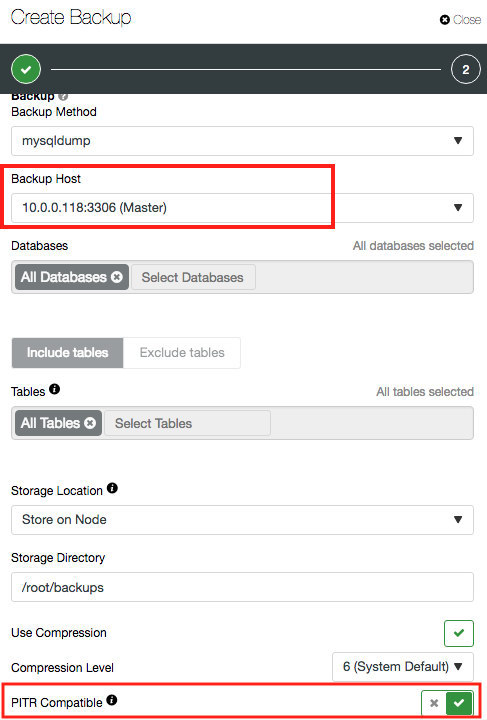
When PITR compatible option is toggled, the database and table fields are greyed out since ClusterControl will always perform a full backup against all databases, events, triggers and routines of the target MySQL server.

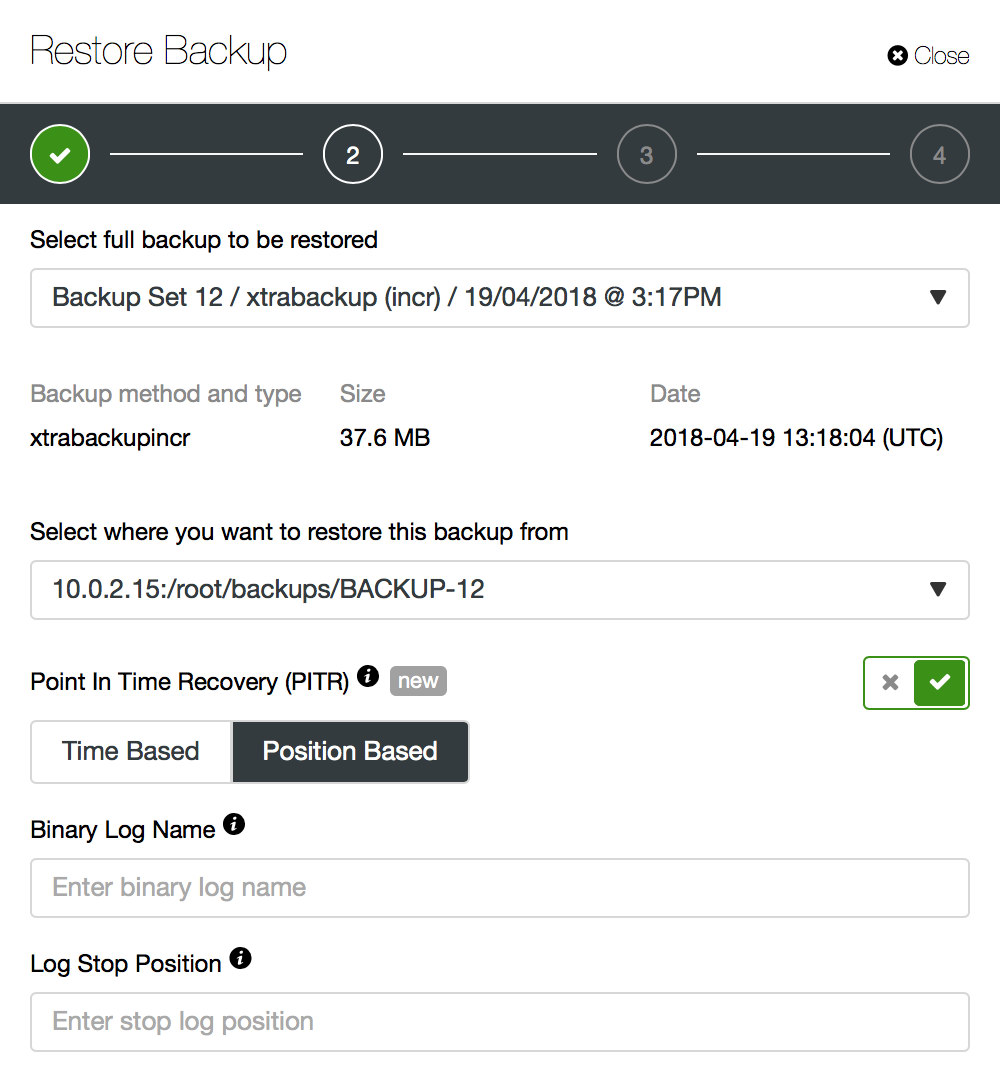
Now restoring the backup. If the backup is compatible with PITR, an option will be presented to perform a Point-In-Time Recovery. You will have two options for that - “Time Based” and “Position Based”. For “Time Based”, you can just pass the day and time. For “Position Based”, you can pass the exact position to where you want to restore. It is a more precise way to restore, although you might need to get the binlog position using the mysqlbinlog utility. More details about point in time recovery can be found in this blog.
Backup Encryption

Universally, ClusterControl supports backup encryption for MySQL, MongoDB and PostgreSQL. Backups are encrypted at rest using AES-256 CBC algorithm. An auto generated key will be stored in the cluster's configuration file under /etc/cmon.d/cmon_X.cnf (where X is the cluster ID):

$ sudo grep backup_encryption_key /etc/cmon.d/cmon_1.cnf
backup_encryption_key='JevKc23MUIsiWLf2gJWq/IQ1BssGSM9wdVLb+gRGUv0='

If the backup destination is not local, the backup files are transferred in encrypted format. This feature complements the offsite backup on cloud, where we do not have full access to the underlying storage system.

Final Thoughts

We showed you how to get your data backed up and how to store them safely off site. Recovery is always a different thing. ClusterControl can recover automatically your databases from the backups made in the past that are stored on premises or copied back from the cloud.

Obviously there is more to securing your data, especially on the side of securing your connections. We will cover this in the next blog post!


Setting up HTTPS on the ClusterControl Server

$
0
0

As a platform that manages all of your databases, ClusterControl maintains the communication with the backend servers, it sends commands and collect metrics. In order to avoid unauthorized access, it is critical that the communication between your browser and a ClusterControl UI is encrypted. In this blog post we will take a look at how ClusterControl uses HTTPS to improve security.

By default, ClusterControl is configured with HTTPS enabled when you deployed it using the deployment script. All you need to do is to point your browser to: https://cc.node.hostname/clustercontrol and you can enjoy secured connection, as shown on the screenshot below.

We will go through this configuration in details. If you do not have HTTPS configured for ClusterControl, this blog will show you how to change your Apache config to enable secure connections.

Apache configuration - Debian/Ubuntu

When Apache is deployed by ClusterControl, a file: /etc/apache2/sites-enabled/001-s9s-ssl.conf is deployed. Below is the content of that file stripped from any comments:

root@vagrant:~# cat /etc/apache2/sites-enabled/001-s9s-ssl.conf | perl -pe 's/\s*\#.*//' | sed '/^$/d'<IfModule mod_ssl.c>
    <VirtualHost _default_:443>
        ServerName cc.severalnines.local
        ServerAdmin webmaster@localhost
        DocumentRoot /var/www/html
        RewriteEngine On
        RewriteRule ^/clustercontrol/ssh/term$ /clustercontrol/ssh/term/ [R=301]
        RewriteRule ^/clustercontrol/ssh/term/ws/(.*)$ ws://127.0.0.1:9511/ws/$1 [P,L]
        RewriteRule ^/clustercontrol/ssh/term/(.*)$ http://127.0.0.1:9511/$1 [P]
        <Directory />
            Options +FollowSymLinks
            AllowOverride All
        </Directory>
        <Directory /var/www/html>
            Options +Indexes +FollowSymLinks +MultiViews
            AllowOverride All
            Require all granted
        </Directory>
        SSLEngine on
SSLCertificateFile /etc/ssl/certs/s9server.crt
SSLCertificateKeyFile /etc/ssl/private/s9server.key
        <FilesMatch "\.(cgi|shtml|phtml|php)$">
                SSLOptions +StdEnvVars
        </FilesMatch>
        <Directory /usr/lib/cgi-bin>
                SSLOptions +StdEnvVars
        </Directory>
        BrowserMatch "MSIE [2-6]" \
                nokeepalive ssl-unclean-shutdown \
                downgrade-1.0 force-response-1.0
        BrowserMatch "MSIE [17-9]" ssl-unclean-shutdown
    </VirtualHost>
</IfModule>

Important and not standard bits are RewriteRule directives which are used for web SSH in the UI. Otherwise, it’s a pretty standard VirtualHost definition. Please mind that you will have to create SSL keys if you would attempt to recreate this configuration by hand. ClusterControl, when being installed, creates them for you.

Also in /etc/apache2/ports.conf a directive for Apache to listen on port 443 has been added:

<IfModule ssl_module>
        Listen 443
</IfModule>

<IfModule mod_gnutls.c>
        Listen 443
</IfModule>

Again, pretty much typical setup.

Apache configuration - Red Hat, Centos

Configuration looks almost the same, it’s just located in a different place:

[root@localhost ~]# cat /etc/httpd/conf.d/ssl.conf | perl -pe 's/\s*\#.*//' | sed '/^$/d'<IfModule mod_ssl.c>
    <VirtualHost _default_:443>
        ServerName cc.severalnines.local
        ServerAdmin webmaster@localhost
        DocumentRoot /var/www/html
        RewriteEngine On
        RewriteRule ^/clustercontrol/ssh/term$ /clustercontrol/ssh/term/ [R=301]
        RewriteRule ^/clustercontrol/ssh/term/ws/(.*)$ ws://127.0.0.1:9511/ws/$1 [P,L]
        RewriteRule ^/clustercontrol/ssh/term/(.*)$ http://127.0.0.1:9511/$1 [P]
        <Directory />
            Options +FollowSymLinks
            AllowOverride All
        </Directory>
        <Directory /var/www/html>
            Options +Indexes +FollowSymLinks +MultiViews
            AllowOverride All
            Require all granted
        </Directory>
        SSLEngine on
SSLCertificateFile /etc/pki/tls/certs/s9server.crt
SSLCertificateKeyFile /etc/pki/tls/private/s9server.key
        <FilesMatch "\.(cgi|shtml|phtml|php)$">
                SSLOptions +StdEnvVars
        </FilesMatch>
        <Directory /usr/lib/cgi-bin>
                SSLOptions +StdEnvVars
        </Directory>
        BrowserMatch "MSIE [2-6]" \
                nokeepalive ssl-unclean-shutdown \
                downgrade-1.0 force-response-1.0
        BrowserMatch "MSIE [17-9]" ssl-unclean-shutdown
    </VirtualHost>
</IfModule>

Again, RewriteRule directives are used to enable web SSH console. In addition to this, ClusterControl adds the following lines at the top of /etc/httpd/conf/httpd.conf file:

ServerName 127.0.0.1
Listen 443

This is all that’s needed to have ClusterControl running using HTTPS.

ClusterControl
Single Console for Your Entire Database Infrastructure
Find out what else is new in ClusterControl

Troubleshooting

In case of issues, here are the steps you can use to identify some of the problems. First of all, if you cannot access ClusterControl over HTTPS, please make sure that Apache listens on port 443. You can check it by using netstat. Below are results for Centos 7 and Ubuntu 16.04:

[root@localhost ~]# netstat -lnp | grep 443
tcp6       0      0 :::443                  :::*                    LISTEN      977/httpd

root@vagrant:~# netstat -lnp | grep 443
tcp6       0      0 :::443                  :::*                    LISTEN      1389/apache2

If Apache does not listen on that port, please review the configuration and check if there’s a “Listen 443” directive added to Apache’s configuration. Please also check if ssl module is enabled. You can check it by running:

root@vagrant:~# apachectl -M | grep ssl
 ssl_module (shared)

If you have “Listen” directive used in “IfModule” section, like below:

<IfModule ssl_module>
        Listen 443
</IfModule>

You have to make sure that it’s in the configuration after modules have been loaded. For example, in Ubuntu 16.04 it’ll be those lines in /etc/apache2/apache2.conf:

# Include module configuration:
IncludeOptional mods-enabled/*.load
IncludeOptional mods-enabled/*.conf

On Centos 7 it’ll be /etc/httpd/conf/httpd.conf file and line:

# Example:
# LoadModule foo_module modules/mod_foo.so
#
Include conf.modules.d/*.conf

Normally, ClusterControl handles that correctly but if you are adding HTTPS support manually, you need to keep this in mind.

As always, please refer to Apache logs for further investigation - if HTTPS is up but for some reason you cannot reach the UI, it is possible that more clues could be found in the logs.

PostgreSQL Management and Automation with ClusterControl - New Whitepaper

$
0
0

We’re happy to announce that our new whitepaper PostgreSQL Management and Automation with ClusterControl is now available to download for free!

This whitepaper provides an overview of what it takes to configure and manage a PostgreSQL production environment and shows how ClusterControl provides PostgreSQL automation in a centralized and user-friendly way.

Topics included in this whitepaper are…

  • Introduction to PostgreSQL
  • Backup & Recovery
  • HA Setups (Master/Slave & Master/Master)
  • Load Balancing & Connection Pooling
  • Monitoring
  • Automation with ClusterControl
  • ChatOps via CCBot

You have many options for managing your PostgreSQL databases but ClusterControl lets you deploy, manage, monitor and scale; providing you full control of your databases.

If you are currently running PostgreSQL or considering migrating your database to PostgreSQL this whitepaper will help you get started and ensure your databases are optimized and operating at peak performance. Download the whitepaper today!

ClusterControl
Single Console for Your Entire Database Infrastructure
Find out what else is new in ClusterControl

ClusterControl for PostgreSQL

PostgreSQL is considered by many to be the world’s most advanced relational database system and ClusterControl supports its deployment, management, monitoring and scaling. Each deployed PostgreSQL instance is automatically configured using our easy to use point-and-click interface. You can manage backups, run queries, and perform advanced monitoring of all the master and slaves; all with automated failover if something goes wrong.

The automation tools inside ClusterControl let you easily setup a PostgreSQL replication environment, where you can add new replication slaves from scratch or use ones that are already configured. It also allows you to promote masters and rebuild slaves.

ClusterControl provides the following features to drive automation and performance...

  • Deployment - Deploy the latests PostgreSQL versions using proven methodologies you can count on to work
  • Management - Automated failover & recovery, Backup, Restore and Verification, Advanced security, Topology management, and a Developer Studio for advanced orchestration
  • Monitoring - Unified view across data centers with ability to drill down into individual nodes, Full stack monitoring, from load balancers to database instances down to underlying hosts, Query Monitoring, and Database Advisors
  • Scaling - Streaming Replication architectures and the ability to easily add and configure the most popular load balancing technologies.

To learn more about ClusterControl click here.

ClusterControl Release 1.6.1: MariaDB Backup & PostgreSQL in the Cloud

$
0
0

We are excited to announce the 1.6.1 release of ClusterControl - the all-inclusive database management system that lets you easily deploy, monitor, manage and scale highly available open source databases in any environment: on-premise or in the cloud.

ClusterControl 1.6.1 introduces new Backup Management features for MariaDB, Deployment & Configuration Management features for PostgreSQL in the Cloud as well as a new Monitoring & Alerting feature with the integration with ServiceNow, the popular services management system for the enterprise … and more!

Release Highlights

For MariaDB - Backup Management Features

We’ve added Backup Management features with the addition of MariaDB Backup based clusters as well as support for MaxScale 2.2 (MariaDB’s load balancing technology).

For PostgreSQL - Deployment & Configuration Management Features

We’ve built new Deployment & Configuration Management features for deploying PostgreSQL to the Cloud. Users can also now easily deploy Synchronous Replication Slaves using this latest version of ClusterControl.

Monitoring & Alerting Feature - ServiceNow

ClusterControl users can now easily integrate with ServiceNow, the popular services management system for the enterprise.

Additional Highlights

We’ve also recently implemented improvements and fixes to ClusterControl’s MySQL (NDB) Cluster features.

View the ClusterControl ChangeLog for all the details!

ClusterControl
Single Console for Your Entire Database Infrastructure
Find out what else is new in ClusterControl

View Release Details and Resources

Release Details

For MariaDB - Backup Management Features

With MariaDB Server 10.1, the MariaDB team introduced MariaDB Compression and Data-at-Rest Encryption, which is supported by MariaDB Backup. It’s an open source tool provided by MariaDB (and a fork of Percona XtraBackup) for performing physical online backups of InnoDB, Aria and MyISAM tables.

ClusterControl 1.6.1 now features support for MariaDB Backup for MariaDB-based systems. Users can now easily create, restore and schedule backups for their MariaDB databases using MariaDB Backup - whether full or incremental. Let ClusterControl manage your backups, saving you time for the rest of the maintenance of your databases.

With ClusterControl 1.6.1, we also introduce support for MaxScale 2.2, MariaDB’s load balancing technology.

Scheduling a new backup with ClusterControl using MariaDB Backup:

For PostgreSQL - Deployment & Configuration Management Features

ClusterControl 1.6.1 introduces new cloud deployment features for our PostgreSQL users. Whether you’re looking to deploy PostgreSQL nodes using management/public IPs for monitoring connections and data/private IPs for replication traffic; or you’re looking to deploy HAProxy using management/public IPs and private IPs for configurations - ClusterControl does it for you.

ClusterControl now also automates the deployment of Synchronous Replication Slaves for PostgreSQL. Synchronous replication offers the ability to confirm that all changes made by a transaction have been transferred to one or more synchronous standby servers, which allows you to build data-loss-less PostgreSQL clusters; and faster failovers.

Deploying PostgreSQL in the Cloud:

Monitoring & Alerting Feature - ServiceNow

With this new release, we are pleased to announce that ServiceNow has been added as a new notifications integration to ClusterControl. This service management system provides technical management support (such as asset and license management) to the IT operations of large corporations, including help desk functionalities and is a very popular integration. This allows enterprises to connect ClusterControl with ServiceNow and benefit from both systems’ features.

Adding ServiceNow as a New Integration to ClusterControl:

Additional New Functionalities

View the ClusterControl ChangeLog for all the details!

Download ClusterControl today!

Happy Clustering!

New Webinar: Disaster Recovery Planning for MySQL & MariaDB with ClusterControl

$
0
0

Everyone should have a disaster recovery plan for MySQL & MariaDB!

Join Vinay Joosery, CEO at Severalnines, on July 24th for our new webinar on Disaster Recovery Planning for MySQL & MariaDB with ClusterControl; especially if you find yourself wondering about disaster recovery planning for MySQL and MariaDB, if you’re unsure about RTO and RPO or whether you should you have a secondary datacenter, or are concerned about disaster recovery in the cloud…

Organizations need an appropriate disaster recovery plan in order to mitigate the impact of downtime. But how much should a business invest? Designing a highly available system comes at a cost, and not all businesses and certainly not all applications need five 9’s availability.

Vinay will explain key disaster recovery concepts and walk us through the relevant options from the MySQL & MariaDB ecosystem in order to meet different tiers of disaster recovery requirements; and demonstrate how ClusterControl can help fully automate an appropriate disaster recovery plan.

Sign up below to join the discussion!

Date, Time & Registration

Europe/MEA/APAC

Tuesday, July 24th at 09:00 BST / 10:00 CEST (Germany, France, Sweden)

Register Now

North America/LatAm

Tuesday, July 24th at 09:00 Pacific Time (US) / 12:00 Eastern Time (US)

Register Now

Agenda

  • Business Considerations for DR
    • Is 100% uptime possible?
    • Analyzing risk
    • Assessing business impact
  • Defining DR
    • Outage Timeline
    • RTO
    • RPO
    • RTO + RPO = 0 ?
  • DR Tiers
    • No offsite data
    • Database backup with no Hot Site
    • Database backup with Hot Site
    • Asynchronous replication to Hot Site
    • Synchronous replication to Hot Site
  • Implementing DR with ClusterControl
    • Demo
  • Q&A

Speaker

Vinay Joosery, CEO & Co-Founder, Severalnines

Vinay Joosery, CEO, Severalnines, is a passionate advocate and builder of concepts and business around distributed database systems. Prior to co-founding Severalnines, Vinay held the post of Vice-President EMEA at Pentaho Corporation - the Open Source BI leader. He has also held senior management roles at MySQL / Sun Microsystems / Oracle, where he headed the Global MySQL Telecoms Unit, and built the business around MySQL's High Availability and Clustering product lines. Prior to that, Vinay served as Director of Sales & Marketing at Ericsson Alzato, an Ericsson-owned venture focused on large scale real-time databases.

This webinar builds upon a related white paper written by Vinay on disaster recovery, which you can download here: https://severalnines.com/resources/whitepapers/disaster-recovery-planning-mysql-mariadb

We look forward to “seeing” you there!

Integrating Tools to Manage PostgreSQL in Production

$
0
0

Managing a PostgreSQL installation involves inspection and control over a wide range of aspects in the software/infrastructure stack on which PostgreSQL runs. This must cover:

  • Application tuning regarding database usage/transactions/connections
  • Database code (queries, functions)
  • Database system (performance, HA, backups)
  • Hardware/Infrastructure (disks, CPU/Memory)

PostgreSQL core provides the database layer on which we trust our data to be stored, processed and served. It also provides all the technology for having a truly modern, efficient, reliable and secure system. But often this technology is not available as a ready to use, refined business/enterprise class product in the core PostgreSQL distribution. Instead, there are a lot of products/solutions either by the PostgreSQL community or commercial offerings that fill those needs. Those solutions come either as user-friendly refinements to the core technologies, or extensions of the core technologies or even as integration between PostgreSQL components and other components of the system. In our previous blog titled Ten Tips for Going into Production with PostgreSQL, we looked into some of those tools which can help manage a PostgreSQL installation in production. In this blog we will explore in more detail the aspects that must be covered when managing a PostgreSQL installation in production, and the most commonly used tools for that purpose. We will cover the following topics:

  • Deployment
  • Management
  • Scaling
  • Monitoring

Deployment

In the old days, people used to download and compile PostgreSQL by hand, and then configure the runtime parameters and user access control. There are still some cases where this might be needed but as systems matured and started growing, the need arose for more standardized ways to deploy and manage Postgresql. Most OS’s provide packages to install, deploy and manage PostgreSQL clusters. Debian has standardized their own system layout supporting many Postgresql versions, and many clusters per version at the same time. postgresql-common debian package provides the needed tools. For instance in order to create a new cluster (called i18n_cluster) for PostgreSQL version 10 in Debian, we may do it by giving the following commands:

$ pg_createcluster 10 i18n_cluster -- --encoding=UTF-8 --data-checksums

Then refresh systemd:

$ sudo systemctl daemon-reload

and finally start and use the new cluster:

$ sudo systemctl start postgresql@10-i18n_cluster.service
$ createdb -p 5434 somei18ndb

(note that Debian handles different clusters by the use of different ports 5432, 5433 and so forth)

As the need grows for more automated and massive deployments, more and more installations use automation tools like Ansible, Chef and Puppet. Besides automation and reproducibility of deployments, automation tools are great because they are a nice way to document the deployment and configuration of a cluster. On the other hand, automation has evolved to become a large field on its own, requiring skilled people to write, manage and run automated scripts. More info on PostgreSQL provisioning can be found in this blog: Become a PostgreSQL DBA: Provisioning and Deployment.

Management

Managing a live system involves tasks as: schedule backups and monitor their status, disaster recovery, configuration management, high availability management and automatic failover handling. Backing up a Postgresql cluster can be done in various ways. Low level tools:

  • traditional pg_dump (logical backup)
  • file system level backups (physical backup)
  • pg_basebackup (physical backup)

Or higher level:

Each of those ways cover different use cases and recovery scenarios, and vary in complexity. PostgreSQL backup is tightly related to the notions of PITR, WAL archiving and replication. Through the years the procedure of taking, testing and finally (fingers crossed!) using backups with PostgreSQL has evolved to be a complex task. One may find a nice overview of the backup solutions for PostgreSQL in this blog: Top Backup Tools for PostgreSQL.

Regarding high availability and automatic failover the bare minimum that an installation must have in order to implement this is:

  • A working primary
  • A hot standby accepting WAL streamed from the primary
  • In the event of failed primary, a method to tell the primary that it is no longer the primary (sometimes called as STONITH)
  • A heartbeat mechanism to check for connectivity between the two servers and the health of the primary
  • A method to perform the failover (e.g. via pg_ctl promote, or trigger file)
  • An automated procedure for recreation of the old primary as a new standby: Once disruption or failure on the primary is detected then a standby must be promoted as the new primary. The old primary is no longer valid or usable. So the system must have a way to handle this state between the failover and the re-creation of the old primary server as the new standby. This state is called degenerate state, and the PostgreSQL provides a tool called pg_rewind in order to speed up the process of bringing the old primary back in sync-able state from the new primary.
  • A method to do on-demand/planned switchovers

A widely used tool that handles all the above is Repmgr. We will describe the minimal setup that will allow for a successful switchover. We start by a working PostgreSQL 10.4 primary running on FreeBSD 11.1, manually built and installed, and repmgr 4.0 also manually built and installed for this version (10.4). We will use two hosts named fbsd (192.168.1.80) and fbsdclone (192.168.1.81) with identical versions of PostgreSQL and repmgr. On the primary (initially fbsd , 192.168.1.80) we make sure the following PostgreSQL parameters are set:

max_wal_senders = 10
wal_level = 'logical'
hot_standby = on
archive_mode = 'on'
archive_command = '/usr/bin/true'
wal_keep_segments = '1000'

Then we create the repmgr user (as superuser) and database:

postgres@fbsd:~ % createuser -s repmgr
postgres@fbsd:~ % createdb repmgr -O repmgr

and setup host based access control in pg_hba.conf by putting the following lines on the top:

local   replication     repmgr                                     trust
host    replication     repmgr             127.0.0.1/32            trust
host    replication     repmgr             192.168.1.0/24            trust

local   repmgr     repmgr                                     trust
host    repmgr     repmgr             127.0.0.1/32            trust
host    repmgr     repmgr             192.168.1.0/24            trust

We make sure that we setup passwordless login for user repmgr in all nodes of the cluster, in our case fbsd and fbsdclone by setting authorized_keys in .ssh and then sharing .ssh. Then we create repmrg.conf on the primary as:

postgres@fbsd:~ % cat /etc/repmgr.conf
node_id=1
node_name=fbsd
conninfo='host=192.168.1.80 user=repmgr dbname=repmgr connect_timeout=2'
data_directory='/usr/local/var/lib/pgsql/data'

Then we register the primary:

postgres@fbsd:~ % repmgr -f /etc/repmgr.conf primary register
NOTICE: attempting to install extension "repmgr"
NOTICE: "repmgr" extension successfully installed
NOTICE: primary node record (id: 1) registered

And check the status of the cluster:

postgres@fbsd:~ % repmgr -f /etc/repmgr.conf cluster show
 ID | Name | Role    | Status    | Upstream | Location | Connection string                                            
----+------+---------+-----------+----------+----------+---------------------------------------------------------------
 1  | fbsd | primary | * running |          | default  | host=192.168.1.80 user=repmgr dbname=repmgr connect_timeout=2

We now work on the standby by setting repmgr.conf as follows:

postgres@fbsdclone:~ % cat /etc/repmgr.conf
node_id=2
node_name=fbsdclone
conninfo='host=192.168.1.81 user=repmgr dbname=repmgr connect_timeout=2'
data_directory='/usr/local/var/lib/pgsql/data'

Also we make sure that the data directory specified just in the line above exists, is empty and has the correct permissions:

postgres@fbsdclone:~ % rm -fr data && mkdir data
postgres@fbsdclone:~ % chmod 700 data

We now have to clone to our new standby:

postgres@fbsdclone:~ % repmgr -h 192.168.1.80 -U repmgr -f /etc/repmgr.conf --force standby clone
NOTICE: destination directory "/usr/local/var/lib/pgsql/data" provided
NOTICE: starting backup (using pg_basebackup)...
HINT: this may take some time; consider using the -c/--fast-checkpoint option
NOTICE: standby clone (using pg_basebackup) complete
NOTICE: you can now start your PostgreSQL server
HINT: for example: pg_ctl -D /usr/local/var/lib/pgsql/data start
HINT: after starting the server, you need to register this standby with "repmgr standby register"

And start the standby:

postgres@fbsdclone:~ % pg_ctl -D data start

At this point replication should be working as expected, verify this by querying pg_stat_replication (fbsd) and pg_stat_wal_receiver (fbsdclone). Next step is to register the standby:

postgres@fbsdclone:~ % repmgr -f /etc/repmgr.conf standby register

Now we can get the status of the cluster on either the standly or the primary and verify that the standby is registered:

postgres@fbsd:~ % repmgr -f /etc/repmgr.conf cluster show
 ID | Name      | Role    | Status    | Upstream | Location | Connection string                                            
----+-----------+---------+-----------+----------+----------+---------------------------------------------------------------
 1  | fbsd      | primary | * running |          | default  | host=192.168.1.80 user=repmgr dbname=repmgr connect_timeout=2
 2  | fbsdclone | standby |   running | fbsd     | default  | host=192.168.1.81 user=repmgr dbname=repmgr connect_timeout=2

Now let’s suppose that we wish to perform a scheduled manual switchover in order e.g. to do some administration work on node fbsd. On the standby node, we run the following command:

postgres@fbsdclone:~ % repmgr -f /etc/repmgr.conf standby switchover
…
NOTICE: STANDBY SWITCHOVER has completed successfully

The switchover has been executed successfully! Lets see what cluster show gives:

postgres@fbsdclone:~ % repmgr -f /etc/repmgr.conf cluster show
 ID | Name      | Role    | Status    | Upstream  | Location | Connection string                                            
----+-----------+---------+-----------+-----------+----------+---------------------------------------------------------------
 1  | fbsd      | standby |   running | fbsdclone | default  | host=192.168.1.80 user=repmgr dbname=repmgr connect_timeout=2
 2  | fbsdclone | primary | * running |           | default  | host=192.168.1.81 user=repmgr dbname=repmgr connect_timeout=2

The two servers have swapped roles! Repmgr provides repmgrd daemon which provides monitoring, automatic failover, as well as notifications/alerts. Combining repmgrd with pgbouncer, it possible to implement automatic update of the connection info of the database, thus providing fencing for the failed primary (preventing the failed node from any usage by the application) as well as providing minimal downtime for the application. In more complex schemes another idea is to combine Keepalived with HAProxy on top of pgbouncer and repmgr, in order to achieve:

  • load balancing (scaling)
  • high availability

Note that ClusterControl also manages failover of PostgreSQL replication setups, and integrates HAProxy and VirtualIP to automatically re-route client connections to the working master. More information can be found in this whitepaper on PostgreSQL Automation.

Download the Whitepaper Today
 
PostgreSQL Management & Automation with ClusterControl
Learn about what you need to know to deploy, monitor, manage and scale PostgreSQL

Scaling

As of PostgreSQL 10 (and 11) there is still no way to have multi-master replication, at least not from the core PostgreSQL. This means that only the select(read-only) activity can be scaled up. Scaling in PostgreSQL is achieved by adding more hot standbys, thus providing more resources for read-only activity. With repmgr it is easy to add new standby as we saw earlier via standby clone and standby register commands. Standbys added (or removed) must be made known to the configuration of the load-balancer. HAProxy, as mentioned above in the management topic, is a popular load balancer for PostgreSQL. Usually it is coupled with Keepalived which provides virtual IP via VRRP. A nice overview of using HAProxy and Keepalived together with PostgreSQL can be found in this article: PostgreSQL Load Balancing Using HAProxy & Keepalived.

Monitoring

An overview of what to monitor in PostgreSQL can be found in this article: Key Things to Monitor in PostgreSQL - Analyzing Your Workload. There are many tools that can provide system and postgresql monitoring via plugins. Some tools cover the area of presenting graphical chart of historic values (munin), other tools cover the area of monitoring live data and providing live alerts (nagios), while some tools cover both areas (zabbix). A list of such tools for PostgreSQL can be found here: https://wiki.postgresql.org/wiki/Monitoring. A popular tool for offline (log file based) monitoring is pgBadger. pgBadger is a Perl script which works by parsing the PostgreSQL log (which usually covers the activity of one day), extracting information, computing statistics and finally producing a fancy html page presenting the results. pgBadger is not restrictive on the log_line_prefix setting, it may adapt to your already existing format. For instance if you have set in your postgresql.conf something like:

log_line_prefix = '%r [%p] %c %m %a %u@%d line:%l '

then the pgbadger command to parse the log file and produce the results may look like:

./pgbadger --prefix='%r [%p] %c %m %a %u@%d line:%l ' -Z +2 -o pgBadger_$today.html $yesterdayfile.log && rm -f $yesterdayfile.log

pgBadger provides reports for:

  • Overview stats (mostly SQL traffic)
  • Connections (per second, per database/user/host)
  • Sessions (number, session times, per database/user/host/application)
  • Checkpoints (buffers, wal files, activity)
  • Temp files usage
  • Vacuum/Analyze activity (per table, tuples/pages removed)
  • Locks
  • Queries (by type/database/user/host/application, duration by user)
  • Top (Queries: slowest, time consuming, more frequent, normalized slowest)
  • Events (Errors, Warnings, Fatals,etc)

The screen showing the sessions looks like:

As we can conclude, the average PostgreSQL installation has to integrate and take care of many tools in order to have a modern reliable and fast infrastructure and this is fairly complex to achieve, unless there are large teams involved in postgresql and system administration. A fine suite that does all of the above and more is ClusterControl.

ClusterControl Release 1.6.2: New Backup Management and Security Features for MySQL & PostgreSQL

$
0
0

We are excited to announce the 1.6.2 release of ClusterControl - the all-inclusive database management system that lets you easily automate and manage highly available open source databases in any environment: on-premise or in the cloud.

ClusterControl 1.6.2 introduces new exciting Backup Management as well as Security & Compliance features for MySQL & PostgreSQL, support for MongoDB v 3.6 … and more!

Release Highlights

Backup Management

  • Continuous Archiving and Point-in-Time Recovery (PITR) for PostgreSQL
  • Rebuild a node from a backup with MySQL Galera clusters to avoid SST

Security & Compliance

  • New, consolidated Security section

Additional Highlights

  • Support for MongoDB v 3.6

View the ClusterControl ChangeLog for all the details!

ClusterControl
Single Console for Your Entire Database Infrastructure
Find out what else is new in ClusterControl

View Release Details and Resources

Release Details

Backup Management

One of the issues with MySQL and PostgreSQL is that there aren’t really any out-of-the-box tools for users to simply (in the GUI) pick up restore-time: certain operations need to be performed to do that, such as finding the full backup, restore it and apply any changes manually that happened after the backup was taken.

ClusterControl provides a single process to restore data to point in time with no extra actions needed.

With the same system, users can verify their backups (in the case of MySQL for instance, ClusterControl will do the installation, set up the cluster, do a restore and, if the backup is sound, make it valid - which, as one can imagine, represents a lot of steps).

With ClusterControl, users can not only go back to a point in time, but also pick up the exact transaction that happened; and, with surgical precision, restore their data before disaster really strikes.

New for PostgreSQL

Continuous Archiving and Point-in-Time Recovery (PITR) for PostgreSQL: ClusterControl automates that process now and enables continuous WAL archiving as well as a PITR with backups.

New for MySQL Galera Cluster

Rebuild a node from a backup with MySQL Galera clusters to avoid SST: ClusterControl reduces the time it takes to recover a node by avoiding streaming a full dataset over the network from another node.

Security & Compliance

The new Security section in ClusterControl lets users easily check which security features they have enabled (or disabled) for their clusters, thus simplifying the process of taking the relevant security measures for their setups.

Additional New Functionalities

View the ClusterControl ChangeLog for all the details!


Download ClusterControl today!

Happy Clustering!

New Webinar: An Introduction to Performance Monitoring for PostgreSQL

$
0
0

Join our webinar on August 21st during which we’ll dive into monitoring PostgreSQL for performance.

PostgreSQL offers many metrics through various status overviews and commands, but which ones really matter to you?

How do you trend and alert on them? What is the meaning behind the metrics? And what are some of the most common causes for performance problems in production?

To operate PostgreSQL efficiently, you need to have insight into database performance and make sure it is at optimal levels.

During this webinar, we’ll discuss this and more in ordinary, plain DBA language. We’ll also have a look at some of the tools available for PostgreSQL monitoring and trending; and we’ll show you how to leverage ClusterControl’s PostgreSQL metrics, dashboards, custom alerting and other features to track and optimize the performance of your system.

Date, Time & Registration

Europe/MEA/APAC

Tuesday, August 21st at 09:00 BST / 10:00 CEST (Germany, France, Sweden)

Register Now

North America/LatAm

Tuesday, August 21st at 09:00 Pacific Time (US) / 12:00 Eastern Time (US)

Register Now

Agenda

  • PostgreSQL architecture overview
  • Performance problems in production
    • Common causes
  • Key PostgreSQL metrics and their meaning
  • Tuning for performance
  • Performance monitoring tools
  • Impact of monitoring on performance
  • How to use ClusterControl to identify performance issues
    • Demo

Speaker

Sebastian Insausti has loved technology since his childhood, when he did his first computer course (Windows 3.11). And from that moment he was decided on what his profession would be. He has since built up experience with MySQL, PostgreSQL, HAProxy, WAF (ModSecurity), Linux (RedHat, CentOS, OL, Ubuntu server), Monitoring (Nagios), Networking and Virtualization (VMWare, Proxmox, Hyper-V, RHEV).

Prior to joining Severalnines, Sebastian worked as a consultant to state companies in security, database replication and high availability scenarios. He’s also a speaker and has given a few talks locally on InnoDB Cluster and MySQL Enterprise together with an Oracle team. Previous to that, he worked for a Mexican company as chief of sysadmin department as well as for a local ISP (Internet Service Provider), where he managed customers' servers and connectivity.

This webinar builds upon a related blog post by Sebastian: https://severalnines.com/blog/performance-cheat-sheet-postgresql.

We look forward to “seeing” you there!


Monitoring your Databases with ClusterControl

$
0
0

Observability is critical piece of the operations puzzle - you have to be able to tell the state of your system based on data. Ideally, this data will be available from a single location. Having multiple applications, each handling separate pieces of data, is a direct way to serious troubles. When the issues start, you have to be able to tell what is going on quickly rather than trying to analyze and merge reports from multiple sources.

ClusterControl, among other features, provides users with a one single point from which to track the health of your databases. In this blog post, we will show some of the observability features in ClusterControl.

Overview Tab

Overview section is a one place to track the state of one cluster, including all the cluster nodes as well as any load balancers.

It provides easy access to multiple pre-defined dashboards which show the most important information for the given type of cluster. ClusterControl supports different open source datastores, and different graphs are displayed based on the vendor. ClusterControl also gives an option to create your own, custom dashboards:

One key feature is that graphs are aggregated across all cluster nodes. This makes it easier to track the state of the whole cluster. If you want to check graphs from each of the nodes, you can easily do that:

By ticking “Show Servers”, all nodes in the cluster will be shown separately allowing you to drill down into each one of them.

Nodes Tab

If you would like to check a particular node in more details, you can do so from the “Nodes” tab.

Here you can find metrics related to given host - CPU, disk, network, memory. All the important bits of data which define how a given server behaves and how loaded it is.

Nodes tab also gives you an option to check the database metrics for a given node:

All of those graphs are customizable, you can easily add more of them:

Nodes tab also contains metrics related to nodes other than databases. For example, for ProxySQL, ClusterControl provides extensive list of graphs to track the state of the most important metrics.

Advisors

Trending data is not enough on its own. Sure, it is great for post mortem analysis. Or when working on capacity planning, historical data stored in a form of graphs will be of great use. But to have a full view of the cluster, you have to have some sort of alerting too. If something is happening right now, the user has to be alerted.

ClusterControl provides a list of pre-defined advisors that are intended to track the state of different metrics and state of your databases. When needed, an alert is created. As you can see on the screenshot above, it is not only about metrics. ClusterControl runs sanity checks for important settings, it also does some predictions. For example, regarding disk space utilization, it attempts to alert the user in case disk utilization increases too fast. Of course, alerts are sent not only through advisors. Events like node down or failed backup will also result in a notification.

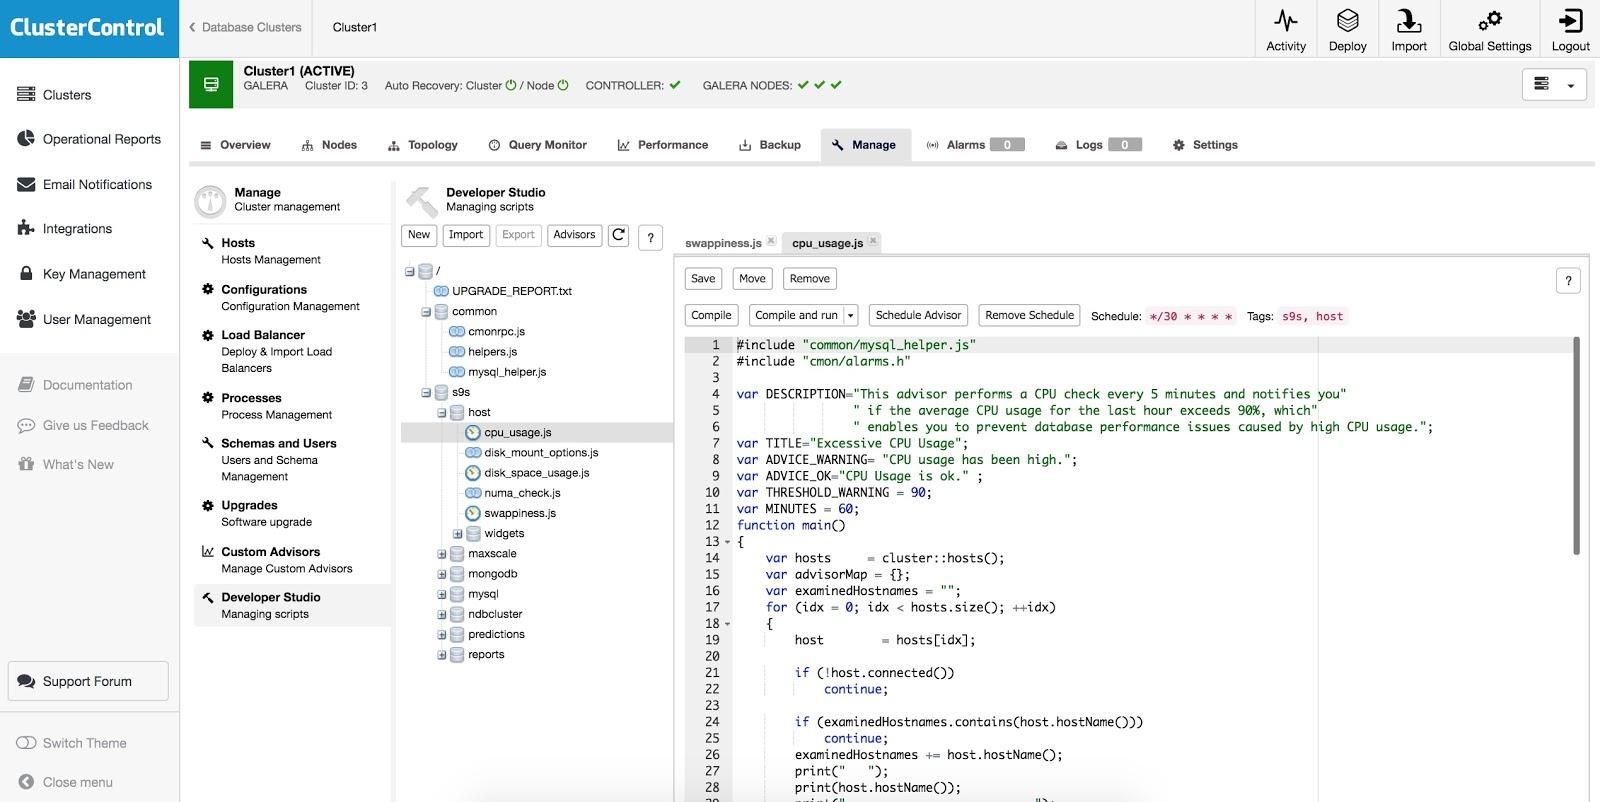
Worth to note that, advisors are written in a JavaScript-like language and can be edited using the Developer Studio within ClusterControl:

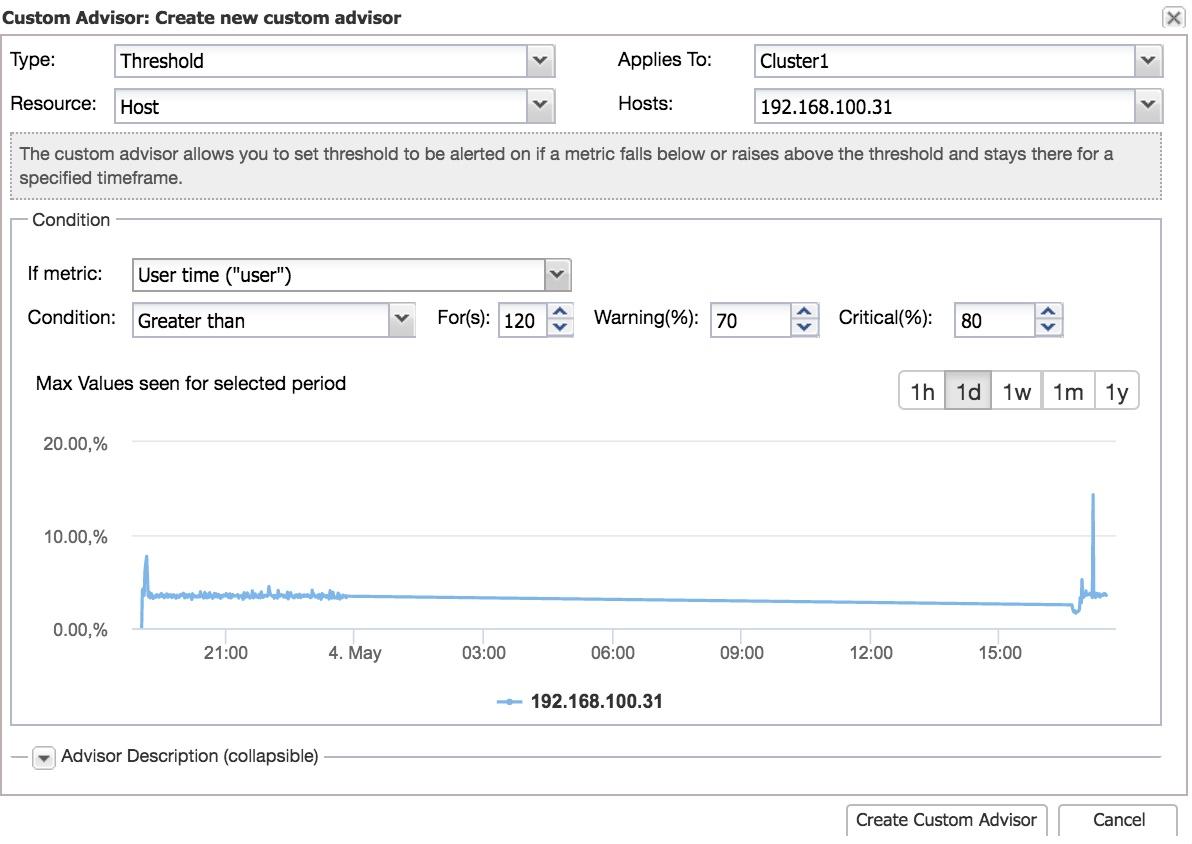
User can also create new advisors and schedule them to be executed by ClusterControl.

With this, users have the option to develop their own scripts which check for important bits specific to the environment. Such scripts can also leverage other ClusterControl functionality, for example, if you’d like to implement automated scaling based on the growth of some metric.

Live Webinar: An Introduction to Performance Monitoring for PostgreSQL - August 21st 2018

$
0
0

There’s a bit less than a week to go before I broadcast live with this webinar on monitoring PostgreSQL for performance.

My plan is to cover some of the main ins and outs of the PostgreSQL monitoring and performance world and I’m also planning to share some tips and tricks on how to use ClusterControl to monitor PostgreSQL for performance.

The webinar aims to address some of the following questions:

  • PostgreSQL offers many metrics through various status overviews and commands, but which ones really matter to us users?
  • How do we trend and alert on them?
  • What is the meaning behind the metrics?
  • And what are some of the most common causes for performance problems in production?

To operate PostgreSQL efficiently, you need to have insight into database performance and make sure it is at optimal levels.

I’ll discuss this and more in ordinary, plain DBA language.

We’ll have a look at some of the tools available for PostgreSQL monitoring and trending; and I’ll show you how to leverage ClusterControl’s PostgreSQL metrics, dashboards, custom alerting and other features to track and optimize the performance of your system.

Date, Time & Registration

Europe/MEA/APAC

Tuesday, August 21st at 09:00 BST / 10:00 CEST (Germany, France, Sweden)

Register Now

North America/LatAm

Tuesday, August 21st at 09:00 Pacific Time (US) / 12:00 Eastern Time (US)

Register Now

Agenda

  • PostgreSQL architecture overview
  • Performance problems in production
    • Common causes
  • Key PostgreSQL metrics and their meaning
  • Tuning for performance
  • Performance monitoring tools
  • Impact of monitoring on performance
  • How to use ClusterControl to identify performance issues
    • Demo

Speaker

Sebastian Insausti has loved technology since his childhood, when he did his first computer course (Windows 3.11). And from that moment he was decided on what his profession would be. He has since built up experience with MySQL, PostgreSQL, HAProxy, WAF (ModSecurity), Linux (RedHat, CentOS, OL, Ubuntu server), Monitoring (Nagios), Networking and Virtualization (VMWare, Proxmox, Hyper-V, RHEV).

Prior to joining Severalnines, Sebastian worked as a consultant to state companies in security, database replication and high availability scenarios. He’s also a speaker and has given a few talks locally on InnoDB Cluster and MySQL Enterprise together with an Oracle team. Previous to that, he worked for a Mexican company as chief of sysadmin department as well as for a local ISP (Internet Service Provider), where he managed customers' servers and connectivity.

This webinar builds upon a related blog post by Sebastian: https://severalnines.com/blog/performance-cheat-sheet-postgresql.

We look forward to “seeing” you there!

Getting the Most Out of ClusterControl Community Edition

$
0
0

ClusterControl is an agentless management and monitoring system that helps to deploy, manage, monitor and scale our databases from a friendly interface. It allows us to perform, in a few seconds, database management tasks that would take us hours of work and research to do manually.

It can be easily installed in a dedicated VM or physical host using an installation script or we can consult the official documentation available on the Severalnines web site for more options.

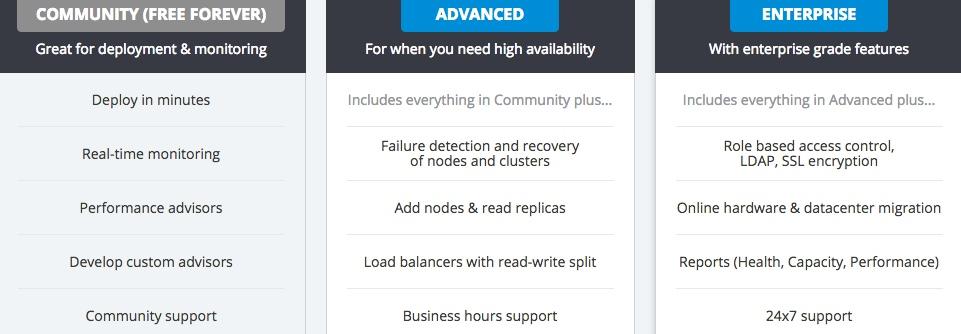
ClusterControl comes in three versions, Community, Advanced and Enterprise.

The main features of each are the following:

ClusterControl Versions Features

To test the system, we provide a trial period of 30 days. During that period, we can make use of all the functionalities that available in the product, such as importing our existing databases or clusters, adding load balancers, scaling with additional nodes, and automatic recovery from failures, among others.

ClusterControl has support for the top open source database technologies MySQL, MariaDB, MongoDB, PostgreSQL, Galera Cluster and more. It supports nearly two dozen database versions, that one can try on premises or in the cloud. This enables you to test which database technology, or which high availability configuration, is the most suitable for your application.

Next, let’s have a detailed look of what we can do with the Community version (after the trial period), at no cost and without time limit.

Deploy

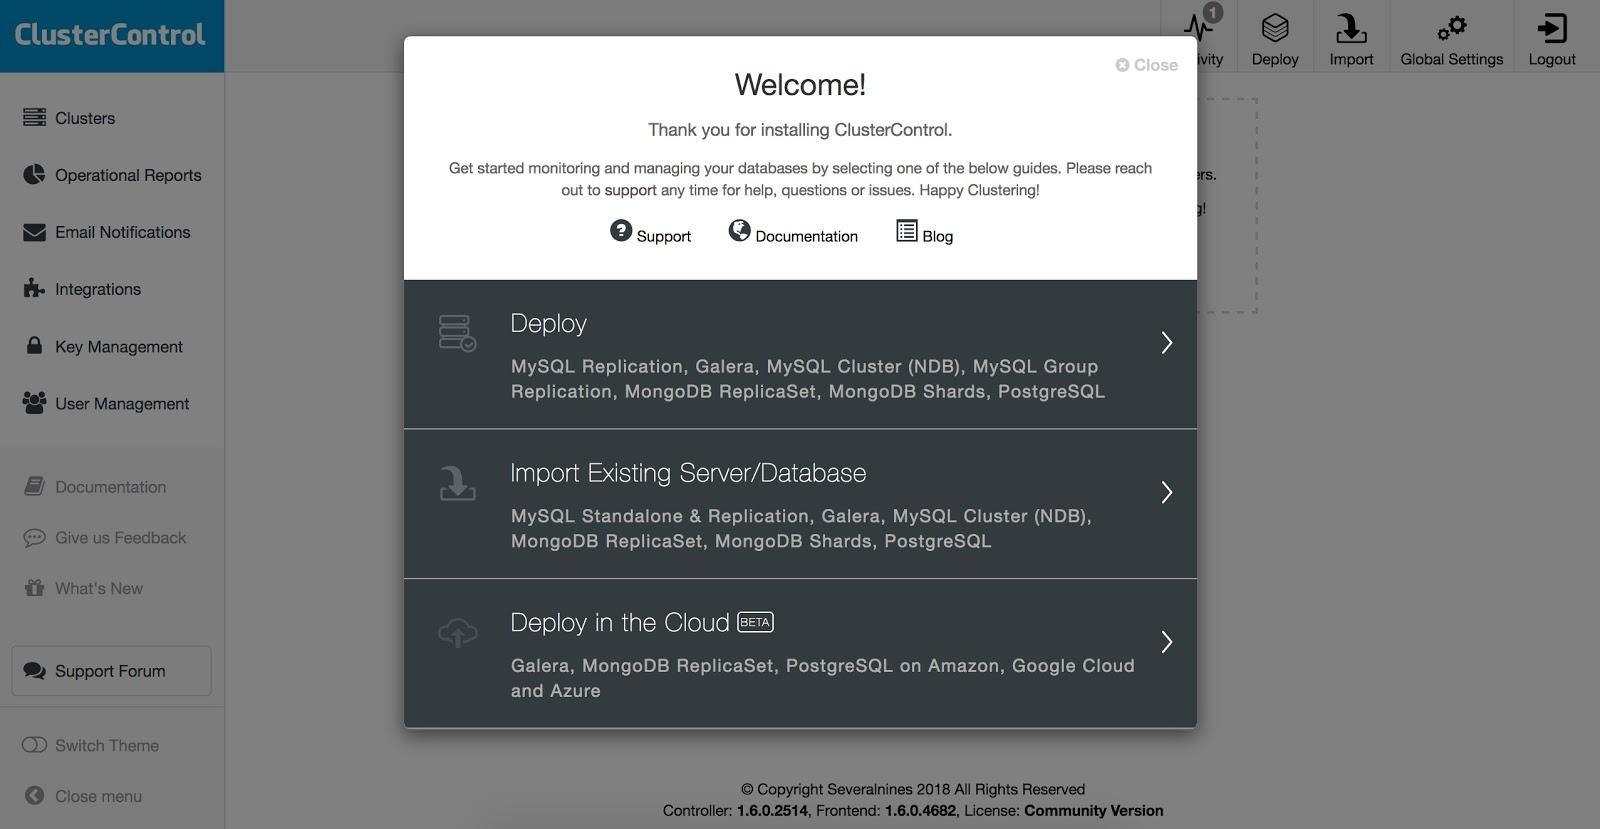
ClusterControl allows you to deploy a number of high availability configurations in the Community Edition. To perform a deployment, simply select the option "Deploy" and follow the instructions that appear.

ClusterControl Deploy Image 1

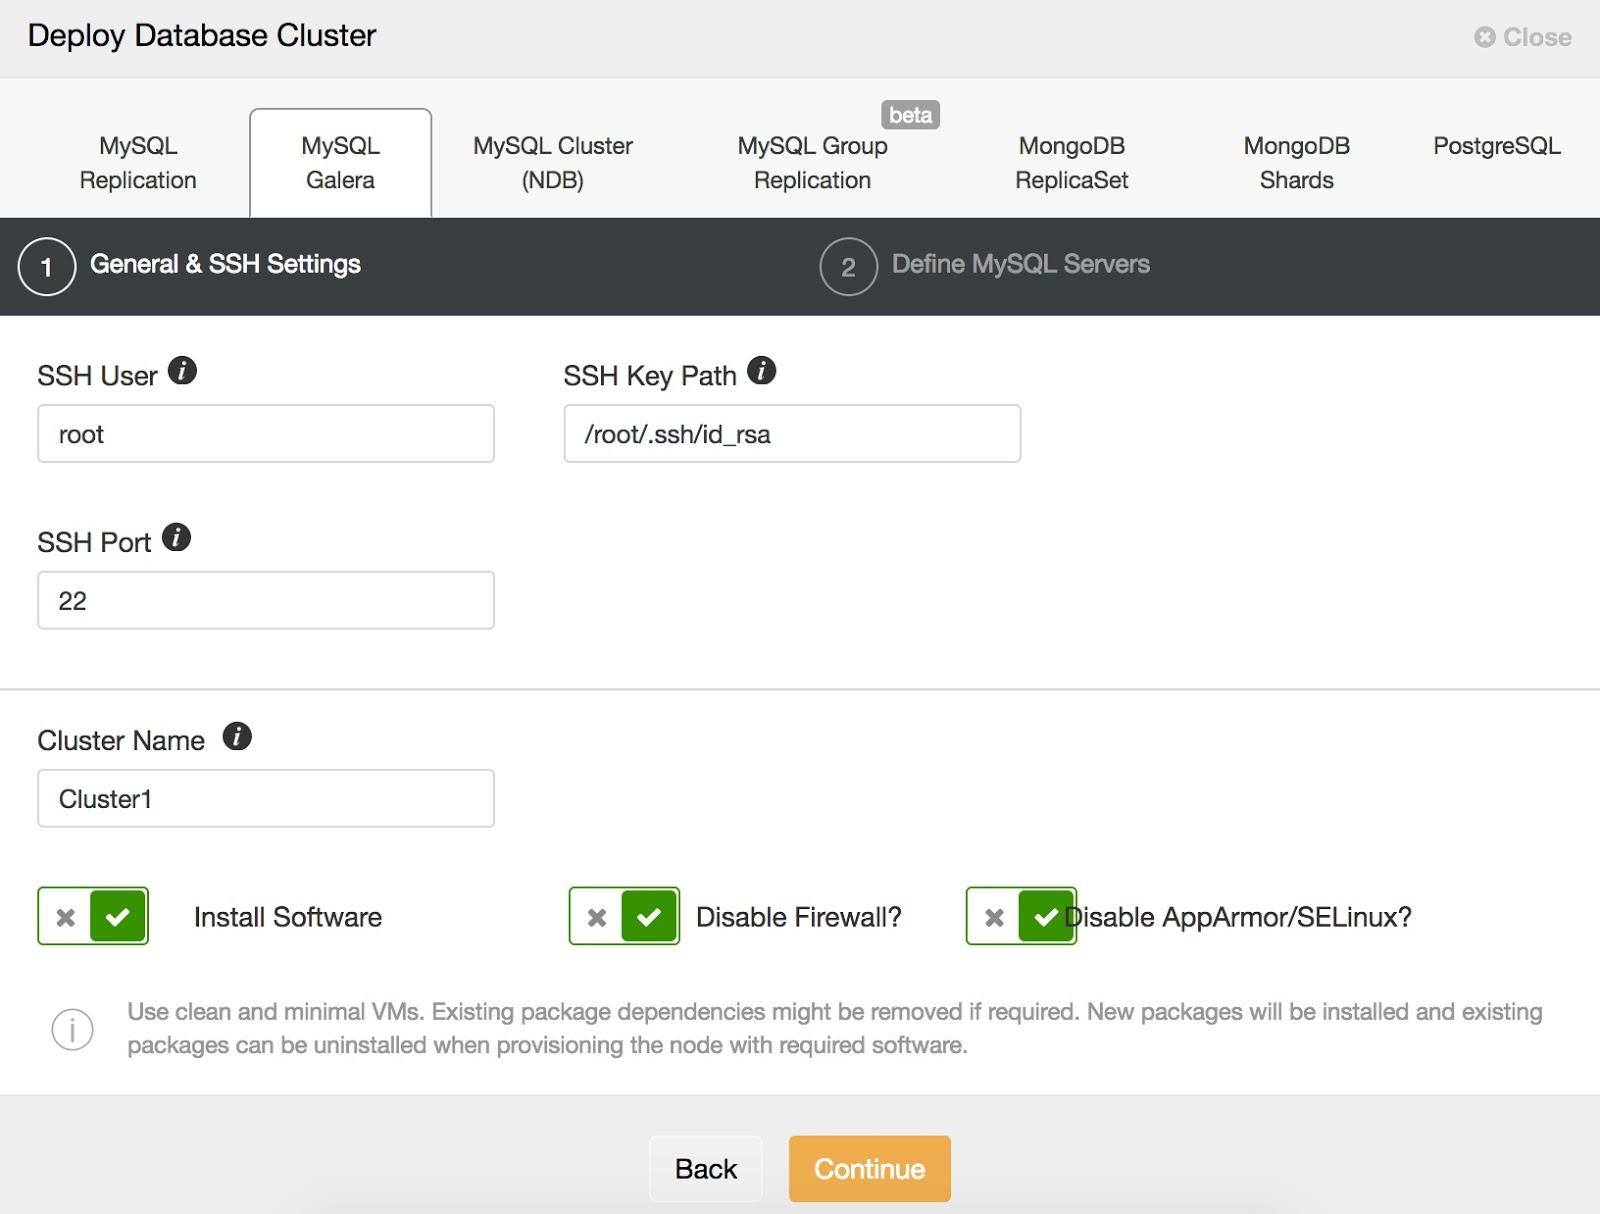
When selecting Deploy, we must specify User, Key or Password and port to connect by SSH to our servers. We also need the name for our new cluster and if we want ClusterControl to install the corresponding software and configurations for us.

ClusterControl Deploy Image 2

For our example we will create a Galera Cluster with 3 nodes.

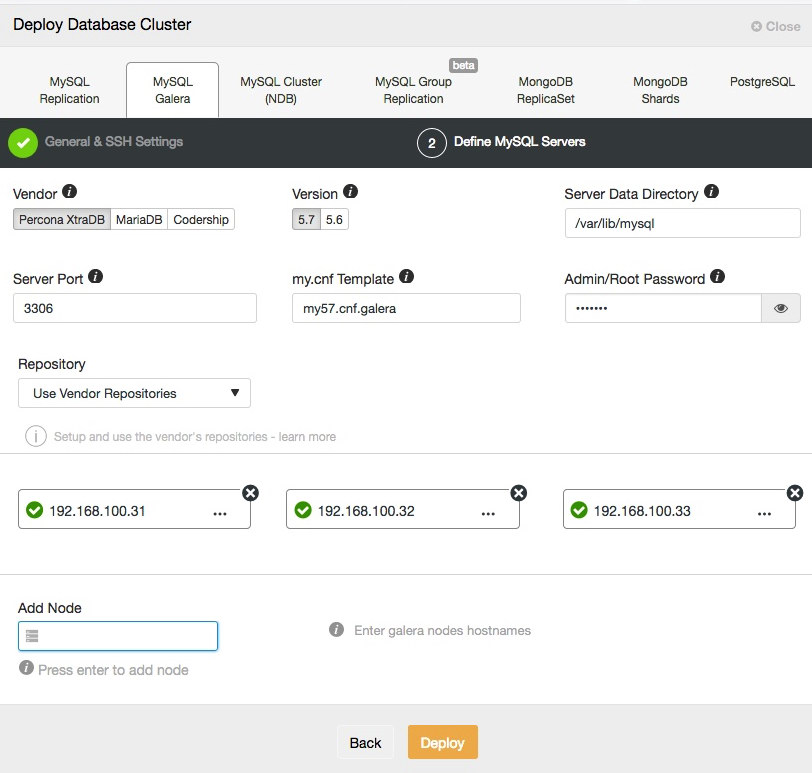
ClusterControl Deploy Image 3

After configuring the SSH access information, we must enter the data of our database, such as Vendor, Version, data dir and access to the database.

We can also specify which repository to use and add our servers to the cluster that we are going to create.

When adding our servers, we can enter IP or hostname. For the latter, we must have a DNS server or have added our PostgreSQL servers to the local resolution file (/etc/hosts) of our ClusterControl, so it can resolve the corresponding name that you want to add.

We can monitor the status of the creation of our new cluster from the ClusterControl activity monitor.

ClusterControl Deploy Image 4

Once the task is finished, we can see our cluster in the main ClusterControl screen. Note that it is also possible to use the ClusterControl CLI for those who prefer command line.

ClusterControl
Single Console for Your Entire Database Infrastructure
Find out what else is new in ClusterControl

Monitoring

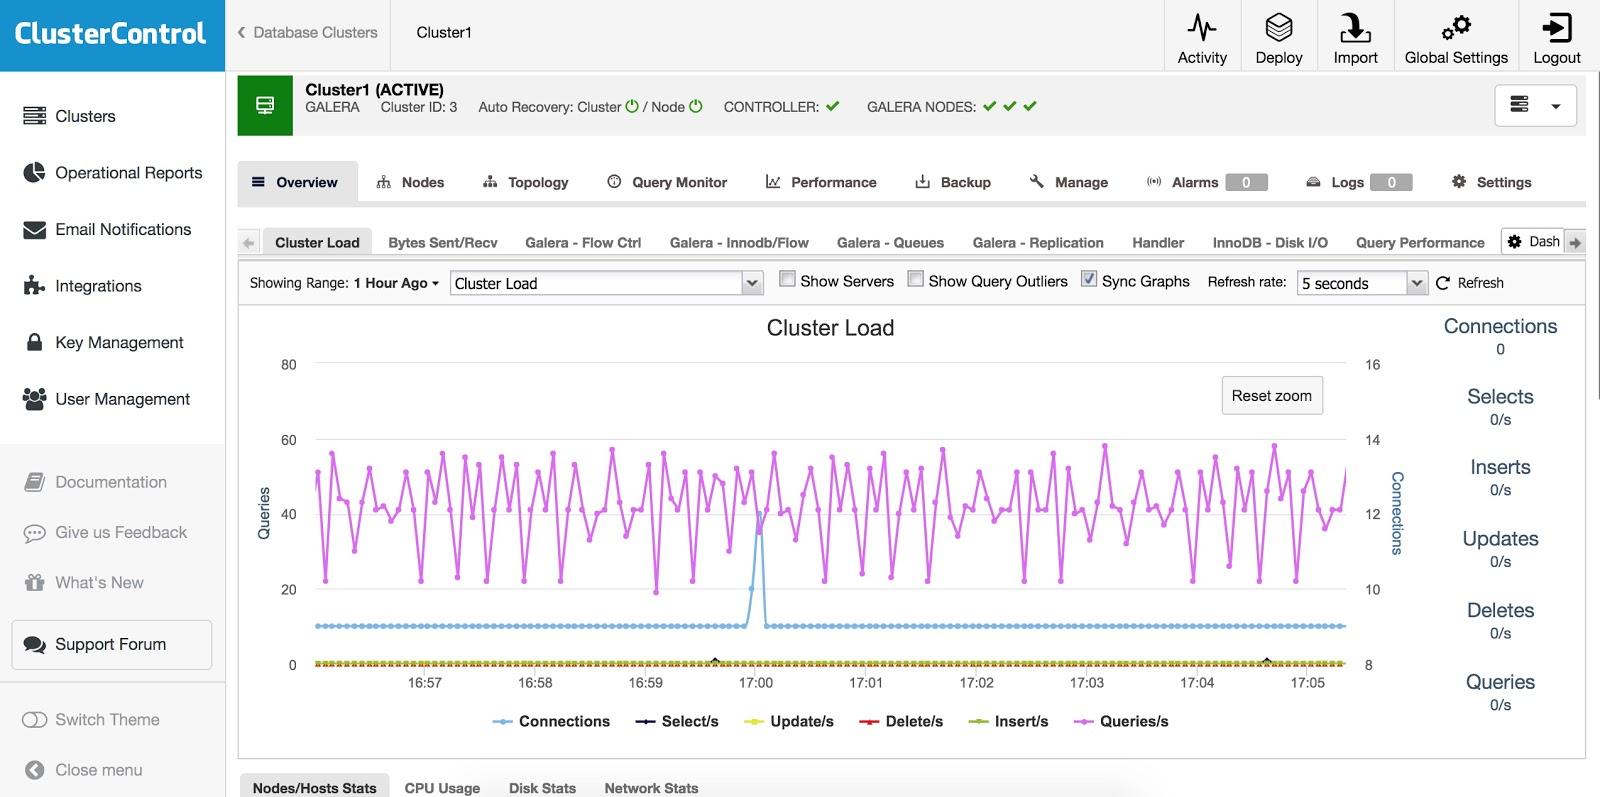
ClusterControl Community Edition allows us to monitor our servers in real time. It provides us from a high-level, multi-datacenter view to a deep-dive node view. This means that we can see a unified view of all of our deployments across data centers, as well as the possibility to drill down into individual nodes as required. We will have graphs with basic host statistics, such as CPU, Network, Disk, RAM, IOPS, as well as database metrics.

If you go to the Cluster, you can check an overview of it.

ClusterControl Monitoring Overview

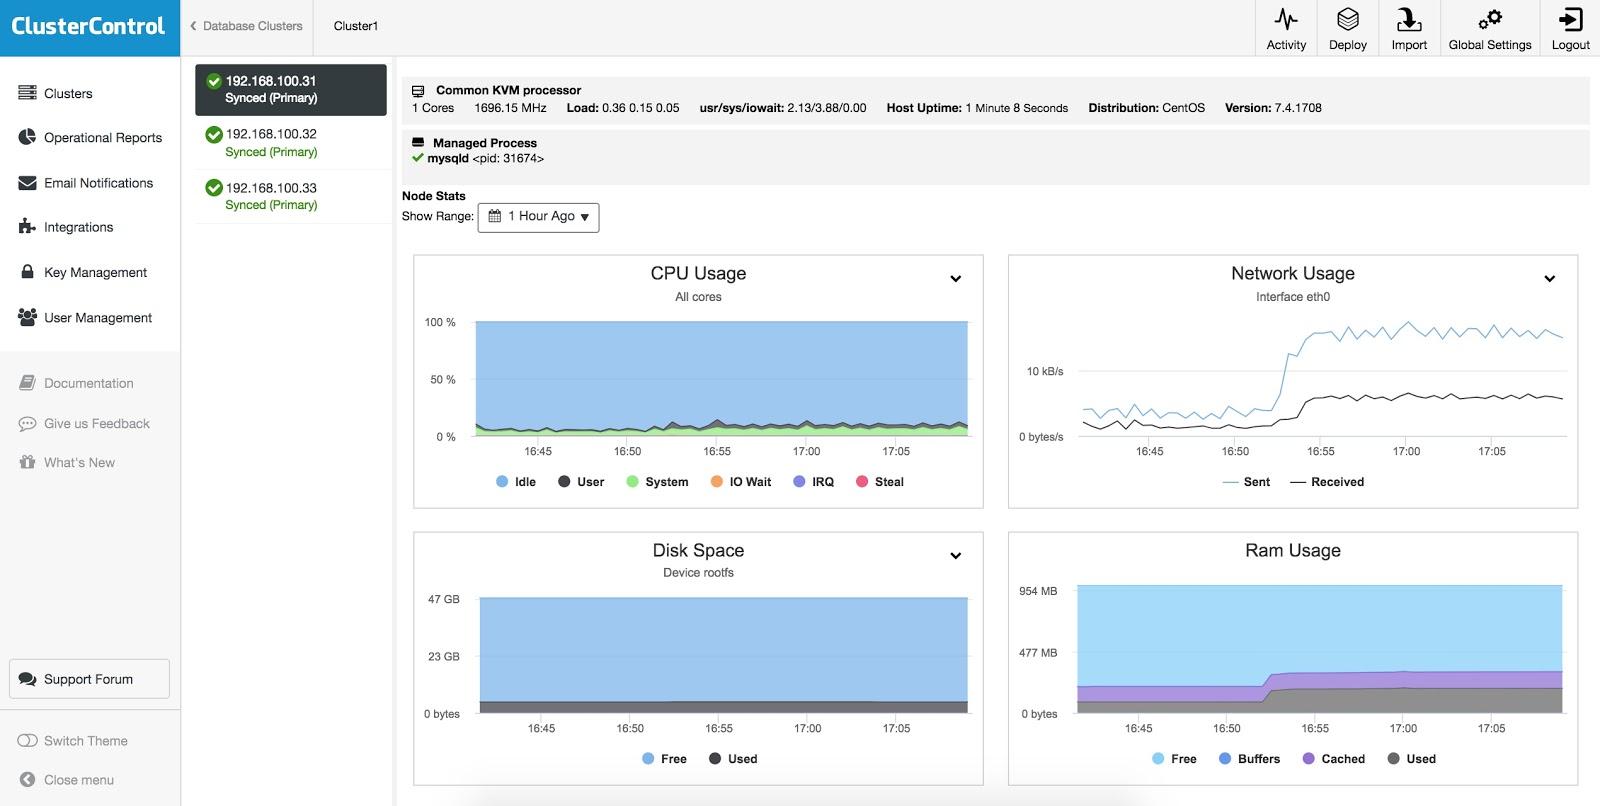
If you go to Cluster -> Nodes, you can check the status, graphs, performance, or variables of them.

ClusterControl Monitoring Nodes

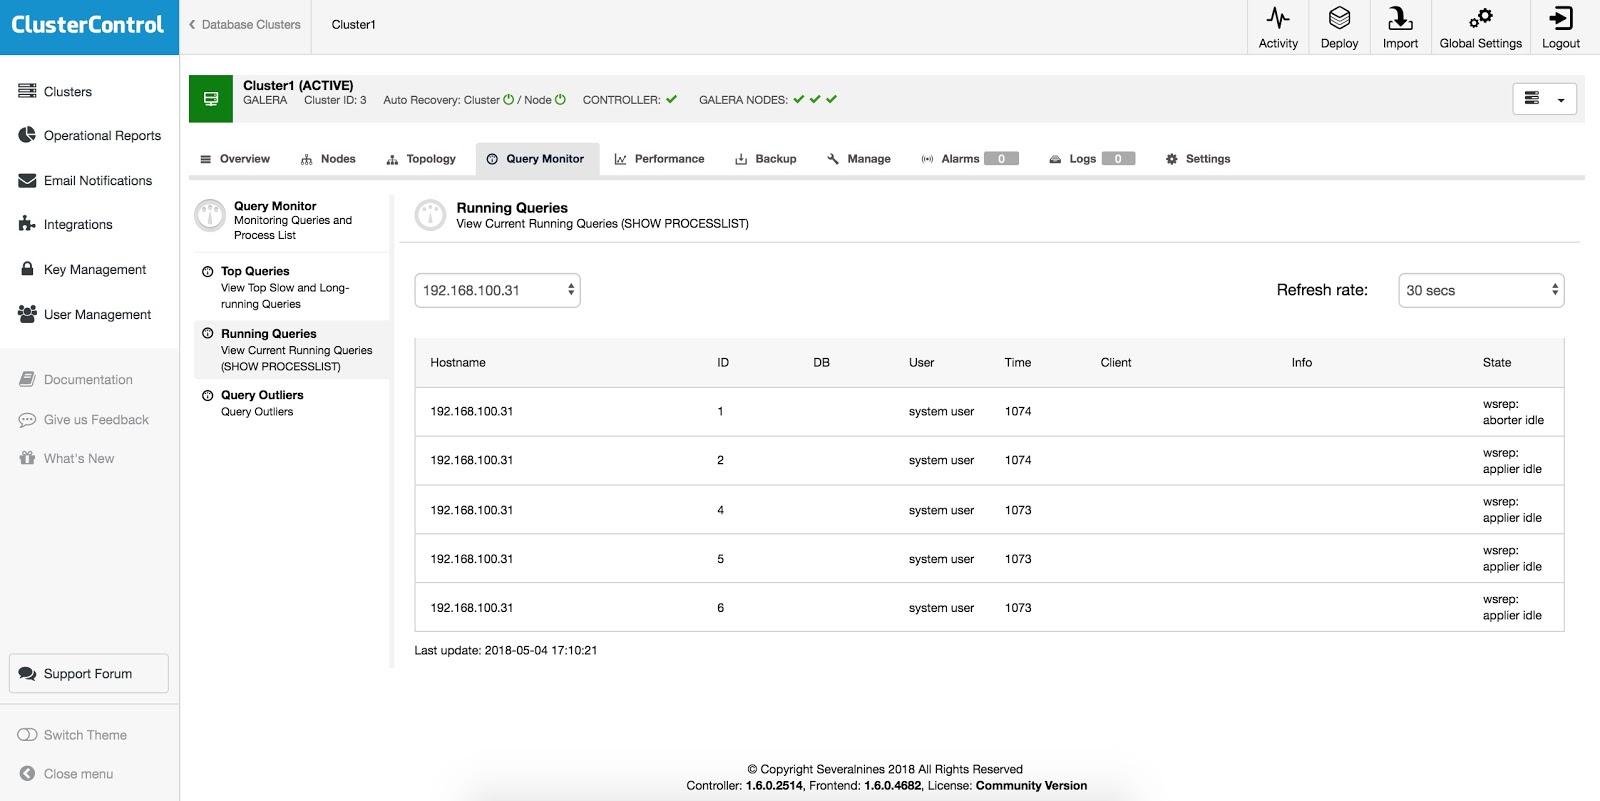
You can check your database queries from the Query Monitor in Cluster -> Query Monitor.

ClusterControl Monitoring Queries

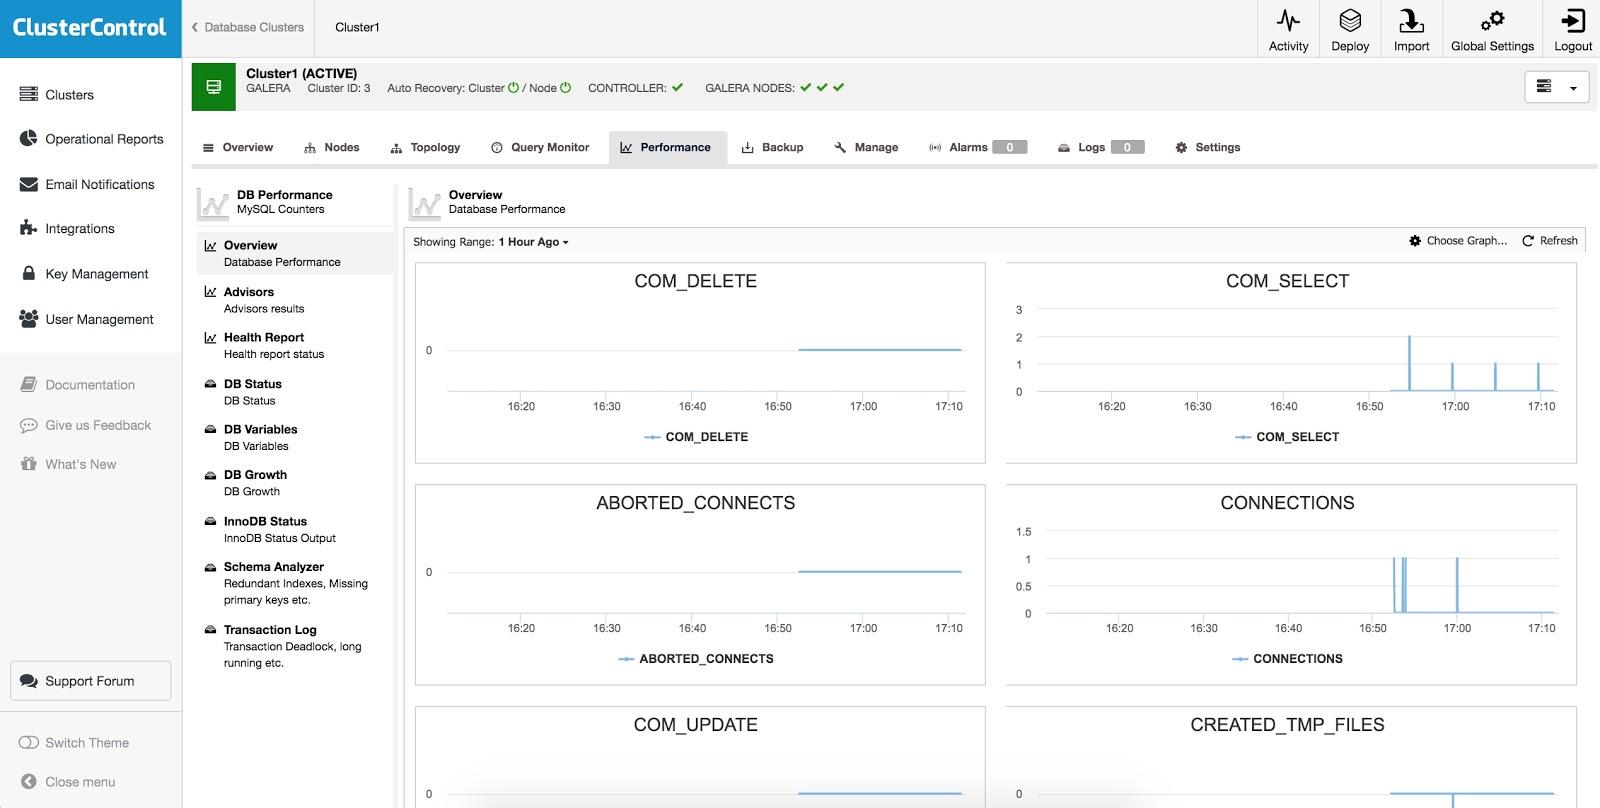
Also, you have information about your database performance in Cluster -> Performance.

ClusterControl Monitoring Performance

Using these functionalities we can identify slow or incorrect queries very easily, optimize them, and improve the performance of our systems.

In this way, we can have our cluster fully monitored, without adding additional tools or utilities ,and for free.

Performance Advisors

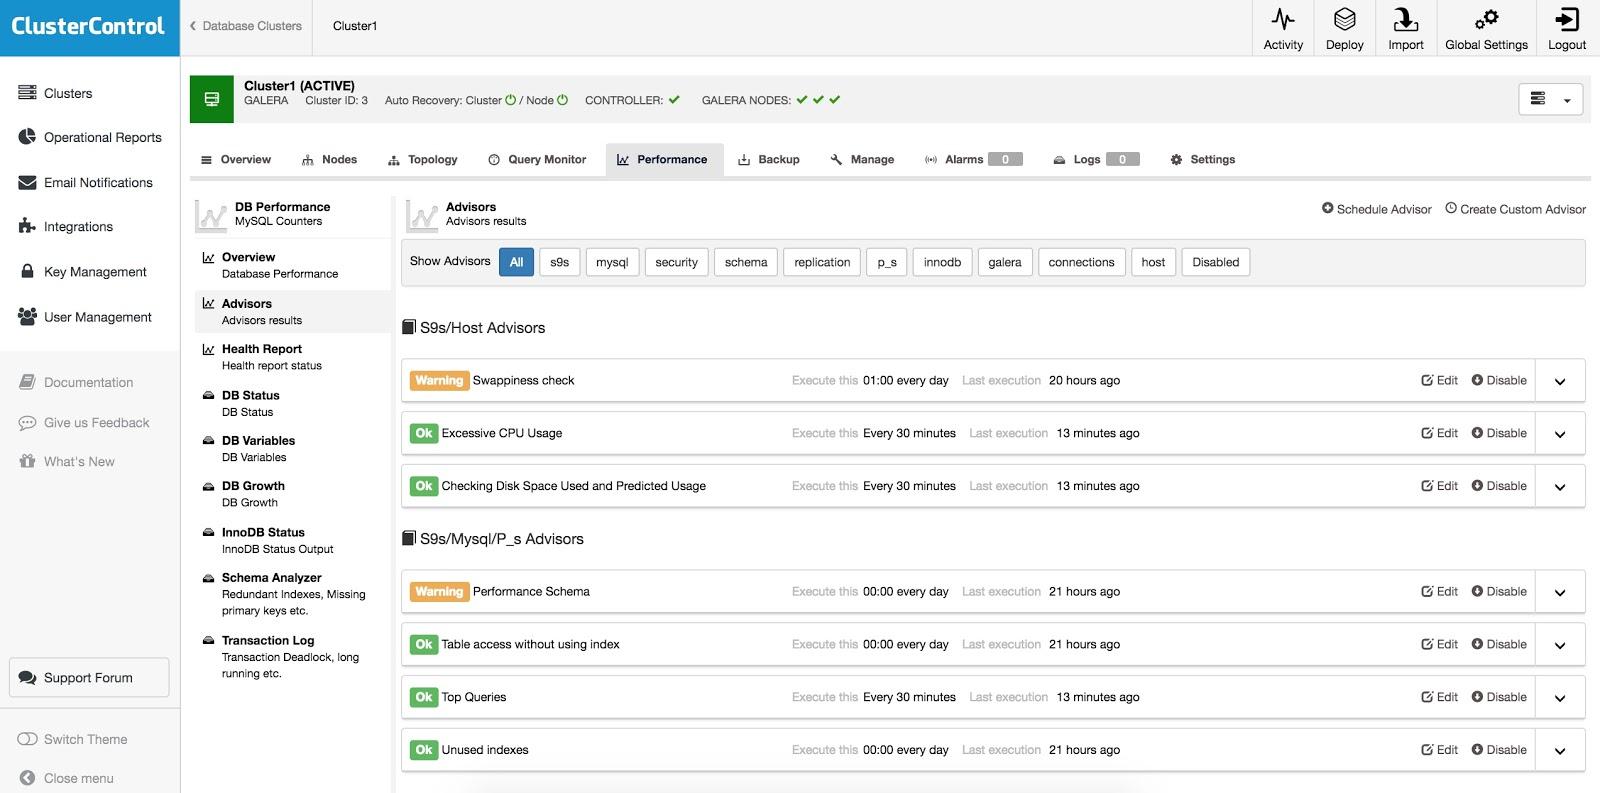
We have a number of predefined advisors, starting from simple ones like CPU usage, disk space, top queries, to more advanced ones detecting redundant indexes, queries not using indexes that cause table scans, and so on.

We can see the predefined advisors in Cluster -> Performance -> Advisors.

Advisors
Advisors

Here we can see details, disable, enable or edit our Advisors.

Also we can easily configure our own advisors. We can check our custom advisors in Cluster -> Manage -> Custom Advisors.

Custom Advisors
Custom Advisors

Develop custom advisors

We can also create our own advisors using the Developer Studio tool, available in Cluster -> Manage -> Developer Studio.

Developer Studio
Developer Studio

With this tool, you can create your own custom database advisors to monitor specific items to let you know if something goes wrong.

Topology View

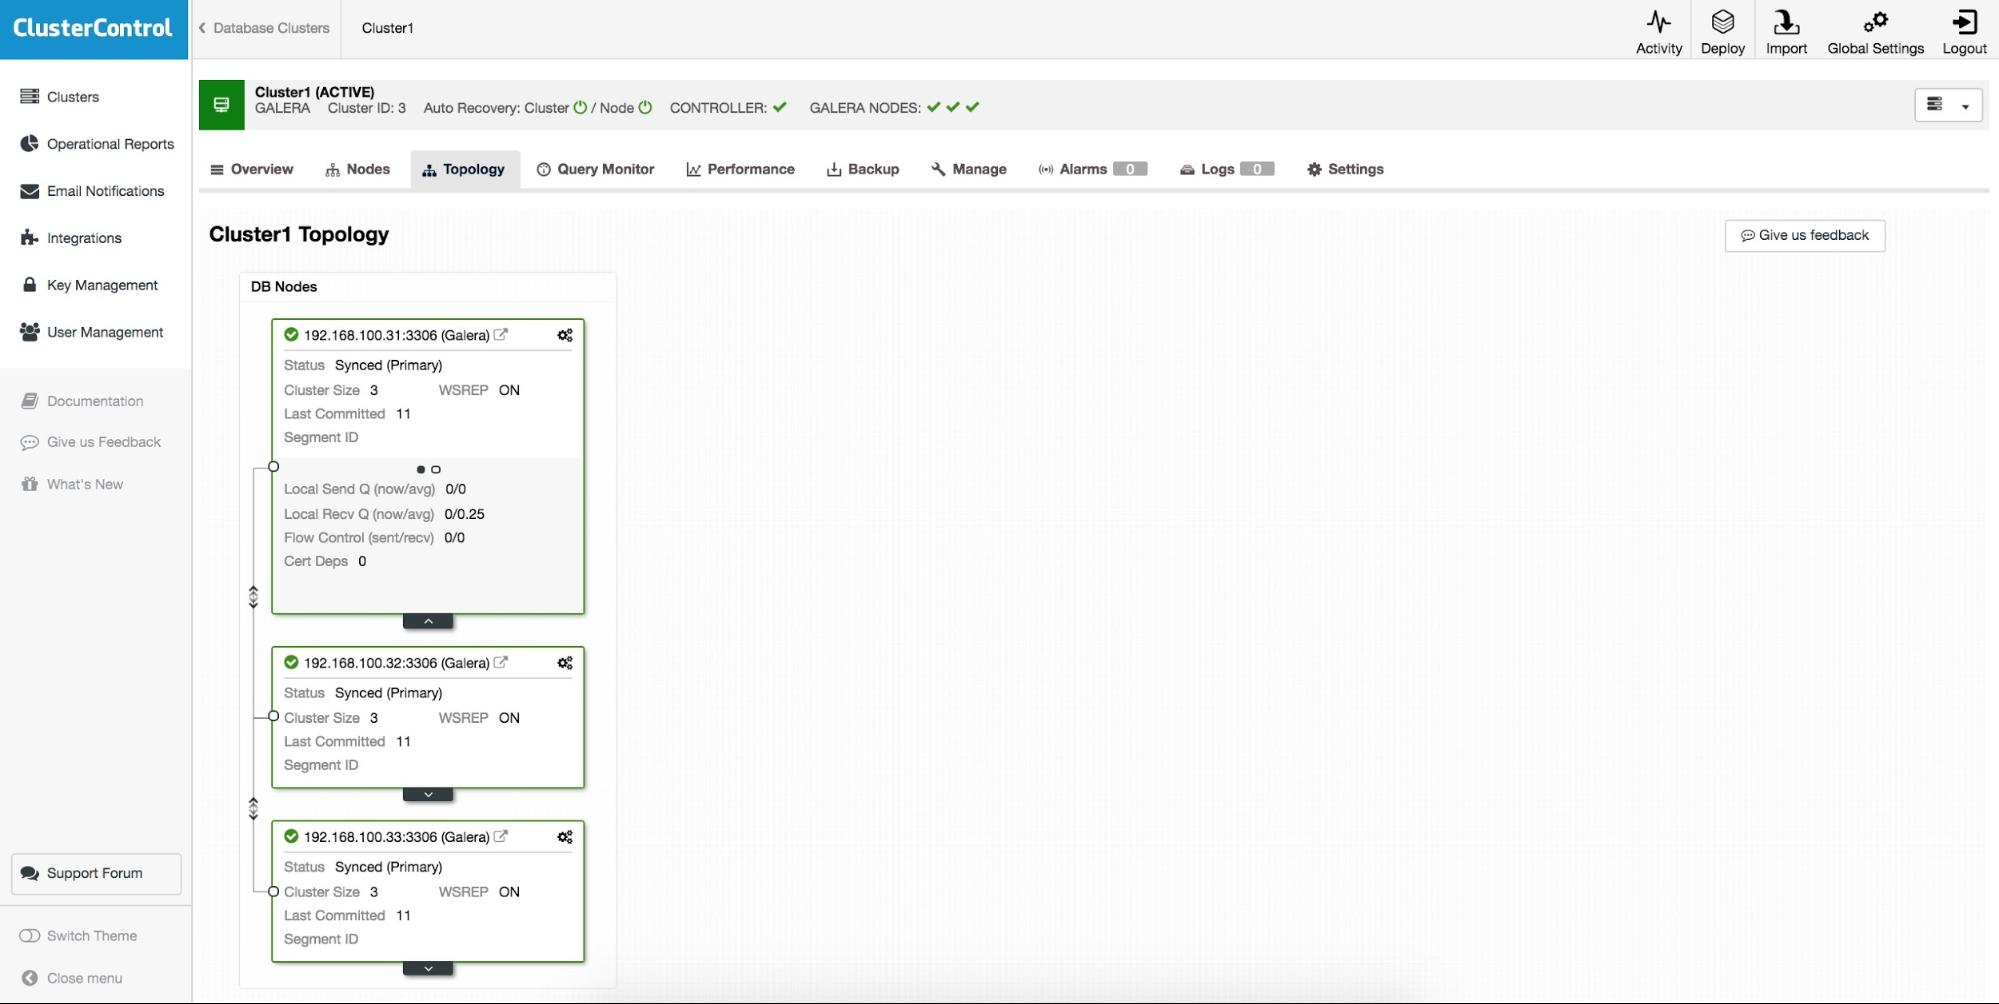
To use this feature, you need to go to Cluster -> Topology.

From the Topology view, you can get a visual representation of your cluster, quickly see how they are organized and the health status of each node. This is particularly useful when having e.g., replication setups with multiple masters. You can also detect problems very easily, as each object presents a quick summary of its status.

ClusterControl Topology View

You can also check details about replication and operative system from each node.

Community Support

Finally, for any question or problem that comes our way, we have community support available, where both the Severalnines technicians and the community itself can help us solve our problems.

We also have a number of free resources available, such as blogs, webinars, documentation, or tips and tricks for ClusterControl on our website.

Conclusion

As we saw in this blog, ClusterControl Community Edition gives us the possibility to deploy database clusters and get a real-time view of database status and queries. This can help save time and work in our daily tasks, and is a great way to get started. Do give it a try and let us know what you think. There are other useful features in the commercial edition, such as security, backups, automatic recovery, load balancers and more, that can be activated by upgrading our license.

How to Monitor Multiple MySQL Instances Running on the Same Machine - ClusterControl Tips & Tricks

$
0
0

Requires ClusterControl 1.6 or later. Applies to MySQL based instances/clusters.

On some occasions, you might want to run multiple instances of MySQL on a single machine. You might want to give different users access to their own MySQL servers that they manage themselves, or you might want to test a new MySQL release while keeping an existing production setup undisturbed.

It is possible to use a different MySQL server binary per instance, or use the same binary for multiple instances (or a combination of the two approaches). For example, you might run a server from MySQL 5.6 and one from MySQL 5.7, to see how the different versions handle a certain workload. Or you might run multiple instances of the latest MySQL version, each managing a different set of databases.

Whether or not you use distinct server binaries, each instance that you run must be configured with unique values for several operating parameters. This eliminates the potential for conflict between instances. You can use MySQL Sandbox to create multiple MySQL instances. Or you can use mysqld_multi available in MySQL to start or stop any number of separate mysqld processes running on different TCP/IP ports and UNIX sockets.

In this blog post, we’ll show you how to configure ClusterControl to monitor multiple MySQL instances running on one host.

ClusterControl Limitation

At the time of writing, ClusterControl does not support monitoring of multiple instances on one host per cluster/server group. It assumes the following best practices:

  • Only one MySQL instance per host (physical server or virtual machine).
  • MySQL data redundancy should be configured on N+1 server.
  • All MySQL instances are running with uniform configuration across the cluster/server group, e.g., listening port, error log, datadir, basedir, socket are identical.

With regards to the points mentioned above, ClusterControl assumes that in a cluster/server group:

  • MySQL instances are configured uniformly across a cluster; same port, the same location of logs, base/data directory and other critical configurations.
  • It monitors, manages and deploys only one MySQL instance per host.
  • MySQL client must be installed on the host and available on the executable path for the corresponding OS user.
  • The MySQL is bound to an IP address reachable by ClusterControl node.
  • It keeps monitoring the host statistics e.g CPU/RAM/disk/network for each MySQL instance individually. In an environment with multiple instances per host, you should expect redundant host statistics since it monitors the same host multiple times.

With the above assumptions, the following ClusterControl features do not work for a host with multiple instances:

Backup - Percona Xtrabackup does not support multiple instances per host and mysqldump executed by ClusterControl only connects to the default socket.

Process management - ClusterControl uses the standard ‘pgrep -f mysqld_safe’ to check if MySQL is running on that host. With multiple MySQL instances, this is a false positive approach. As such, automatic recovery for node/cluster won’t work.

Configuration management - ClusterControl provisions the standard MySQL configuration directory. It usually resides under /etc/ and /etc/mysql.

Workaround

Monitoring multiple MySQL instances on a machine is still possible with ClusterControl with a simple workaround. Each MySQL instance must be treated as a single entity per server group.

In this example, we have 3 MySQL instances on a single host created with MySQL Sandbox:

ClusterControl monitoring multiple instances on same host

We created our MySQL instances using the following commands:

$ su - sandbox
$ make_multiple_sandbox mysql-5.7.23-linux-glibc2.12-x86_64.tar.gz

By default, MySQL Sandbox creates mysql instances that listen to 127.0.0.1. It is necessary to configure each node appropriately to make them listen to all available IP addresses. Here is the summary of our MySQL instances in the host:

[sandbox@master multi_msb_mysql-5_7_23]$ cat default_connection.json 
{
"node1":  
    {
        "host":     "master",
        "port":     "15024",
        "socket":   "/tmp/mysql_sandbox15024.sock",
        "username": "msandbox@127.%",
        "password": "msandbox"
    }
,
"node2":  
    {
        "host":     "master",
        "port":     "15025",
        "socket":   "/tmp/mysql_sandbox15025.sock",
        "username": "msandbox@127.%",
        "password": "msandbox"
    }
,
"node3":  
    {
        "host":     "master",
        "port":     "15026",
        "socket":   "/tmp/mysql_sandbox15026.sock",
        "username": "msandbox@127.%",
        "password": "msandbox"
    }
}

Next step is to modify the configuration of the newly created instances. Go to my.cnf for each of them and hash bind_address variable:

[sandbox@master multi_msb_mysql-5_7_23]$ ps -ef | grep mysqld_safe
sandbox  13086     1  0 08:58 pts/0    00:00:00 /bin/sh bin/mysqld_safe --defaults-file=/home/sandbox/sandboxes/multi_msb_mysql-5_7_23/node1/my.sandbox.cnf
sandbox  13805     1  0 08:58 pts/0    00:00:00 /bin/sh bin/mysqld_safe --defaults-file=/home/sandbox/sandboxes/multi_msb_mysql-5_7_23/node2/my.sandbox.cnf
sandbox  14065     1  0 08:58 pts/0    00:00:00 /bin/sh bin/mysqld_safe --defaults-file=/home/sandbox/sandboxes/multi_msb_mysql-5_7_23/node3/my.sandbox.cnf
[sandbox@master multi_msb_mysql-5_7_23]$ vi my.cnf
#bind_address = 127.0.0.1

Then install mysql on your master node and restart all instances using restart_all script.

[sandbox@master multi_msb_mysql-5_7_23]$ yum install mysql
[sandbox@master multi_msb_mysql-5_7_23]$ ./restart_all  
# executing "stop" on /home/sandbox/sandboxes/multi_msb_mysql-5_7_23
executing "stop" on node 1
executing "stop" on node 2
executing "stop" on node 3
# executing "start" on /home/sandbox/sandboxes/multi_msb_mysql-5_7_23
executing "start" on node 1
. sandbox server started
executing "start" on node 2
. sandbox server started
executing "start" on node 3
. sandbox server started

From ClusterControl, we need to perform ‘Import’ for each instance as we need to isolate them in a different group to make it work.

ClusterControl import existing server

For node1, enter the following information in ClusterControl > Import:

ClusterControl import existing server

Make sure to put proper ports (different for different instances) and host (same for all instances).

You can monitor the progress by clicking on the Activity/Jobs icon in the top menu.

ClusterControl import existing server details

You will see node1 in the UI once ClusterControl finishes the job. Repeat the same steps to add another two nodes with port 15025 and 15026. You should see something like the below once they are added:

ClusterControl Dashboard

There you go. We just added our existing MySQL instances into ClusterControl for monitoring. Happy monitoring!

PS.: To get started with ClusterControl, click here!

ClusterControl Developer Studio: Write your First Advisor

$
0
0

Did you ever wonder what triggers the advice in ClusterControl that your disk is filling up? Or the advice to create primary keys on InnoDB tables if they don’t exist? These advisors are mini scripts written in the ClusterControl Domain Specific Language (DSL) that is a Javascript-like language. These scripts can be written, compiled, saved, executed and scheduled in ClusterControl. That is what the ClusterControl Developer Studio blog series will be about.

Today we will cover the Developer Studio basics and show you how to create your very first advisor where we will pick two status variables and give advice about their outcome.

The advisors

Advisors are mini scripts that are executed by ClusterControl, either on-demand or after a schedule. They can be anything from simple configuration advice, warning on thresholds or more complex rules for predictions or cluster-wide automation tasks based on the state of your servers or databases. In general, advisors perform more detailed analysis, and produce more comprehensive recommendations than alerts.

The advisors are stored inside the ClusterControl database and you can add new or alter/modify existing advisors. We also have an advisor Github repository where you can share your advisors with us and other ClusterControl users.

The language used for the advisors is the so called ClusterControl DSL and is an easy to comprehend language. The semantics of the language can be best compared to Javascript with a couple of differences, where the most important differences are:

  • Semicolons are mandatory
  • Various numeric data types like integers and unsigned long long integers.
  • Arrays are two dimensional and single dimensional arrays are lists.

You can find the full list of differences in the ClusterControl DSL reference.

The Developer Studio interface

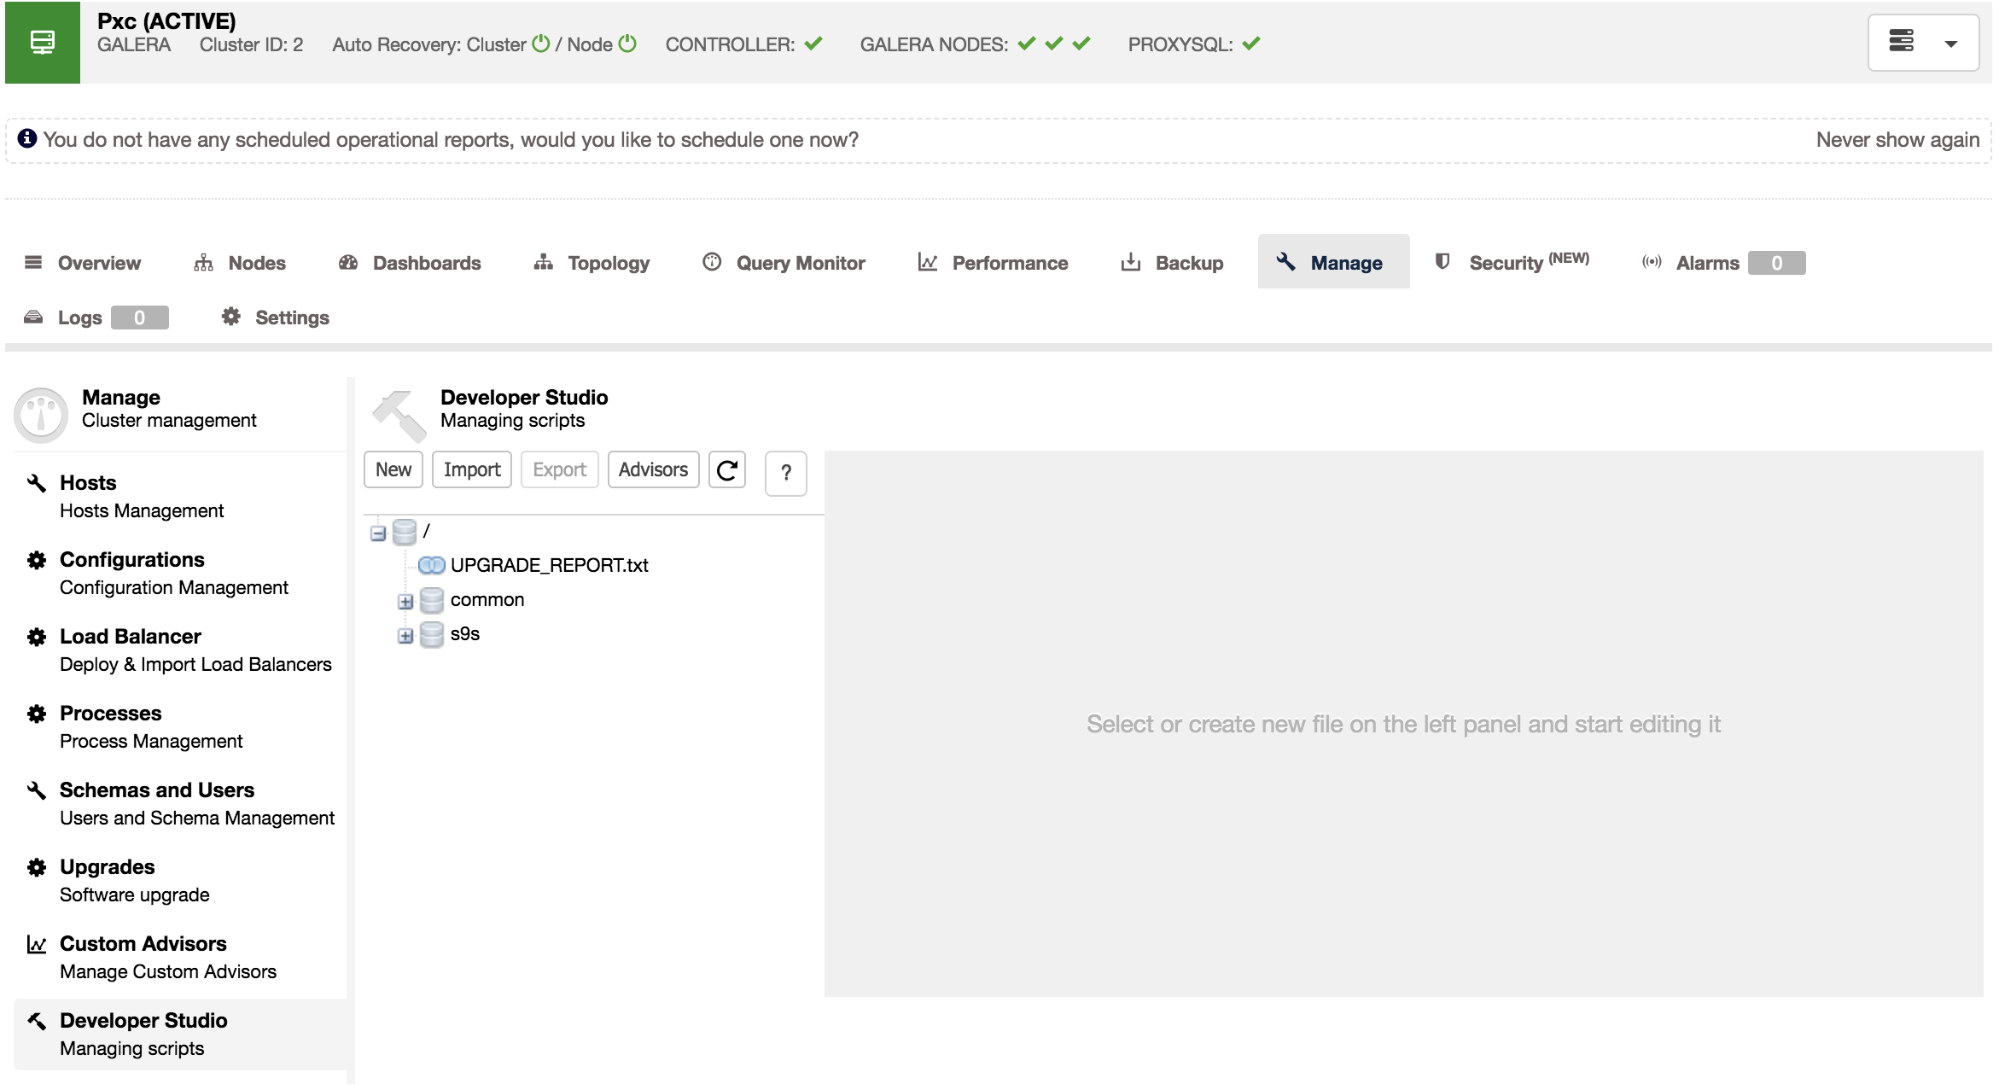
The Developer Studio interface can be found under Cluster > Manage > Developer Studio. This will open an interface like this:

Advisors

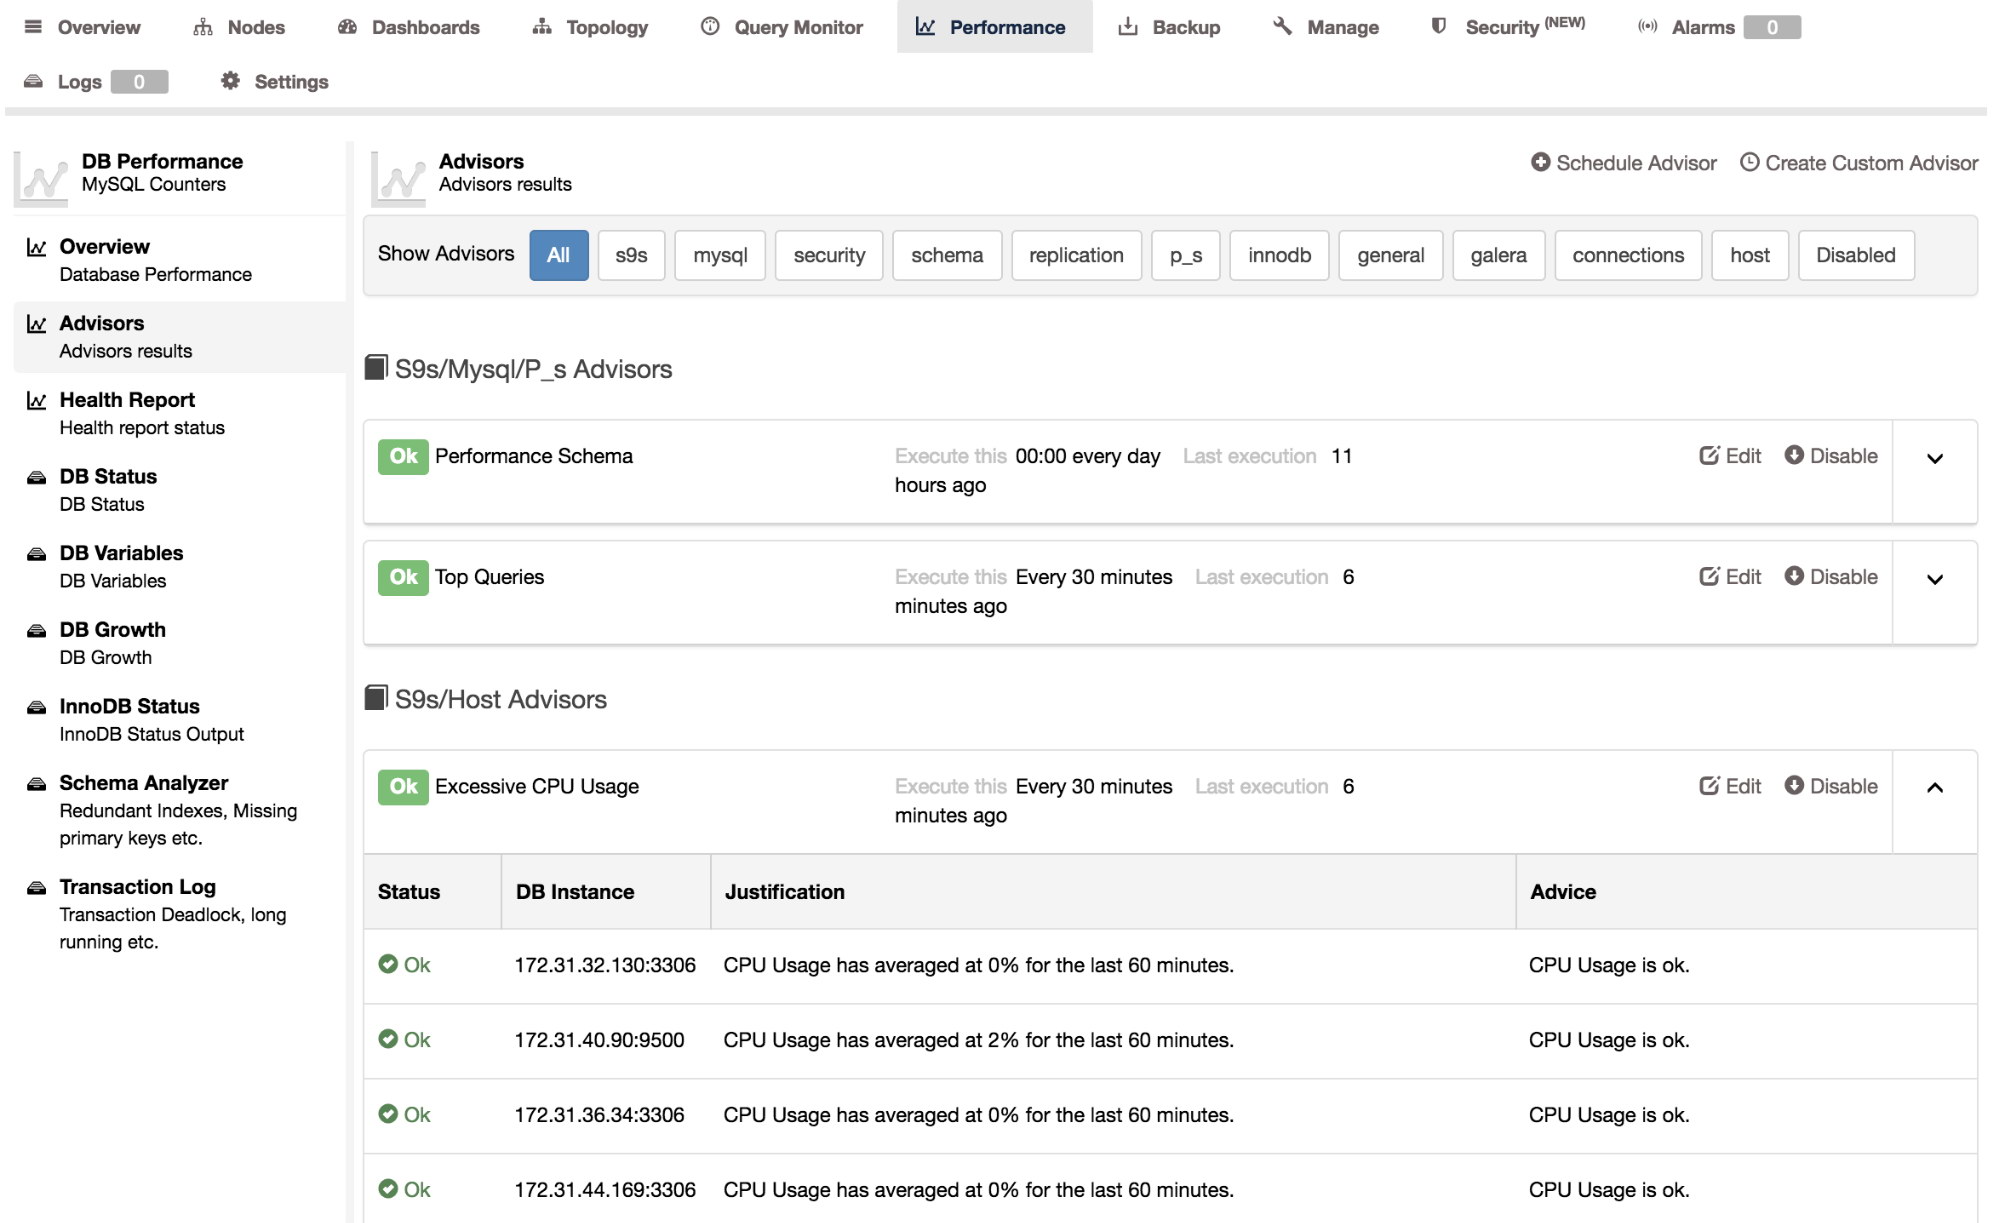
The advisors button will generate an overview of all advisors with their output since the last time they ran:

You can also see the schedule of the advisor in crontab format and the date/time since the last update. Some advisors are scheduled to run only once a day so their advice may no longer reflect the reality, for instance if you already resolved the issue you were warned about. You can manually re-run the advisor by selecting the advisor and run it. Go to the “compile and run” section to read how to do this.

Importing advisors

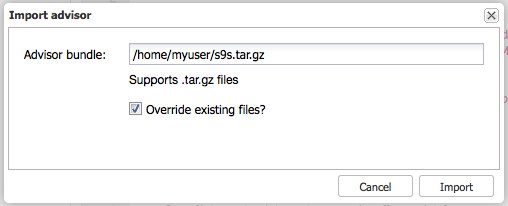
The Import button will allow you to import a tarball with new advisors in them. The tarball has to be created relative to the main path of the advisors, so if you wish to upload a new version of the MySQL query cache size script (s9s/mysql/query_cache/qc_size.js) you will have to make the tarball starting from the s9s directory.

Exporting advisors

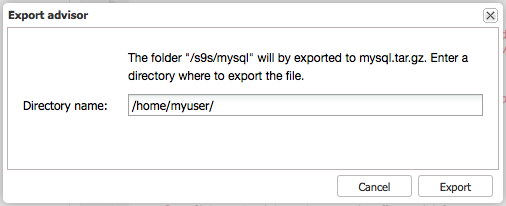
You can export the advisors or a part of them by selecting a node in the tree and pressing the Export button. This will create a tarball with the files in the full path of the structure presented. Suppose we wish to make a backup of the s9s/mysql advisors prior to making a change, we simply select the s9s/mysql node in the tree and press Export:

Note: make sure the s9s directory is present in /home/myuser/.

This will create a tarball called /home/myuser/s9s/mysql.tar.gz with an internal directory structure s9s/mysql/*

Creating a new advisor

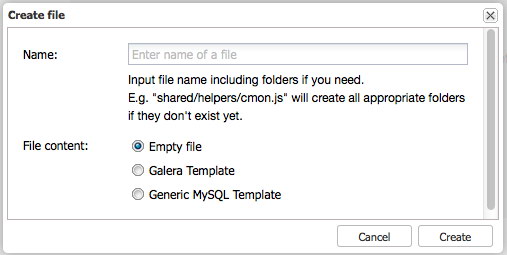
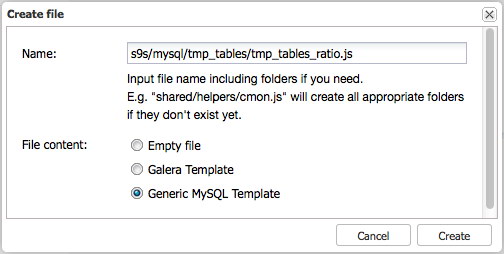
Since we have covered exports and imports, we can now start experimenting. So let’s create a new advisor! Click on the New button to get the following dialogue:

In this dialogue, you can create your new advisor with either an empty file or pre fill it with the Galera or MySQL specific template. Both templates will add the necessary includes (common/mysql_helper.js) and the basics to retrieve the Galera or MySQL nodes and loop over them.

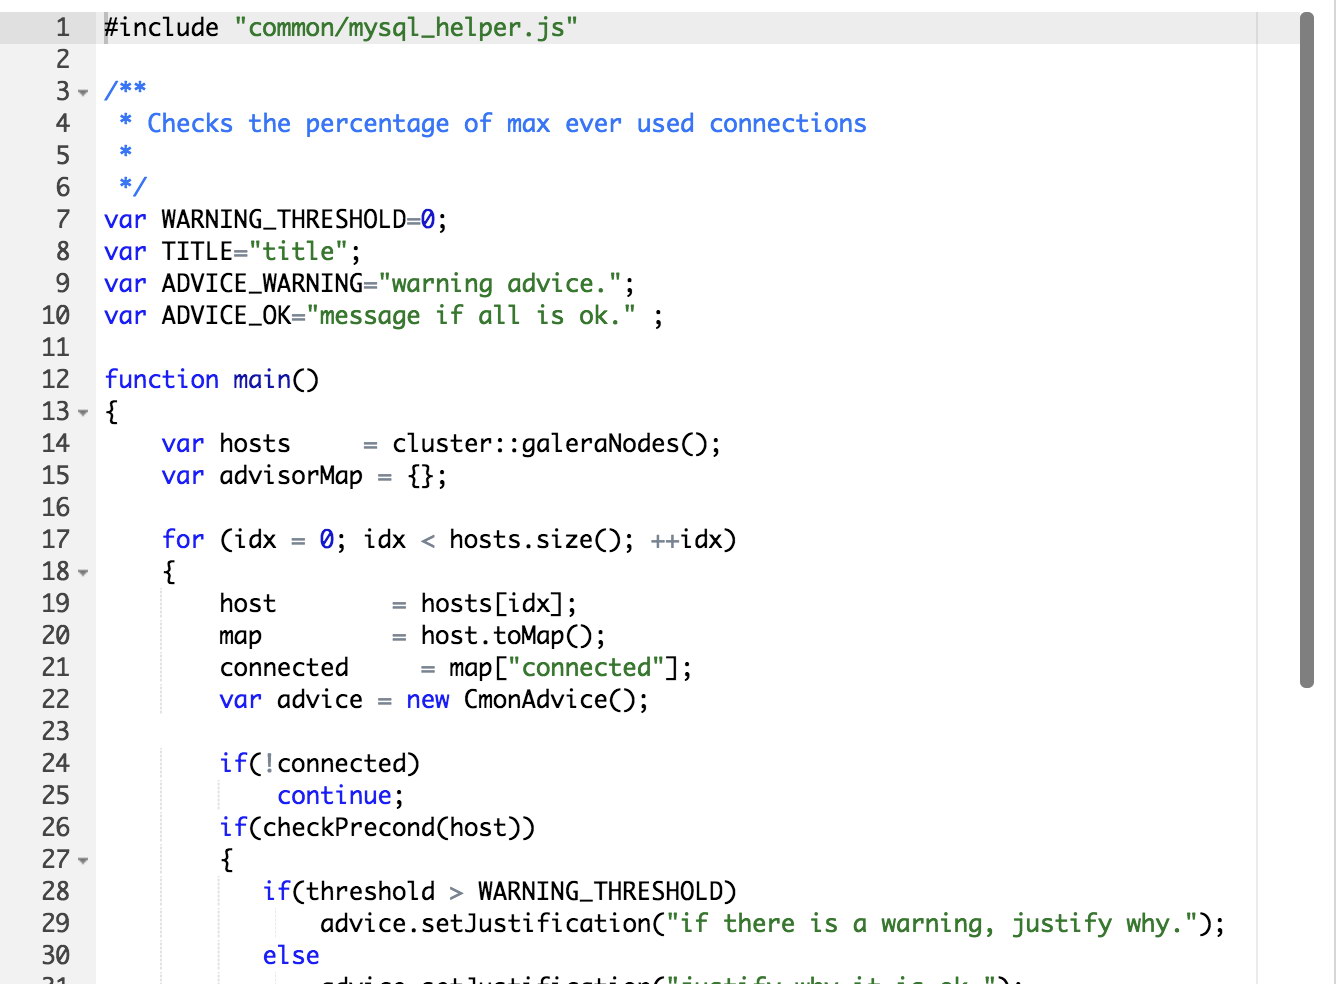
Creating a new advisor with the Galera template looks like this:

#include "common/mysql_helper.js"

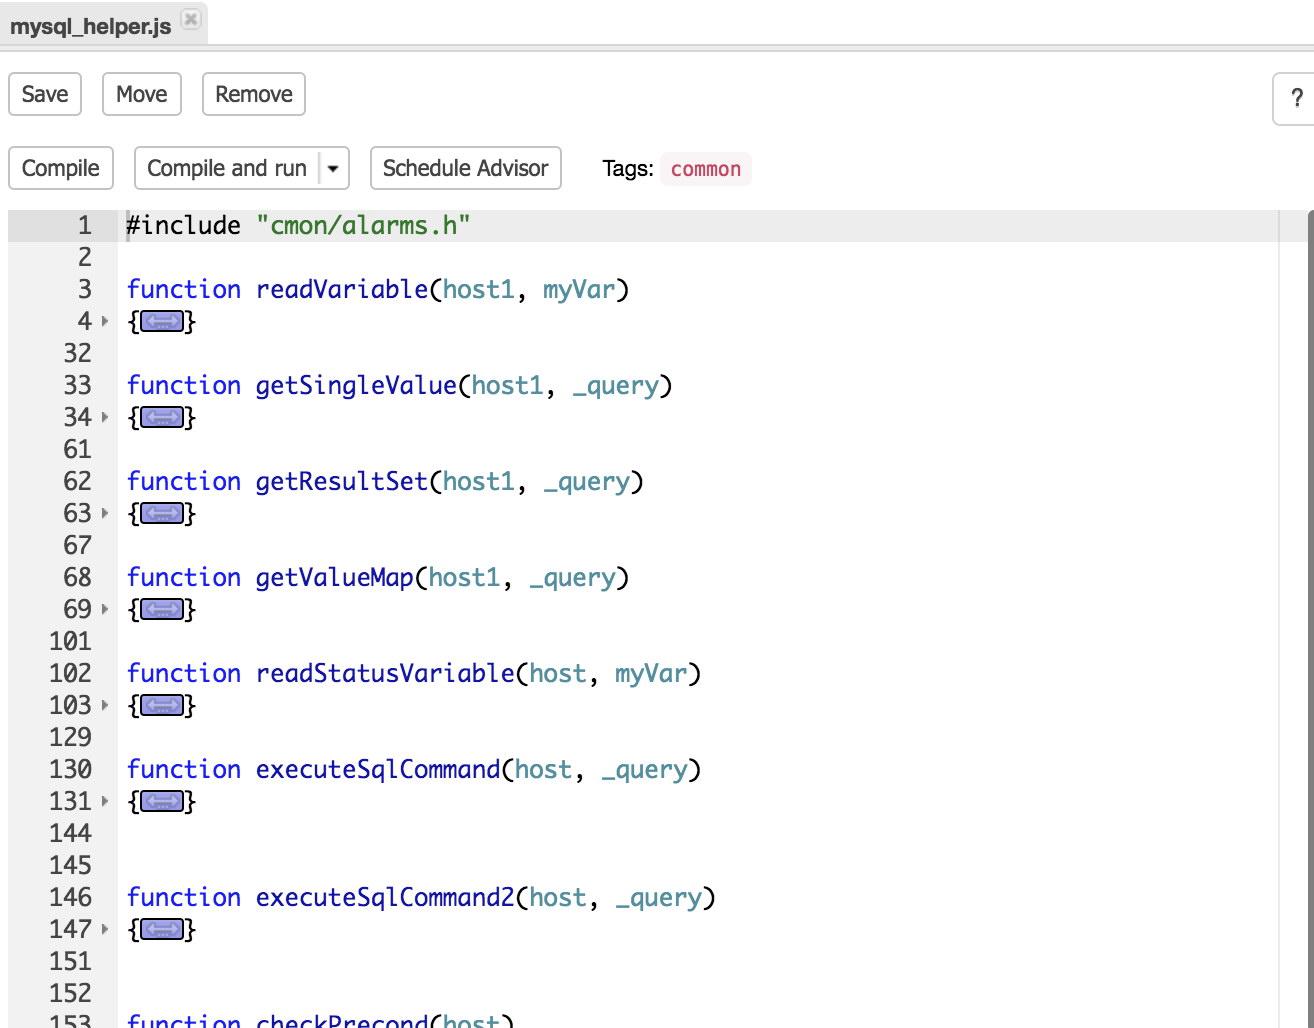
Here you can see that the mysql_helper.js gets included to provide the basis for connecting and querying MySQL nodes.

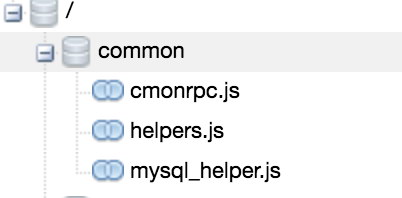
This file contains functions which you can invoke if needed like for example readVariable(<host>,<variable>) which will allow you to get the global variables value or invoke readStatusVariable(<host>,<variable>) which will also allow you to get the global status variables in MySQL. This file can be located in the tree as seen below:

var WARNING_THRESHOLD=0;
…
if(threshold > WARNING_THRESHOLD)

The warning threshold is currently set to 0, meaning if the measured threshold is greater than the warning threshold, the advisor should warn the user. Note that the variable threshold is not set/used in the template yet as it is a kickstart for your own advisor.

var hosts     = cluster::Hosts();
var hosts     = cluster::mySqlNodes();
var hosts     = cluster::galeraNodes();

The statements above will fetch the hosts in the cluster and you can use this to loop over them. The difference between them is that the first statement includes all non-MySQL hosts (also the CMON host), the second all MySQL hosts and the last one only the Galera hosts. So if your Galera cluster has MySQL asynchronous read slaves attached, those hosts will not be included.

Other than that, these objects will all behave the same and feature the ability to read their variables, status and query against them.

Advisor buttons

Now that we have created a new advisor there are six new button available for this advisor:

Save will save your latest modifications to the advisor (stored in the CMON database), Move will move the advisor to a new path and Remove will obviously remove the advisor.

More interesting is the second row of buttons. Compiling the advisor will compile the code of the advisor. If the code compiles fine, you will see this message in the Messages dialogue below the code of the advisor:

While if the compilation failed, the compiler will give you a hint where it failed:

In this case the compiler indicates a syntax error was found on line 24.

The compile and run button will not only compile the script but also execute it and its output will be shown in the Messages, Graph or Raw dialogue. If we compile and run the table cache script from the auto_tuners, we will get output similar to this:

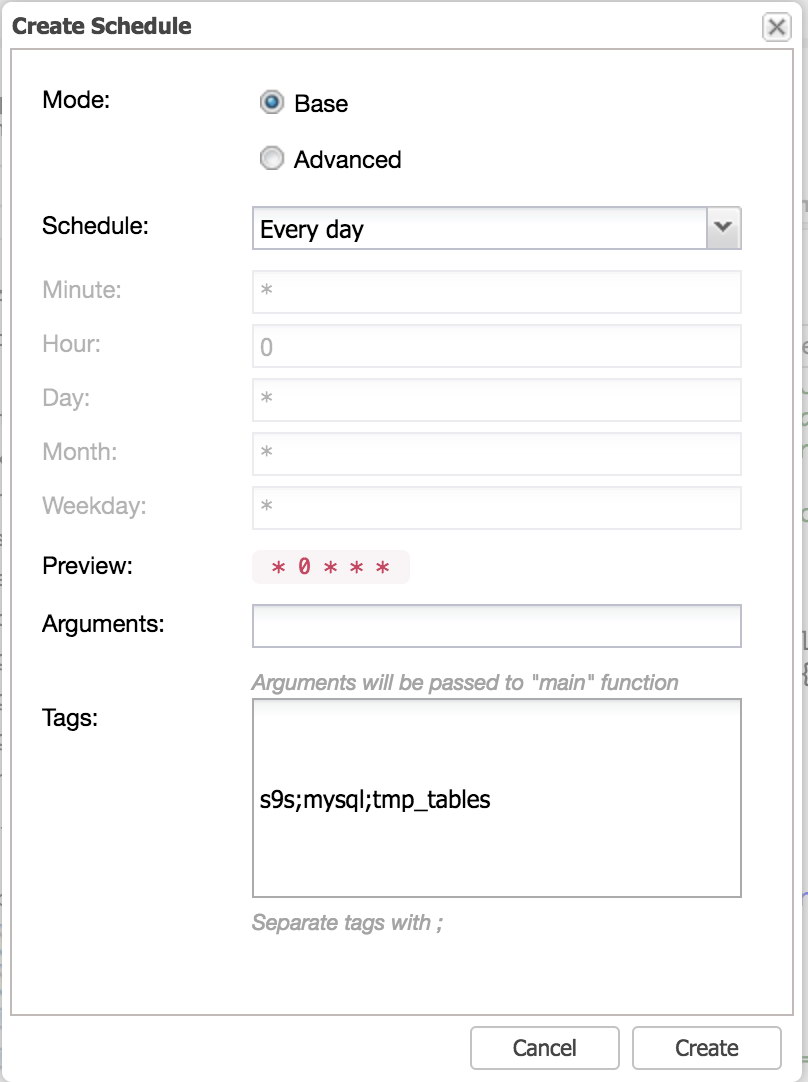
Last button is the schedule button. This allows you to schedule (or unschedule) your advisors and add tags to it. We will cover this at the end of this post when we have created our very own advisor and want to schedule it.

My first advisor

Now that we have covered the basics of the ClusterControl Developer Studio, we can now finally start to create a new advisor. As an example we will create a advisor to look at the temporary table ratio. Create a new advisor as following:

The theory behind the advisor we are going to create is simple: we will compare the number of temporary tables created on disk against the total number of temporary tables created:

tmp_disk_table_ratio = Created_tmp_disk_tables / (Created_tmp_tables + Created_tmp_disk_tables) * 100;

First we need to set some basics in the head of the script, like the thresholds and the warning and ok messages. All changes and additions are applied below:

var WARNING_THRESHOLD=20;
var TITLE="Temporary tables on disk ratio";
var ADVICE_WARNING="More than 20% of temporary tables are written to disk. It is advised to review your queries, for example, via the Query Monitor.";
var ADVICE_OK="Temporary tables on disk are not excessive." ;

We set the threshold here to 20 percent which is considered to be pretty bad already. But more on that topic once we have finalised our advisor.

Next we need to get these status variables from MySQL. Before we jump to conclusions and execute some “SHOW GLOBAL STATUS LIKE ‘Created_tmp_%’” query, there is already a function to retrieve the status variable of a MySQL instance, as what we described above where this function is located in common/mysql_helper.js:

statusVar = readStatusVariable(<host>, <statusvariablename>);

We can use this function in our advisor to fetch the Created_tmp_disk_tables and Created_tmp_tables.

    for (idx = 0; idx < hosts.size(); ++idx)
    {
        host        = hosts[idx];
        map         = host.toMap();
        connected     = map["connected"];
        var advice = new CmonAdvice();
        var tmp_tables = readStatusVariable(host, ‘Created_tmp_tables’);
        var tmp_disk_tables = readStatusVariable(host, ‘Created_tmp_disk_tables’);

And now we can calculate the temporary disk tables ratio:

        var tmp_disk_table_ratio = tmp_disk_tables / (tmp_tables + tmp_disk_tables) * 100;

And alert if this ratio is greater than the threshold we set in the beginning:

        if(checkPrecond(host))
        {
           if(tmp_disk_table_ratio > WARNING_THRESHOLD) {
               advice.setJustification("Temporary tables written to disk is excessive");
               msg = ADVICE_WARNING;
           }
           else {
               advice.setJustification("Temporary tables written to disk not excessive");
               msg = ADVICE_OK;
           }
        }

It is important to assign the Advice to the msg variable here as this will be added later on into the advice object with the setAdvice() function. The full script for completeness:

#include "common/mysql_helper.js"

/**
 * Checks the percentage of max ever used connections 
 * 
 */ 
var WARNING_THRESHOLD=20;
var TITLE="Temporary tables on disk ratio";
var ADVICE_WARNING="More than 20% of temporary tables are written to disk. It is advised to review your queries, for example, via the Query Monitor.";
var ADVICE_OK="Temporary tables on disk are not excessive.";

function main()
{
    var hosts     = cluster::mySqlNodes();
    var advisorMap = {};

    for (idx = 0; idx < hosts.size(); ++idx)
    {
        host        = hosts[idx];
        map         = host.toMap();
        connected     = map["connected"];
        var advice = new CmonAdvice();
        var tmp_tables = readStatusVariable(host, 'Created_tmp_tables');
        var tmp_disk_tables = readStatusVariable(host, 'Created_tmp_disk_tables');
        var tmp_disk_table_ratio = tmp_disk_tables / (tmp_tables + tmp_disk_tables) * 100;
        
        if(!connected)
            continue;
        if(checkPrecond(host))
        {
           if(tmp_disk_table_ratio > WARNING_THRESHOLD) {
               advice.setJustification("Temporary tables written to disk is excessive");
               msg = ADVICE_WARNING;
               advice.setSeverity(0);
           }
           else {
               advice.setJustification("Temporary tables written to disk not excessive");
               msg = ADVICE_OK;
           }
        }
        else
        {
            msg = "Not enough data to calculate";
            advice.setJustification("there is not enough load on the server or the uptime is too little.");
            advice.setSeverity(0);
        }
        advice.setHost(host);
        advice.setTitle(TITLE);
        advice.setAdvice(msg);
        advisorMap[idx]= advice;
    }
    return advisorMap;
}

Now you can play around with the threshold of 20, try to lower it to 1 or 2 for instance and then you probably can see how this advisor will actually give you advice on the matter.

As you can see, with a simple script you can check two variables against each other and report/advice based upon their outcome. But is that all? There are still a couple of things we can improve!

Improvements on my first advisor

The first thing we can improve is that this advisor doesn’t make a lot of sense. What the metric actually reflects is the total number of temporary tables on disk since the last FLUSH STATUS or startup of MySQL. What it doesn’t say is at what rate it actually creates temporary tables on disk. So we can convert the Created_tmp_disk_tables to a rate using the uptime of the host:

    var tmp_disk_table_rate = tmp_disk_tables / uptime;

This should give us the number of temporary tables per second and combined with the tmp_disk_table_ratio, this will give us a more accurate view on things. Again, once we reach the threshold of two temporary tables per second, we don’t want to immediately send out an alert/advice.

Another thing we can improve is to not use the readStatusVariable(<host>, <variable>) function from the common/mysql_helper.js library. This function executes a query to the MySQL host every time we read a status variable, while CMON already retrieves most of them every second and we don’t need a real-time status anyway. It’s not like two or three queries will kill the hosts in the cluster, but if many of these advisors are run in a similar fashion, this could create heaps of extra queries.

In this case we can optimize this by retrieving the status variables in a map using the host.sqlInfo() function and retrieve everything at once as a map. This function contains the most important information of the host, but it does not contain all. For instance the variable uptime that we need for the rate is not available in the host.sqlInfo() map and has to be retrieved with the readStatusVariable(<host>, <variable>) function.

This is what our advisor will look like now, with the changes/additions marked in bold:

#include "common/mysql_helper.js"

/**
 * Checks the percentage of max ever used connections 
 * 
 */ 
var RATIO_WARNING_THRESHOLD=20;
var RATE_WARNING_THRESHOLD=2;
var TITLE="Temporary tables on disk ratio";
var ADVICE_WARNING="More than 20% of temporary tables are written to disk and current rate is more than 2 temporary tables per second. It is advised to review your queries, for example, via the Query Monitor.";
var ADVICE_OK="Temporary tables on disk are not excessive.";

function main()
{
    var hosts     = cluster::mySqlNodes();
    var advisorMap = {};

    for (idx = 0; idx < hosts.size(); ++idx)
    {
        host        = hosts[idx];
        map         = host.toMap();
        connected     = map["connected"];
        var advice = new CmonAdvice();
        var hostStatus = host.sqlInfo();
        var tmp_tables = hostStatus['CREATED_TMP_TABLES'];
        var tmp_disk_tables = hostStatus['CREATED_TMP_DISK_TABLES'];
        var uptime = readStatusVariable(host, 'uptime');
        var tmp_disk_table_ratio = tmp_disk_tables / (tmp_tables + tmp_disk_tables) * 100;
        var tmp_disk_table_rate = tmp_disk_tables / uptime;
        
        if(!connected)
            continue;
        if(checkPrecond(host))
        {
           if(tmp_disk_table_rate > RATE_WARNING_THRESHOLD && tmp_disk_table_ratio > RATIO_WARNING_THRESHOLD) {
               advice.setJustification("Temporary tables written to disk is excessive: " + tmp_disk_table_rate + " tables per second and overall ratio of " + tmp_disk_table_ratio);
               msg = ADVICE_WARNING;
               advice.setSeverity(0);
           }
           else {
               advice.setJustification("Temporary tables written to disk not excessive");
               msg = ADVICE_OK;
           }
        }
        else
        {
            msg = "Not enough data to calculate";
            advice.setJustification("there is not enough load on the server or the uptime is too little.");
            advice.setSeverity(0);
        }
        advice.setHost(host);
        advice.setTitle(TITLE);
        advice.setAdvice(msg);
        advisorMap[idx]= advice;
    }
    return advisorMap;
}

Scheduling my first advisor

After we have saved this new advisor, compiled it and run, we now can schedule this advisor. Since we don’t have an excessive workload, we will probably run this advisor once per day.

The base scheduling mode is similar to Cron which has every minute, 5 minutes, hour, day, month preset and this is exactly what we need and is very easy to manage the scheduling. Changing this to advanced will unlock the other greyed out input fields. These input fields work exactly the same as a crontab, so you can even schedule for a particular day, day of the month or even set it on weekdays.

Following this blog, we will create a checker for SELinux or security checks for Spectre and Meltdown if nodes are affected. Stay tuned!

Introducing Agent-Based Database Monitoring with ClusterControl 1.7

$
0
0

We are excited to announce the 1.7 release of ClusterControl - the only management system you’ll ever need to take control of your open source database infrastructure!

ClusterControl 1.7 introduces new exciting agent-based monitoring features for MySQL, Galera Cluster, PostgreSQL & ProxySQL, security and cloud scaling features ... and more!

Release Highlights

Monitoring & Alerting

  • Agent-based monitoring with Prometheus
  • New performance dashboards for MySQL, Galera Cluster, PostgreSQL & ProxySQL

Security & Compliance

  • Enable/disable Audit Logging on your MariaDB databases
  • Enable policy-based monitoring and logging of connection and query activity

Deployment & Scaling

  • Automatically launch cloud instances and add nodes to your cloud deployments

Additional Highlights

  • Support for MariaDB v10.3

View the ClusterControl ChangeLog for all the details!

ClusterControl
Single Console for Your Entire Database Infrastructure
Find out what else is new in ClusterControl

View Release Details and Resources

Release Details

Monitoring & Alerting

Agent-based monitoring with Prometheus

ClusterControl was originally designed to address modern, highly distributed database setups based on replication or clustering. It provides a systems view of all the components of a distributed cluster, including load balancers, and maintains a logical topology view of the cluster.

So far we’d gone the agentless monitoring route with ClusterControl, and although we love the simplicity of not having to install or manage agents on the monitored database hosts, an agent-based approach can provide higher resolution of monitoring data and has certain advantages in terms of security.

With that in mind, we’re happy to introduce agent-based monitoring as a new feature added in ClusterControl 1.7!

It makes use of Prometheus, a full monitoring and trending system that includes built-in and active scraping and storing of metrics based on time series data. One Prometheus server can be used to monitor multiple clusters. ClusterControl takes care of installing and maintaining Prometheus as well as exporters on the monitored hosts.

Users can now enable their database clusters to use Prometheus exporters to collect metrics on their nodes and hosts, thus avoiding excessive SSH activity for monitoring and metrics collections and use SSH connectivity only for management operations.

Monitoring & Alerting

New performance dashboards for MySQL, Galera Cluster, PostgreSQL & ProxySQL

ClusterControl users now have access to a set of new dashboards that have Prometheus as the data source with its flexible query language and multi-dimensional data model, where time series data is identified by metric name and key/value pairs. This allows for greater accuracy and customization options while monitoring your database clusters.

The new dashboards include:

  • Cross Server Graphs
  • System Overview
  • MySQL Overview, Replication, Performance Schema & InnoDB Metrics
  • Galera Cluster Overview & Graphs
  • PostgreSQL Overview
  • ProxySQL Overview

Security & Compliance

Audit Log for MariaDB

Continuous auditing is an imperative task for monitoring your database environment. By auditing your database, you can achieve accountability for actions taken or content accessed. Moreover, the audit may include some critical system components, such as the ones associated with financial data to support a precise set of regulations like SOX, or the EU GDPR regulation. Usually, it is achieved by logging information about DB operations on the database to an external log file.

With ClusterControl 1.7 users can now enable a plugin that will log all of their MariaDB database connections or queries to a file for further review; it also introduces support for version 10.3 of MariaDB.

Additional New Functionalities

View the ClusterControl ChangeLog for all the details!

Download ClusterControl today!

Happy Clustering!

New White Paper on State-of-the-Art Database Management: ClusterControl - The Guide

$
0
0

Today we’re happy to announce the availability of our first white paper on ClusterControl, the only management system you’ll ever need to automate and manage your open source database infrastructure!

Download ClusterControl - The Guide!

Most organizations have databases to manage, and experience the headaches that come with that: managing performance, monitoring uptime, automatically recovering from failures, scaling, backups, security and disaster recovery. Organizations build and buy numerous tools and utilities for that purpose.

ClusterControl differs from the usual approach of trying to bolt together performance monitoring, automatic failover and backup management tools by combining – in one product – everything you need to deploy and operate mission-critical databases in production. It automates the entire database environment, and ultimately delivers an agile, modern and highly available data platform based on open source.

All-in-one management software - the ClusterControl features set:

Since the inception of Severalnines, we have made it our mission to provide market-leading solutions to help organisations achieve optimal efficiency and availability of their open source database infrastructures.

With ClusterControl, as it stands today, we are proud to say: mission accomplished!

Our flagship product is an integrated deployment, monitoring, and management automation system for open source databases, which provides holistic, real-time control of your database operations in an easy and intuitive experience, incorporating the best practices learned from thousands of customer deployments in a comprehensive system that helps you manage your databases safely and reliably.

Whether you’re a MySQL, MariaDB, PostgreSQL or MongoDB user (or a combination of these), ClusterControl has you covered.

Deploying, monitoring and managing highly available open source database clusters is not a small feat and requires either just as highly specialised database administration (DBA) skills … or professional tools and systems that non-DBA users can wield in order to build and maintain such systems, though these typically come with an equally high learning curve.

The idea and concept for ClusterControl was born out of that conundrum that most organisations face when it comes to running highly available database environments.

It is the only solution on the market today that provides that intuitive, easy to use system with the full set of tools required to manage such complex database environments end-to-end, whether one is a DBA or not.

The aim of this Guide is to make the case for comprehensive open source database management and the need for cluster management software. And explains in a just as comprehensive fashion why ClusterControl is the only management system you will ever need to run highly available open source database infrastructures.

Download ClusterControl - The Guide!


Introducing SCUMM: the agent-based database monitoring infrastructure in ClusterControl

$
0
0

Having just announced the 1.7 release of our flagship product ClusterControl this week, we’d like to introduce you more specifically to the key cornerstone of that release, our new agent-based monitoring infrastructure: SCUMM!

As a core element of our product, ClusterControl provides a complete monitoring system with real time data to know what is happening now, with high resolution metrics for better accuracy, pre-configured dashboards, and a wide range of third-party notification services for alerting. On-premises and cloud systems can be monitored and managed from one single point. Intelligent health-checks are implemented for distributed topologies, for instance detection of network partitioning by leveraging the load balancer’s view of the database nodes.

And, this is the part that’s new: monitoring can be agentless via SSH or agent-based … which is where SCUMM comes in!

ClusterControl’s new SCUMM system is agent-based, with a server pulling metrics from agents that run on the same hosts as the monitored databases and uses Prometheus agents for greater accuracy and customization options while monitoring your database clusters.

But why SCUMM and what is it all about?

Introduction to SCUMM

SCUMM - Severalnines CMON Unified Monitoring and Management - is our new agent-based monitoring infrastructure.

This monitoring infrastructure consists of two main components:

The first component is the Prometheus server which acts as the time series database and stores the collected metrics.

The second component is the exporter. There can be one or more exporters responsible for collecting metrics from a node or a service. The Prometheus server collects these metrics (this is called scraping) from the exporters over HTTP. On top of this, we have created a set of dashboards to visualise the collected metrics.

The main benefits are:

  1. Collect metrics with community supported Prometheus exporters
    1. For example data from MySQL Performance Schema or ProxySQL
  2. A number of specialized dashboards showing the most important metrics and historical trending for each monitored service
  3. High frequency monitoring makes it possible to scrape the targets with a one second interval
  4. An architecture that scales with the number of database servers and clusters. A single Prometheus instance can ingest thousands of samples per second.
  5. No reliance on SSH connectivity for collecting host and process metrics, which means a more scalable system compared to an agentless monitoring solution
  6. The ability to create custom dashboards with custom rules (watch out for our upcoming releases)

The SCUMM Agents/Exporters that are installed on the monitored nodes are called Prometheus Exporters. The exporters collect metrics from the node (e.g CPU, RAM, Disk, and Network) and from services such as MySQL or PostgreSQL servers. The Prometheus server is installed on a server and scrapes (samples) the exporters with a custom interval.

Why Prometheus ?

Prometheus is a very popular time-series databases that has gained a large adoption with an active ecosystem. It offers a rich data model and a query language with a http based poll system. It is easy to install, maintain and configure in HA setup as well.

Prometheus scrapes metrics from instrumented jobs, either directly or via an intermediary push gateway for short-lived jobs. It stores all scraped samples locally and runs rules over this data to either aggregate and record new time series from existing data or generate alerts.

Prometheus works well for recording any purely numeric time series. It fits both machine-centric monitoring as well as monitoring of highly dynamic, service-oriented architectures. In a world of microservices, its support for multi-dimensional data collection and querying is a particular strength.

Prometheus is designed for reliability, to be the system you go to during an outage to allow you to quickly diagnose problems. Each Prometheus server is standalone, not depending on network storage or other remote services. You can rely on it when other parts of your infrastructure are broken, and you do not need to set up extensive infrastructure to use it. Thus for high-availability it is possible to simply install a second Prometheus server scraping the same data as the first Prometheus server.

Moreover, Prometheus is a very popular time series database and its adoption has grown very fast. It is possible for another Prometheus server that’s higher up in the organization to scrape the Prometheus servers closer to the database tier. This allows for a scalable monitoring infrastructure where on the database tier the data resolution is higher than further up in an organization.

Exporters

One or more exporters are installed on the monitored server and are responsible for collecting metrics about a specific part of the infrastructure. E.g, there may be one exporter to capture host specific information, an exporter to capture MySQL metrics, and ProxySQL metrics.

We have also created a specific process exporter that monitors the running processes of the server. This exporter is critical to the high availability features in ClusterControl, and allows ClusterControl to quickly react on process failures and process states. Using the process exporter (which is installed by default when Agent Based Monitoring is enabled) reduces the system load on the monitored servers.

Enabling Agent Based Monitoring In ClusterControl

Enabling Agent Based Monitoring is as simple as clicking on the Dashboard, and then click on "Enable Agent Based Monitoring." Select a host where the Prometheus server will be installed. This Prometheus server can then be shared with other clusters.

To summarise …

Whether one wants to use a monitoring agent or go the agentless route is completely based on organizational policy requirements and custom needs. And although we love the simplicity of not having to install or manage agents on the monitored database hosts, an agent-based approach can provide higher resolution of monitoring data and has certain advantages in terms of security.

ClusterControl’s new SCUMM system uses Prometheus agents for greater accuracy and customization options while monitoring your database clusters.

Why not give it a try and see for yourself!

Install ClusterControl today (it’s free with our Community Edition) or download our new ClusterControl Guide if you’d like to read about our product more first.

How to Deploy a MySQL NDB Cluster Using ClusterControl

$
0
0

MySQL NDB Cluster is one of the best solutions to implement shared-nothing databases, which are durable and scale well.

NDB cluster consists of several elements: there are management servers, data nodes and SQL nodes. Each of them have to be installed and configured properly - but this makes it cumbersome to deploy NDB cluster manually.

With ClusterControl however, MySQL NDB Cluster can be deployed in a just few clicks.

In this blog post we will show you how it is done.

First of all, we’ll assume that you have passwordless SSH access configured to all the nodes you will use to deploy NDB Cluster on. Once this is done, you can start the deployment of NDB Cluster using ClusterControl.

You start by selecting the “Deploy” option in the wizard.

As the first step in the wizard, you need to define how the SSH access works. It can either be a direct access with root user or it can be a sudo access with or without a password, as can be seen below:

You can also name your cluster here and decide if you want ClusterControl to disable your firewall or AppArmor or SELinux. It is not needed if those tools are correctly configured to work with MySQL NDB Cluster.

As a next step you have to pick two management servers. You can use either an IP address or a hostname to identify the host.

Then, you need to define the database nodes. Again, you can use IP or hostname. Please keep in mind that you need to have an even number of nodes: 2, 4, 6 etc. It is possible to deploy up to 14 data nodes in your cluster.

Finally, you’ll want to deploy SQL nodes which will be gateways into your MySQL NDB Cluster. Here you should fill a root password for those nodes.

Once you are done here, click “Deploy” button and ClusterControl will start the deployment.

An Activity menu will show you the progress of the job.

Once it’s done, you can start using ClusterControl to monitor and manage your MySQL NDB Cluster.

I trust this blog post will help you to efficiently deploy MySQL NDB Cluster using ClusterControl.

Just try it out for yourself by installing ClusterControl (it’s free)!

ClusterControl Tips & Tricks: Manage and Monitor Your Existing MySQL NDB Cluster

$
0
0

Of the different types of clustered MySQL environments, NDB Cluster is among the ones that involves most effort and resources to administer. And unless you are a command line guru, you would want to use a management tool that gives you a full view of what is going on in your cluster and administers it for you.

At Severalnines, that tool or system is ClusterControl, which you can use to easily deploy, monitor and manage your (existing) MySQL Cluster (NDB).

In this blog post, we are going to show you how to add two existing MySQL Clusters (production and staging) to ClusterControl in order to more easily and efficiently manage them.

ClusterControl: 10.0.0.100

Cluster #1:

  • Management node: mgmd1 - 10.0.0.141
  • Management node: mgmd2 - 10.0.0.142
  • Data node: data1 - 10.0.0.143
  • Data node: data2 - 10.0.0.144
  • Data node: data3 - 10.0.0.145
  • Data node: data4 - 10.0.0.146
  • SQL node: sql1 - 10.0.0.147
  • SQL node: sql2 - 10.0.0.148

Cluster #2:

  • Management node: mgmd1 - 10.0.1.141
  • Management node: mgmd2 - 10.0.1.142
  • Data node: data1 - 10.0.1.143
  • Data node: data2 - 10.0.1.144
  • Data node: data3 - 10.0.1.145
  • Data node: data4 - 10.0.1.146
  • SQL node: sql1 - 10.0.1.147
  • SQL node: sql2 - 10.0.1.148

Adding the First Cluster

Based on the above architecture diagram, here is what you should do to add the first cluster to ClusterControl:

1. Install the latest ClusterControl. Once done, register the default admin user/password and log into the ClusterControl dashboard:

2. As root or sudo user, setup passwordless SSH to all nodes (including the ClusterControl node):

$ whoami
root
$ ssh-keygen -t rsa
$ ssh-copy-id 10.0.0.141
$ ssh-copy-id 10.0.0.142
$ ssh-copy-id 10.0.0.143
$ ssh-copy-id 10.0.0.144
$ ssh-copy-id 10.0.0.145
$ ssh-copy-id 10.0.0.146
$ ssh-copy-id 10.0.0.147
$ ssh-copy-id 10.0.0.148

Also ensure that the controller can connect to the management servers (ndb_mgmd) on port 1186, and on port 3306 (or the port used by the MySQL servers).

Adding the Cluster

Once the SSH access is configured, you can use the “Import Existing Server/Database” option in ClusterControl to import your first cluster.

Make sure you pick MySQL Cluster (NDB) from the list. Then, you need to define how the SSH access should look like. ClusterControl supports password-less SSH using root or sudo user (with or without password).

The rest is all about defining services. At first, you have to provide IPs or hostnames of management servers. Make sure that the port is correct and it is reachable.

As a next step you have to define data nodes. Again, make sure the port is ok and reachable. You can also use either IP or a hostname here.

Finally, you need to pass information about SQL nodes. On top of the port and IP/hostname you have to pass root password to MySQL and MySQL installation directory.

You also have a couple of options to decide upon.

You can either enable or disable queries to the information_schema. We found that in some cases (setups with tens of thousands of tables) such queries may cause issues. You can also enable cluster and node autorecovery or keep it disabled and enable it at the later time.

Keeping auto recovery disabled may make sense especially if you already have some scripts in place and you don’t want ClusterControl to take over the recovery from the beginning. You can always transition to ClusterControl later after you prepare and test a maintenance plan for that.

When you click on “Import”, ClusterControl will attempt to import your NDB Cluster. It may take a moment and, as long as all the connectivity is working just fine, it should complete successfully and a new cluster should show up in the UI. Now you can repeat exactly the same process for the second, staging cluster.

You can now manage, monitor and scale your MySQL Clusters from the ClusterControl system.

Happy clustering!

ClusterControl Developer Studio: Using ClusterControl Advisor to create checks for SELinux and Meltdown/Spectre Part 1

$
0
0

We previously showed you how to create your first database advisor in ClusterControl. Now let’s see how we can create a security advisor to check for SELinux and Meltdown/Spectre. We will be using the ClusterControl Developer Studio for this. The ClusterControl DSL handles the call for our shell scripts to be invoked and do the checks.

Since this is a larger topic, we have separated into two parts. First part, let’s try to embed SELinux check and see how we can achieve this. Basically, there are certain cases where we do not need SELinux enabled, specially with database nodes such MySQL/MariaDB/MongoDB/PostgreSQL. When running these nodes in production, they are best kept within a private network. This blog does not advocate that you should disable SELinux everywhere, but in certain cases, this security module can cause issues with your production databases. So let’s begin!

If you have been through our previous blogs, ClusterControl Developer Studio relies on ClusterControl Domain Specific Language, or CCDSL or DSL for short. Part of the functions that DSL provides is host.system(cmd) function. You can check our DSL page for more functions and get familiar with its language specification. This is where we rely on simply invoking the shell command and manage it through our Developer Studio and handle the command output through CCDSL.

First, let’s create the file. Go to Cluster > Manage > Developer Studio > New and do the following:

This will create a folder and a sub-folder “myadvisors/host” and a file called selinux-checker.js.

For this exercise, I have uploaded the scripts to github which can be found here https://github.com/paulnamuag/s9s_CCDSL_scripts. So let’s paste the contents of the file selinux-checker.js from the repository I have uploaded.

Always do not forget to frequently save your work here if you are working on the Developer Studio workspace, otherwise you’ll lose your modifications/changes if you lose your session or if you accidentally close the browser or tab.

Now let’s go to the code tackling the important ones that I would like to share with you! If you look from lines 3 - 8,

var DESCRIPTION="This advisor is to check if SELinux is set to Enforcing otherwise"" it's disabled or set as Permissive";
var TITLE="SELinux Check";
var ADVICE_WARNING="Warning!!! getenforce reveals it is set to Enforcing. Run &quot;setenforce permissive&quot; ""or edit /etc/selinux/config and set SELINUX=disabled but this requires a host restart" ;
var ADVICE_OK="SELinux is Permissive or disabled" ;

these are similar to the JavaScript variable initialization which is, in this case, declared as global. However, the use in this script is important as it’s being purposely assigned to be used in the Advisors results page which we will see in the following section.

Going through the main() function, in line 12, we are invoking:

var hosts     = cluster::mySqlNodes();

since I want only to check my MySQL nodes excluding the ClusterControl monitor host. So if you want to check and grab all the nodes, then use cluster::hosts(). More of these functions are in the Cluster Functions section of the CCDSL manual.

The script is very easy to understand if you are a JavaScript programmer or at least understand how JavaScript works. So we’ll take a shortcut and move on to line 33,

retval = host.system("/sbin/getenforce |tr -d '\n'");

The line above will invoke /sbin/getenforce |tr -d '\n' Linux command which basically means to retrieve SELinux state and then remove a trailing newline. The host.system() will return an array value consisting of key names which are “success”, “result”, and “errorMessage”.

The lines from 35 - 79, this if/else statement basically handles the return value from function host.system(). If we focus on lines 42 - 44,

advice.setSeverity(Ok);
advice.setJustification(msg);
advice.setAdvice("Nothing to do.");

we’re setting the properties for the object advice variable of type CmonAdvice(). These properties are used to setup our Advisor alerts. Take note that there are 4 types of enumerated types of Severity, these are Undefined, Ok, Warning, and Critical. These are used to set messages in our Advisor results page. Lastly, let’s move on to lines 75 - 78,

advice.setHost(host);
advice.setTitle(TITLE);
advisorMap[idx]= advice;
print(advice.toString("%E"));

advice.setHost(<hostname>) defines which host is currently being checked for SELinux. Then advice.setTitle(<title>) is the name or title used in our Advisors results page. Line 77 sets the advisorMap associative array with the object advice which is being returned to our CMON API as seen in line 80. Then in line 78, we are printing the advice object in multi line description which contains multiple properties.

Now, let’s hit button . This would print in the Messages tab as seen below:

ClusterControl
Single Console for Your Entire Database Infrastructure
Find out what else is new in ClusterControl

Looking good now? Well, let’s see and schedule the advisor, let say run this check for every 30 minutes and set tags as myadvisors;host;selinux-checker.

Now, what else do we expect?

The Advisors Results

Since we had the our SELinux Check advisor scheduled, let’s now go to Cluster > Performance > Advisors. Then select the tags we had previously defined which are myadvisors and selinux-checker.

You’ll see here all of your advisors, whether they are provided by Severalnines or are custom-made by you. Once it’s scheduled, it’ll be viewed here. This is one of the coolest part, because here you can check and monitor the advisors that you want to focus on. You can prioritise the most important ones by enabling them, and disable the ones that you no longer need.

In Part 2 of this blog, we’ll go over creating a more challenging one to check for Meltdown/Spectre and incorporate alarms. We’ll also show you how to debug your CCDSL code like a pro.

Effective Monitoring of MySQL with SCUMM Dashboards Part 1

$
0
0

We added a number of new dashboards for MySQL in our latest release of ClusterControl 1.7.0. - and in our previous blog, we showed you How to Monitor Your ProxySQL with Prometheus and ClusterControl.

In this blog, we will look at the MySQL Overview dashboard.

So, we have enabled the Agent Based Monitoring under the Dashboard tab to start collecting metrics to the nodes. Take note that when enabling the Agent Based Monitoring, you have the options to set the “Scrape Interval (seconds)” and “Data retention (days)”. Scraping Interval is where you want to set how aggressively Prometheus will harvest data from the target and Data Retention is how long you want to keep your data collected by Prometheus before it’s deleted.

When enabled, you can identify which cluster has agents and which one has agentless monitoring.

Compared to the agentless approach, the granularity of your data in graphs will be higher with agents.

The MySQL Graphs

The latest version of ClusterControl 1.7.0 (which you can download for free - ClusterControl Community) has the following MySQL Dashboards for which you can gather information for your MySQL servers. These are MySQL Overview, MySQL InnoDB Metrics, MySQL Performance Schema, and MySQL Replication.

We’ll cover in details the graphs available in the MySQL Overview dashboard.

MySQL Overview Dashboard

This dashboard contains the usual important variables or information regarding the health of your MySQL node. The graphs contained on this dashboard are specific to the node selected upon viewing the dashboards as seen below:

It consists of 26 graphs, but you might not need all of these when diagnosing problems. However, these graphs provides a vital representation of the overall metrics for your MySQL servers. Let’s go over the basic ones, as these are probably the most common things that a DBA will routinely look at.

The first four graphs shown above along with the MySQL’s uptime, query per-seconds, and buffer pool information are the most basic pointers we might need. From the graphs displayed above, here are their representations:

  • MySQL Connections
    This is where you want to check your total client connections thus far allocated in a specific period of time.
  • MySQL Client Thread Activity
    There are times that your MySQL server could be very busy. For example, it might be expected to receive surge in traffic at a specific time, and you want to monitor your running threads activity. This graph is really important to look at. There can be times your query performance could go south if, for example, a large update causes other threads to wait to acquire lock. This would lead to an increased number of your running threads. The cache miss rate is calculated as Threads_created/Connections.
  • MySQL Questions
    These are the queries running in a specific period of time. A thread might be a transaction composed of multiple queries and this can be a good graph to look at.
  • MySQL Thread Cache
    This graph shows the thread_cache_size value, threads that are cached (threads that are reused), and threads that are created (new threads). You can check on this graph for such instances like you need to tune your read queries when noticing a high number of incoming connections and your threads created increases rapidly. For example, if your Threads_running / thread_cache_size > 2 then increasing your thread_cache_size may give a performance boost to your server. Take note that creation and destruction of threads are expensive. However, in the recent versions of MySQL (>=5.6.8), this variable has autosizing by default which you might consider it untouched.

The next four graphs are MySQL Temporary Objects, MySQL Select Types, MySQL Sorts, and MySQL Slow Queries. These graphs are related to each other specially if you are diagnosing long running queries and large queries that needs optimization.

  • MySQL Temporary Objects
    This graph would be a good source to rely upon if you want to monitor long running queries that would end up using disk instead of temporary tables or files going in-memory. It’s a good place to start looking for periodical occurrence of queries that could add up to create disk space issues especially during odd times.
  • MySQL Select Types
    One source of bad performance is queries that are using full joins, table scans, select range that is not using any indexes. This graph would show how your query performs and what amongst the list from full joins, to full range joins, select range, table scans has the highest trends.
  • MySQL Sorts
    Diagnosing those queries that are using sorting, and the ones that take much time to finish.
  • MySQL Slow Queries
    Trends of your slow queries are collected here on this graph. This is very useful especially on diagnosing how often your queries are slow. What are things that need to be tuned? It could be too small buffer pool, tables that lack indexes and goes a full-table scan, logical backups running on unexpected schedule, etc. Using our Query Monitor in ClusterControl along with this graph is beneficial, as it helps determine slow queries.

The next graphs we have cover is more of the network activity, table locks, and the underlying internal memory that MySQL is consuming during the MySQL’s activity.

  • MySQL Aborted Connections
    The number of aborted connections will render on this graph. This covers the aborted clients such as where the network was closed abruptly or where the internet connection was down or interrupted. It also records the aborted connects or attempts such as wrong passwords or bad packets upon establishing a connection from the client.
  • MySQL Table Locks
    Trends for tables that request for a table lock that has been granted immediately and for tables that request for a lock that has not been acquired immediately. For example, if you have table-level locks on MyISAM tables and incoming requests of the same table, these cannot be granted immediately.
  • MySQL Network Traffic
    This graph shows the trends of the inbound and outbound network activity in the MySQL server. “Inbound” is the data received by the MySQL server while “Outbound” is the data sent or transferred by the server from the MySQL server.This graph is best to check upon if you want to monitor your network traffic especially when diagnosing if your traffic is moderate but you’re wondering why it has a very high outbound transferred data, like for example, BLOB data.
  • MySQL Network Usage Hourly
    Same as the network traffic which shows the Received and Sent data. Take note that it’s based on ‘per hour’ and labeled with ‘last day’ which will not follow the period of time you selected in the date picker.
  • MySQL Internal Memory Overview
    This graph is familiar for a seasoned MySQL DBA. Each of these legends in the bar graph are very important especially if you want to monitor your memory usage, your buffer pool usage, or your adaptive hash index size.

The following graphs show the counters that a DBA can rely upon such as checking the statistics for example, the statistics for selects, inserts, updates, the number of master status that has been executed, the number of SHOW VARIABLES that has been executed, check if you have bad queries doing table scans or tables not using indexes by looking over the read_* counters, etc.


  • Top Command Counters (Hourly)
    These are the graphs you would likely have to check whenever you would like to see the statistics for your inserts, deletes, updates, executed commands such as gathering the processlist, slave status, show status (health statistics of the MySQL server), and many more. This is a good place if you want to check what kind of MySQL command counters are topmost and if some performance tuning or query optimization is needed. It might also allow you to identify which commands are running aggressively while not needing it.
  • MySQL Handlers
    Oftentimes, a DBA would go over these handlers and check how the queries are performing in your MySQL server. Basically, this graph covers the counters from the Handler API of MySQL. Most common handler counters for a DBA for the storage API in MySQL are Handler_read_first, Handler_read_key, Handler_read_last, Handler_read_next, Handler_read_prev, Handler_read_rnd, and Handler_read_rnd_next. There are lots of MySQL Handlers to check upon. You can read about them in the documentation here.
  • MySQL Transaction Handlers
    If your MySQL server is using XA transactions, SAVEPOINT, ROLLBACK TO SAVEPOINT statements. Then this graph is a good reference to look at. You can also use this graph to monitor all your server’s internal commits. Take note that the counter for Handler_commit does increment even for SELECT statements but differs against insert/update/delete statements which goes to the binary log during a call to COMMIT statement.

The next graph will show trends about process states and their hourly usage. There are lots of key points here in the bar graph legend that a DBA would check. Encountering disk space issues, connection issues and see if your connection pool is working as expected, high disk I/O, network issues, etc.

  • Process States/Top Process States Hourly
    This graph is where you can monitor the top thread states of your queries running in the processlist. This is very informative and helpful for such DBA tasks where you can examine here any outstanding statuses that need resolution. For example, opening tables state is very high and its minimum value is almost near to the maximum value. This could indicate that you need to adjust the table_open_cache. If the statistics is high and you’re noticing a slow down of your server, this could indicate that your server is disk-bound and you might need to consider increasing your buffer pool. If you have a high number of creating tmp table then you might have to check your slow log and optimize the offending queries. You can checkout the manual for the complete list of MySQL thread states here.

The next graph we’ll be checking is about query cache, MySQL table definition cache, how often MySQL opens system files.


  • MySQL Query Cache Memory/Activity
    These graphs are related to each other. If you have query_cache_size <> 0 and query_cache_type <> 0, then this graph can be of help. However, in the newer versions of MySQL, the query cache has been marked as deprecated as the MySQL query cache is known to cause performance issues. You might not need this in the future. The most recent version of MySQL 8.0 has drastic improvements; it tends to increase performance as it comes with several strategies to handle cache information in the memory buffers.
  • MySQL File Openings
    This graph shows the trend for the opened files since the MySQL server’s uptime but it excludes files such as sockets or pipes. It does also not include files that are opened by the storage engine since they have their own counter that is Innodb_num_open_files.
  • MySQL Open Files
    This graph is where you want to check your InnoDB files currently held open, the current MySQL open files, and your open_files_limit variable.
  • MySQL Table Open Cache Status
    If you have very low table_open_cache set here, this graph will tell you about those tables that fail the cache (newly opened tables) or miss due to overflow. If you encounter a high number or too much “Opening tables” status in your processlist, this graph will serve as your reference to determine this. This will tell you if there’s a need to increase your table_open_cache variable.
  • MySQL Open Tables
    Relative to MySQL Table Open Cache Status, this graph is useful in certain occasions like you want to identify if there’s a need to increase of your table_open_cache or lower it down if you notice a high increase of open tables or Open_tables status variable. Note that table_open_cache could take a large amount of memory space so you have to set this with care especially in production systems.
  • MySQL Table Definition Cache
    If you want to check the number of your Open_table_definitions and Opened_table_definitions status variables, then this graph is what you need. For newer versions of MySQL (>=5.6.8), you might not need to change the value of this variable and use the default value since it has autoresizing feature.

Conclusion

The SCUMM addition in the latest version of ClusterControl 1.7.0 provides significant new benefits for a number of key DBA tasks. The new graphs can help easily pinpoint the cause of issues that DBAs or sysadmins would typically have to deal with and help find appropriate solutions faster.

We would love to hear your experience and thoughts on using ClusterControl 1.7.0 with SCUMM (which you can download for free - ClusterControl Community).

In part 2 of this blog, I will discuss Effective Monitoring of MySQL Replication with SCUMM Dashboards.

Viewing all 385 articles
Browse latest View live