Quantcast
Channel: Severalnines - clustercontrol
Viewing all 385 articles
Browse latest View live

What’s new in ProxySQL?

$
0
0

Quite recently ProxySQL has changed the way it names new releases. To avoid confusion we’d like to go over it a bit. In the past, we had two branches: 1.4.x and 2.0.x where new features were added mostly to 2.0 and 1.4 was the old stable release. Now the way the naming works is major.minor.patch, so 2 is the major version and currently we have 2.2.0 as the current stable release. Let’s take a look at what the recent (as in couple of months) releases brought us.

ProxySQL 2.1.x

ProxySQL 2.1.0 was a major release when it comes to features added to it. The main one, definitely, is an introduction of integral Prometheus exporters, which means that there is no need anymore to use external scripts to scrap ProxySQL metrics and push them to the time-series database. Those metrics can be used with any external tool although a Grafana dashboard maintained by the ProxySQL team is available for use, ensuring that you will have all the most important metrics available.

Further changes were made to the ProxySQL cluster, a feature that makes it possible to cluster several ProxySQL instances and keep them in sync regarding the configuration. This is quite an important feature for any large-scale deployment as keeping tens of ProxySQL nodes in sync may be quite difficult otherwise. More metrics are now synced across the cluster, it is also possible to now to use SSL for the intra-cluster communication, ensuring that the data distributed across the cluster is properly encrypted and shielded from any kind of network sniffing.

On top of that, multiple improvements and optimizations were added, reducing the memory footprint and improving the performance of ProxySQL.

ProxySQL 2.1.1 is a patch release but it also comes with some new, fresh features. One of them is the improvement in dealing with prepared statements, where up to this point results had to be received by ProxySQL in one go. Starting from ProxySQL 2.1.1 those results can be buffered on the proxy’s side.

Additional change related to prepared statements, which ProxySQL 2.1.0 has introduced, is the routing. Prepared statements consist of two parts - prepare, where the statement is prepared, and execute, when it is actually executed. In the previous ProxySQL versions the target server was determined based on the PREPARE statement. It was routed to one of the backend servers and that server was also used to EXECUTE the statement. Starting from 2.1.0 ProxySQL will also route EXECUTE as per the query rules.

ProxySQL 2.2.x

ProxySQL 2.2.0 is the most recent version of ProxySQL at the time when this blog was being written. It is a minor release in the 2.x branch. It consists mostly of bug fixes but it also further improves prepared statements handling. To be precise, it adds support to process query annotations in prepared statements. Query annotations are the comments within the query:

SELECT /* Some text that is useful for some reason */ some_column FROM some_table;

which can be used to tag it or pass some information to the client or to a load balancer that can parse MySQL protocol. Such annotations may as well be used to pass index hints to the MySQL.

It is great to see ProxySQL developing. ClusterControl uses ProxySQL as one of the supported load balancers to enable our customers to build highly available and scalable architectures for their database clusters. For ProxySQL ClusterControl comes with full management over the dedicated UI, including adding new servers, importing users, deploying new ProxySQL instances and much more. If you would like to give ProxySQL a try using ClusterControl, you can download a trial version of ClusterControl directly from the Severalnines website. The trial license will allow you to use all of the features ClusterControl comes with, including database management, deployment, scaling, high availability, backups, monitoring and many more.


The Common MySQL error: “Got an error reading communication packet”

$
0
0

MySQL is the second famous database in the world according to the DB Engine website behind Oracle. What makes MySQL famous is probably because it is a very fast, reliable and flexible Database Management System. MySQL is also one of the supported databases in ClusterControl. You could easily deploy, scale, monitor and do a lot of things with ClusterControl.

Today we are not going to talk about any of those, but we will discuss one of the common errors for MySQL and possible troubleshooting tips. When working with tickets, a lot of time when we check the error reports or logs, we saw this line  “Got an error reading communication packet” quite frequently. We think it would be beneficial if we write a blog related to this error not only for our customers but also for other readers. Let’s wait no further, it’s time to dive more!

MySQL Client/Server Protocol

First of all, we need to understand the way MySQL communicate between client and server. Both client and server are using MySQL protocol which is implemented by Connectors, MySQL Proxy and also the communication between master and slave replication servers. MySQL protocol supports the features like transparent encryption via SSL, transparent compression, a connection phase and as well as a command phase.

Both integers and strings are the basic data types that are used throughout the MySQL protocol. Whenever MySQL client and server wants to communicate to each other or sending the data, it will divide the data into packets with a maximum size of 16MB and also will prepend a packet header to every chunk. Inside each packet, there will be a payload which is where the data types (integers/strings) play their parts.

Considering the CLIENT_PROTOCOL_41 is enabled, for almost every command that the client sends to the server, the server will reply any of the following packets as a response:

OK_Packet

This is the signal for every successful command.

ERR_Packet

The signal indicates an error for the packet.

EOF_Packet

This packet contains a warning or status flag.


How To Diagnose The Problems

Typically, there are two types of connection problems which is communication errors or aborted connections. Whenever any of these connection problems happen, the following sources of information are the good starting point for the troubleshooting and analysis:

Connection Errors And Possible Reasons

In the event of any connection errors happen and depending on the errors, it will increment the status counter for either Aborted_clients or Aborted_connects in the status variables. As taken from the MySQL documentation, Aborted_clients means the number of connections that were aborted because the client died without closing the connection properly. As for Aborted_connects, it means the number of failed attempts to connect to the MySQL server.

If you start the MySQL server with the --log-warnings option, chances are you probably would see the example of the following message in your error log. As you noticed, the message clearly said it relates to the abort connection, hence Aborted_connects status counter will be incremented in the status variable:

[Warning] Aborted connection 154669 to db: 'wordpress' user: 'wpuser' host: 'hostname' (Got an error reading communication packets)

Normally, unsuccessful connection attempts could happen due to the following reasons. When you noticed this, it possibly indicates that an unauthorized person is about to breach the database and you might want to look at it the soonest possible:

  • A client has no privileges to access the database.

  • A wrong credential has been used.

  • A connection packet that has incorrect information.

  • Due to the limit reached for connect_timeout to connect.

The status variable for Aborted_clients will be incremented by the server should a client manage to connect but get disconnected or terminated in an improper way. In addition to that, the server also will log an Aborted connection message to the error log. For this type of error, commonly it could be due to the following reason:

  • The client does not close the connection properly before exiting (does not call mysql_close ()).

  • The client has exceeded wait_timeout or interactive_timeout seconds.

  • The client program or application suddenly ended in the middle of data transfer.

Besides the reasons earlier, other likely reasons for both aborted connections and aborted clients issues could be related to any of the following:

  • TCP/IP configuration messed up.

  • The variable value is too small for max_allowed_packet.

  • Insufficient memory allocation for queries.

  • Faulty hardware like ethernets, switches, cables, etc.

  • Issues with the thread library.

  • Duplex syndrome issue whereby the transfer goes in burst-pause-burst-pause mode (if you use ethernet protocol with Linux, both half and full duplex).

How To Fix MySQL Communication Errors

Now that we learned a lot of potentialities that caused MySQL connection errors. Based on our experience, most of the time this issue is related to the firewall or network issues. It is also fair to say that it is not easy to diagnose this kind of issue. Nonetheless, the following solution might be helpful for you in solving this error:

  • If your application is relying on the wait_timeout to close the connection, it’s worth changing the application logic so that it’s properly closed at the end of any operation.

  • Making sure the value for max_allowed_packet is within the acceptable range so that the client does not receive any error related to the “packet too large”.

  • For connection delay issues that could be due to the DNS, it’s worth checking if you have skip-name-resolve enabled.

  • If you are using a PHP application or any other programming, the best is to make sure it does not abort the connections which are typically set at max_execution_time.

  • If you noticed a lot of TIME_WAIT notifications from netstat, it’s worth confirming that the connections are well managed on the application end.

  • If you are using Linux and suspect the issue is due to the networking, it’s best to check the networking interface by using ifconfig-a command and examine the output on the MySQL server for any error.

  • For ClusterControl users, you could enable Audit Log from the Cluster -> Security -> Audit Log. By enabling this feature, it could assist you to narrow down finding which query is the culprit.

  • Networking tools like tcpdump and Wireshark could be useful in identifying potential network issues, timeouts and resources issues for MySQL.

  • Regularly check on the hardware by making sure there are no faulty devices especially for ethernets, hubs, switches, cables etc. It’s worth replacing the faulty appliance to make sure the connection is good all the time.

Conclusion

There are a lot of reasons that could perhaps lead to the MySQL connection packet issues. Whenever this issue occurs, it will definitely affect the business and day to day operations. Even though this type of issue is not easy to diagnose and most of the time it is due to the network or firewall, it’s worth taking into consideration all the steps that have been suggested previously in order to fix the issue. We really hope this blog post could help you in some way especially when you face this problem.

MySQL Security with ClusterControl

$
0
0

If you are an experienced MySQL DBA, you probably already know how important MySQL security is. For you, security comes without any question - you already secured your database instances from the get-go: as soon as you installed them. Did you?

Well, if you did not, no worries: know the basics of securing MySQL and you should be on a good path. You already know about ClusterControl which is developed by known database ninjas from all across the globe and can help solve your MySQL problems in no-time, however, when it comes to security, everything isn’t very simple.

Why Secure?

“But wait”, - you say. Why should you secure your MySQL instances in the first place? Well, there are a couple of reasons why you should do that:

Controlling access to your MySQL instances and properly assigning privileges is a good way to prevent data breaches from the viewpoint that even if an account with less privileges would be breached, the consequences of such a breach would be way less severe than, say, a breach of an account that is a superuser.

However, MySQL security does not end with proper privilege assignment: the basics of MySQL security also include password management and account locking, also securing your backups. In order to secure your MySQL instances, you would first need to examine what attacks target your business the most (it would probably be SQL injection, which can be fended off by using prepared statements and not trusting user input), then decide what kind of security measures you would need to take to fend all of the attacks off, and employ them. You would also need to think about what do you want to achieve when you suspect that your account can already be a target of an attack.

How to Decide What to Do?

Obviously, everything sounds easier than it is, right? Just how do you decide what measures to employ when securing your MySQL database instances? However, don’t worry:

  • Does your application heavily rely on databases and users are constantly found to be executing SQL queries? Protect against SQL injection attacks - the easiest way to do that is to not trust user input (do not forward all of the user input straight to the database, use prepared statements when querying your database.)

  • Suspect that the primary way attackers could steal data is by logging in to your MySQL account? Use a strong password, preferably generated by a password manager. The reason why you should do this is simple: if your password is obtained by an attacker (that could be done via hacking into a system, then obtaining all of the data of the users), and if your password manager-generated password is hashed, hash cracking would be a very, very difficult task. The more complex your password is, the more difficult it will be.

  • Want to ensure that even if your account gets hacked, the attacker will do as little damage as possible? When assigning privileges, make use of the “must-know” scenario: that is, do not assign unnecessary privileges for users. In other words, only assign privileges that are absolutely necessary for users to do their tasks, but not more.

  • Worried that some of your employees might set weak passwords on their MySQL accounts? Worry not - you can enable strength testing of passwords by making use of the validate_password plugin: when the plugin is in use and, for example, an account is created, accounts must use secure passwords, strength of which is defined by a parameter called validate_password_policy which accepts three values: LOW, MEDIUM, and STRONG. A value of LOW only tests passwords for length, MEDIUM checks that passwords would be comprised of lowercase, uppercase, numeric, and special characters, and a policy of STRONG defines that any password that exceeds four (4) characters in length must not match any word in a specified dictionary file.

  • Suspected that your MySQL account can be a target of an attack? Lock the account, then investigate the incident. In this case, keep in mind that MySQL supports both ACCOUNT LOCK and ACCOUNT UNLOCK statements which can be used like so:
    ALTER USER ‘account_name’ IDENTIFIED BY ‘your_super_safe_password’ ACCOUNT LOCK;
    That’s it! Your account is now locked!

Obviously, there is more to it (check one of our older blog posts on MySQL security for more details), but these steps should give you a pretty good idea of what to do.

ClusterControl

Now MySQL security is closely related to performance and while the performance of MySQL isn’t really the primary focus of this blog post, it can be taken care of by employing ClusterControl: ClusterControl is a fully-fledged database management system that can take care of everything database-related ranging from backing up your data and monitoring & alerting, deployment & scaling, updates, configuration, performance management, etc. For example, head over to ClusterControl, and click on Performance Advisors: you will see a couple of categories including MySQL. In the MySQL category, you can make sure that the performance of your database never suffers:

In the screenshot above, you can see that ClusterControl provides a couple of advisors (connections, general, and InnoDB in this case) that tell you exactly what to do to make sure that your databases stay in shape and are as performant as never before.

We hope that this blog post has helped you improve the security of your MySQL database instances at least a little - while this blog post only provided you with the basics, keep them in mind and the security of your MySQL instances should be set on a good path.

Need Performance Advice? Turn To ClusterControl!

$
0
0

If you frequently find yourself working with any kind of database, it’s natural that you might need some advice on how to deal with them at least once in a while. At present, you might find yourself scouring through forums of DBAs and developers to find relevant advice, perhaps trying your luck finding and reading answers on StackOverflow, StackExchange, and related websites, however, when you need some really important information and advice, you might find yourself turning to tools and for a good reason: some of the tools that you might use will save you time, resources, and let you focus on your work instead of worrying about database performance. In this blog, we are going over how ClusterControl can help you solve some of your database performance problems.

What is ClusterControl?

ClusterControl is a popular database management system - indeed, it’s the only database management system you will ever need to use if you want to take control of your database performance, backups, security, configuration, deployment, or similar issues. ClusterControl can offer a lot of features:

  • ClusterControl offers support for multiple types of databases - no matter what you’d use: MySQL, MariaDB, PostgreSQL, TimescaleDB, or even MongoDB, ClusterControl can adequately take care of them all - with just a couple of clicks, you can ensure that all of your database instances are highly available, highly performant, and, of course, secure.

  • ClusterControl can be useful for a wide variety of people ranging from developers to system administrators and DevOps people, and, of course, tech directors as well.

  • ClusterControl is suitable for enterprise-level companies: it can offer enterprise-grade features like role-based access control, LDAP, and encryption of your data using SSL.

The team behind ClusterControl is a well-known group of database experts, so if you ever need support when facing any kind of issue, just ping them and your database issues should be solved within no time.

Oh, and did we mention that the team behind ClusterControl is a well-known group of database ninjas? 

Performance Advice with ClusterControl

When choosing ClusterControl, you can never go wrong when seeking performance advice. Part of the reason why is because ClusterControl comes with a bunch of powerful performance advisors - performance advisors that can help you take your databases to the next level. To access these performance advisors, log in to ClusterControl, then click Performance, and then Advisors. You will instantly see that performance advisors are split across a couple of different categories: the All category shows all of the performance advisors that are available, the s9s category shows the advisors relevant to Severalnines, the MySQL category shows performance advisors relevant to improving the performance of your MySQL instances, security advisors help you improve database security, InnoDB advisors are relevant to tables running the InnoDB storage engine, etc. This is how everything looks like:

Advisors can also be scheduled: clicking Schedule Advisor will take you to the developer studio where you can manage all of your scripts.

On the left, you will also be able to select the relevant category of scripts you are editing: click Schedule Advisor to finally schedule one yourself. Schedules, by default, are set to run every 5 minutes, but can be adjusted to one minute, one hour, one day, one month, etc.

Your schedules can either be basic or advanced too - advanced schedules will let you set the minute, hour, day, month, and a weekday your backups will be taken if you wish. Make sure to try the scheduling ability out!

As you can see, advisors come with code similar to javascript inside of them, so it might be tempting to try and develop one yourself. If you already have developed an advisor, you can import one or if you like one that exists inside of ClusterControl, you can also export one. Happy clustering!

Benchmarking databases 101 - part 2

$
0
0

In the previous blog post we have discussed a couple of best practices related to benchmarking. This time we would like to talk about the process itself. What can go wrong, what are the potential issues you have to consider. We will take a look at some of the real-world scenarios.

What do you want to test?

First thing we have to keep in mind is: what do we want to test? This will allow us to configure the benchmarks properly. Generally speaking we are talking about two main types of workload. CPU-bound workload, which will manifest itself in the high CPU utilization with very low disk activity. The other type is I/O-bound, which puts the pressure on the I/O subsystem. Typically, the real-world workload is a mix of those two, somewhere in between. The CPU-bound traffic usually can be tested if we have all in-memory workload, ideally read-only. What it means is that all data fits in the memory so reads do not hit disk and there are no writes that hit the disk as well. The I/O-bound workload can be easily tested by reducing the size of the in-memory buffers or disabling the impact of the filesystem-level caching, for example by using direct_io. Alternatively, you can just provision a data set big enough to reach the active data-to-memory ratio that you want to have. Ratio, that will ensure that the majority of the data has to be read from disk.

Initial tests of a new VM size

Let’s say that you are running a sizable database environment in a cloud. As it happens every now and then, a new type of VMs has been introduced. You would like to compare the performance of the old and the new one instance. How can one approach it? The typical case is that you probably do not want to build a long and detailed benchmarking process based on the production data and query mix. Sure, that’d be perfect but it is a bit of an overkill given the time needed to set it all up. What can be done instead is to use a synthetic benchmark that somehow resembles your application. Pro tip: some of the benchmarks, like SysBench, give you an option to customize the query mix. Sure, it will never be the same as running a real life production workload but you can tweak the (still) synthetic benchmark so that it will better resemble the traffic that you run on the production.

How do we want to approach the problem? First, we need to keep in mind that we want to test new hardware so that is what should change. Other variables should stay untouched as much as it is possible. Of course, you may want to tweak some of them to accommodate changes to the hardware - more CPU cores, more memory, faster disk but this should be the only change performed. Otherwise you should be using the same configuration, the same OS and database version. You also should prepare the benchmark data according to the requirements. If you want to test CPU performance, you probably want to run CPU-bound workload where data is stored in-memory. If you want to test the overall performance, you may want to tweak the data size in a way that the active data-to-memory ratio becomes similar to what you have in production.

Obviously, you want to automate the tests and execute them in several passes. This will help you to avoid common pitfalls as a busy neighbour in the virtualized environment. Some cloud providers, for larger instances, let you pick an option of sharing a single host across all your virtual machines. Some even let you choose dedicated hardware for a given VM. This will ensure that the interferences from the outside your VM are minimized and do not impact the performance of the VM itself.

Application tests

Another typical use case is to run application load tests. This is quite an important aspect as it allows you to determine how good your application scales and how big traffic your application can handle. From the database standpoint there are a couple of things to consider. First, are you doing a full stack application load test or is it going to be just a database-side test? The first, actually, is way easier for the database administrator because it does not really involve any additional work to set it up. Such a test, typically, is executed on the application level, going through several scenarios related to the application functionality. The database just accepts the traffic and deals with it. By running several passes you may be able to tweak database configuration to make the most out of it. Preparations, typically, are limited to setting up the database using a snapshot of the production data (latest backup, for example).

The database-side tests are more complex to prepare mostly because you have to prepare the queries. This may be quite tricky to do. In general, almost every database allows you to log the queries. This would be your starting point. Once you have the queries, you need to modify them so that they are able to be executed on the database. You are, most likely, using production data from a backup, therefore those cannot be “some” queries but the queries must have made sense somehow. The main challenge will be to sync the time queries have been executed and when backup has been created. If we have SELECT in the query, the database has to contain that table or row. If we have INSERT INTO…, the database cannot have a row created. Once you are done with it, the last step will be to execute the queries in the database. Again, to make it more realistic, you probably want to use a multi-threaded approach here. All depends on the database - in some cases, like MySQL, you can track the transaction ID in the logs, allowing you to group all the queries executed by a single transaction and then execute multiple transactions at the same time, emulating the real traffic.

I/O vs. network

Let’s talk about network attached storage. This typically is related to the cloud, public or private, but any kind of NAS may be affected. If we are looking at the I/O performance of a block storage, what you usually see is I/O operations per second (IOPS). This makes sense because the throughput depends on the number of operations per second and the size of data that is read in a single operation. What people tend to forget is that throughput for network attached storage is quite important. This is because the data will be sent, well, over the network. If you are going to run the benchmark over the network, for example, because you want to simulate the flow of the real application, where you connect to the database over the network, this may become a problem. We are not saying that it commonly is an issue but you should keep in mind that:

  1. Application will be sending the requests over the network to the database

  2. Database will be reading data over the network, from disk

  3. Database will be sending the result set over the network to the application server

All of this is happening over the network and, potentially, it may saturate it thus introducing a bottle neck. Of course, all depends on the network speed, NAS performance and several other factors but if it happens and goes unnoticed, it will skew the benchmark results and, ultimately, may result in incorrect takeaways from the benchmark.

Soft IRQ

This is another gotcha that can be easily overlooked. Let’s say you are interested in CPU performance so you are setting up a read-only, in-memory workload. You do not want to “waste” your CPU cores for the benchmark itself, as it also requires CPU to run, therefore you set up a separate “benchmark” node where you run the benchmark and connect over the TCP to the database server. In such a setup you have 32 cores available for the database and, let’s say, 16 cores for the benchmark. You proceed to execute the benchmark and you see only 2/3 of the cores on the database server fully utilized. What is going on? You tune the database configuration, nothing is changing. The problem you are experiencing is related to the network traffic. Network traffic is handled by the kernel through softirq. Every packet that is sent or received requires some CPU cycles to be dealt with. If all of the packets will be processed by a single CPU core, this may become a bottleneck. There are ways to deal with such issues through CPU affinity and irqbalance. On a new system, most likely, you will not experience this problem. It’s still always worth checking if you will notice that the database server is not utilizing all the cores it has available.

As you can see, benchmarking may become a tricky process but, just like we mentioned several times already, it is something that you do on a regular basis. Not daily, maybe, but it happens frequently enough to give it a bit of thought and make yourself familiar with potential problems and issues. If you have encountered difficulties through the benchmarking process we would love to hear from you. You can use the comments section below to share your stories.

What Do You Use To Monitor Query Performance?

$
0
0

If you have found yourself in the shoes of a database administrator or a database-savvy developer or a system administrator, you have most likely already heard about queries. Heck, it’s impossible not to, right? Queries are covered in the documentation of every database management system, from MySQL and PostgreSQL, to MongoDB. Coincidence? No. Queries are one of the most important things databases are based on - query performance is one of the main concerns to every database administrator.

How Do We Monitor Query Performance?

When it comes to database administration, different people have different skill sets and those different skill sets are one of the reasons why people might elect to monitor the performance of their queries differently:

For example, for a database-savvy system engineer, a simple EXPLAIN query would do. A developer might think “hmm, can’t I measure this by running a few queries when a button is clicked? Easy as that, right?”, however, a performance-hungry database administrator would probably elect to use different measures, such as tools relevant to the task. As far as tools are concerned, we obviously have a lot of options: some tools are designed to better help you form queries (we’re talking about SQL clients, CLI tools, and the like), while some tools offer a fully-fledged database management solution. One of those tools is ClusterControl - ClusterControl is a tool that can provide you with a lot of options ranging from query monitoring and alerting you once things go wrong to helping you back up your data and deploying your database clusters.

ClusterControl also comes with extensive performance management capabilities to let you keep an eye on the performance of your database clusters at any time. If you’re curious how everything looks like, here’s a schema analyzer:

“Wait..”, - we hear you saying. “Is that all there is? Why would I even need a schema analyzer? Surely there must be something else, I used the tool as a free version and now I’m paying for it, so I must get something else out of it too?” - relax! There is!

ClusterControl for Query Monitoring

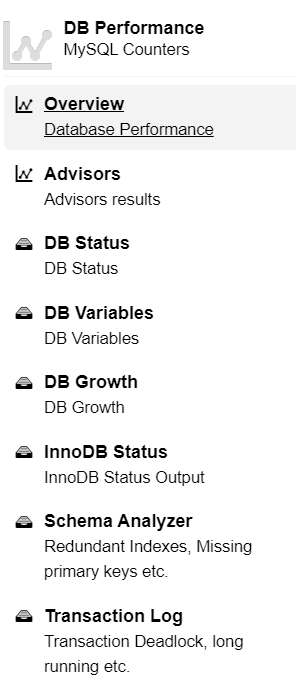
Look towards the left hand side of ClusterControl and you will be presented with a bunch of options that might be useful to improve your query (and consequently, database) performance:

The descriptions are pretty self explanatory: you can have an overview of the performance of your entire database cluster, ClusterControl can provide you with some advice on how to improve query performance, provide you with the settings relevant to your databases (we are referring to the “DB Status” and “DB Variables” part of the image), some are designed to provide some schema-relevant information, etc.: all of those things, as strange as it may be, will help you improve your database performance at least by a little bit: for example, observe the status of your databases and you will most likely know what needs to be monitored. Observe database variables and the InnoDB status and you will most likely know what might have caused your query performance to (sometimes drastically) drop down, observe the status of your schemas and the transaction log and you will see where you are wasting precious disk space and not getting any performance in return, what tables might be missing some indexes, what transactions are stuck in the hell of deadlocks, etc.

If you use ClusterControl to monitor your query performance, you can rest assured that you are in good hands because the team behind ClusterControl - Severalnines - is comprised of the best database experts in the world who are committed to helping you improve your database monitoring and performance capabilities wherever you might go. Give it a shot today and see how much the usage of ClusterControl can positively change your database performance - we are confident you will make good use of it.

What Monitoring Tool Do You Use To Keep An Eye On Your Database Clusters?

$
0
0

Choosing a monitoring tool that helps you keep an eye out on your database clusters might not be a very easy task. At least not until you know what you need out of it and what your options are. The majority of DBAs and software developers might think that they do not need one to begin with, but when they start working, the reality might be a little different.

Different monitoring tools usually offer different and sometimes really diverse sets of options: some monitoring tools might help you improve your database performance by simply advising you what to do once your queries slow down, while others act as fully-fledged database performance improving machines that help you improve your database performance no matter what you’d do. For example, ClusterControl developed by the known database experts over at Severalnines can help you manage your backups, monitor the performance of your queries and alert you once things go wrong, help you deploy and scale fully managed and highly available database clusters, help you ensure that your databases stay compliant with any regulatory requirements, ClusterControl also comes with automated performance advisors that can always tell you how better to improve the performance of your open source databases: isn’t that amazing?

Choosing a Tool

However, as good as some tools might be, first you need to decide what would you ask from a monitoring tool in the first place: do you need it’s help to ensure high availability of your database instances? What about performance? Security? What do you ask for from the tool to make it “good enough” for use? Perfect for use? Answer some of these questions and you will know whether you need a monitoring tool or not:

  • Is the manual monitoring of your database instances getting more and more tedious?

  • Do your employees complain about slow database performance?

  • Have you ever had (or do you now have) any issues with failed database clusters?

  • Have you ever wanted to automate the backup processes relevant to your database instances? Restore them automatically?

If you have answered “yes” to at least some of these questions, there’s a good chance you might benefit from a monitoring tool. However, monitoring tools these days are offered left and right, and it might be really hard to decide exactly what kind of monitoring tool you or your company needs. What do you do then? You would probably rely on how many people or companies trust the product already, wouldn’t you?

Don’t fret: there is a monitoring tool that will be useful to almost every company, from healthcare to software development, and that is developed by known database ninjas - ClusterControl. Here’s how it looks from the inside:

As you can see, first off you will see a bunch of database clusters. Clusters can have many different types: MySQL, MariaDB, Percona Server, MongoDB, PostgreSQL, TimescaleDB and others. ClusterControl will help you deploy or import a database cluster into the system, and then, help you manage it. As you can see, ClusterControl will help you with a bunch of different things:

  • It will help you observe the status of your database nodes:


  • Their topology too:


  • It will help you monitor the performance of your queries:


  • It will even help you back up your data!


    As you can see, ClusterControl can help you create or restore backups, also see all of your scheduled backups as well. Isn’t that amazing?
  • ClusterControl will also let you manage all of your database clusters under its hood, even showing you information relevant to the operating systems the database clusters are installed on!


    The cluster management part of ClusterControl will provide you with the ability to manage hosts, configurations, deploy and also import load balancers, have a glance over your database users and schemas, even create databases if such databases do not yet exist!
     

  • ClusterControl also has a so-called “developer studio” that lets you manage the scripts relevant to the management of your database instances - simply navigate to the Manage tab and click on Developer Studio:


    Bear in mind that you should have at least some javascript knowledge to make these scripts work, but with that, you’re golden!

ClusterControl has many other features unique to itself, but we will leave that to you! Be sure to check it out today and explore all of its monitoring features that will surely help your business grow and help your databases outperform their competition.

What’s the Use of Developer Studio in ClusterControl?

$
0
0

If you are a frequent user of Severalnines’ products, you have probably heard of one of its flagship products - ClusterControl. And since you have probably heard of ClusterControl, you have probably heard of at least one or more of its functions: ClusterControl can do a lot of things including monitoring your query performance, backing up your data, deploying load balancers like ProxySQL and others, it also comes with some database management capabilities. In this blog post, we are going to take a closer look at one of its features called the developer studio.

Why ClusterControl?

Before actually telling you what’s the use of this feature in ClusterControl, we should probably tell you why you should use ClusterControl to monitor your database clusters in the first place. You see, ClusterControl is developed by world’s leading database experts and they have put their heart and soul into the product: that’s the one the reasons why ClusterControl comes with so many extensive features including, but not limited to backup management, monitoring and alerting, it can help you deploy and scale your database nodes and clusters, it will also help you stay up to date with current data protection regulations, and tell you how best to improve the performance of your database clusters as well. Don’t be mistaken though - that’s not everything ClusterControl can offer for your business.

Developer Studio?

ClusterControl also has another feature that might be sometimes overlooked - that feature is called the Developer Studio of ClusterControl. The entire developer studio can be found once we hover over the Manage tab of ClusterControl (we need to be logged into our accounts):

Click on Developer Studio and you shall see all of the scripts currently imported into ClusterControl “separated” by categories:

For example, expand the InnoDB section (just below i_s and above p_s), then choose the file you want to edit from the dropdown menu you are given. You should see something like this:

In this case, some javascript knowledge should help - however, it’s not absolutely necessary since if you are a developer, you can probably already understand what’s written in this section of ClusterControl as-is. This file:

  • Includes a couple of relevant javascript files for its operation.

  • Describes itself (“var DESCRIPTION”) and also enables you to set how often should it be running by modifying the var MINUTES parameter.

  • Loops through all of the available MySQL nodes and checks if they are connected to ClusterControl.

  • Includes relevant logfile size checking code inside of itself and provides advice (you would need to check out the entire file to see its entire contents, but for the purposes of this blog post, this code snippet will do):


However, don’t think that all of the advisors are built on the base of a single code snippet - that’s not the case! For example, the CPU usage checking advisor will provide you with relevant advice that will depict whether your CPU usage is low or high by checking if your iowait, user, sys, and other parameters combined exceed a certain threshold that is allocated to produce a warning or other statuses (status codes can also include “Ok” which indicates that everything is ok with your database clusters):
 

Some advisors inside of the developer studio, for example, can be used to predict the disk usage, so be sure to look around for the advisors that you need - you will surely find the right one for your specific needs:

If you observe even closer, you will even be able to see that advisors in the developer studio are split into categories called “common” and s9s (depicting all of the advisors relevant to Severalnines.) As you can see, the Severalnines advisors are split into a couple of different parts in and of themselves: ClusterControl has advisors that can help with MaxScale, MongoDB, MySQL, NDBCluster, the advisors can also be helpful to make predictions or reports.

However, what’s also very interesting is the fact that all of the database advisors can be scheduled (and also saved or removed as well!):

Click Schedule Advisor and you will see that the scheduling mechanism present in ClusterControl can have two modes: basic or advanced:

A basic schedule of the advisors in the Developer Studio of ClusterControl will let you schedule your advisors to run every minute, five minutes, every hour, every day, or every month. An advanced schedule, on the other hand, will let you schedule minutes, hours, days, months, and even weekdays if you so desire. In this case, each advisor can be tagged as well to help you easily find them when you need to.

We can also display all advisors that are available - ClusterControl will also help us filter them by category (Severalnines advisors, MySQL advisors, security or schema advisors, replication advisors, performance, InnoDB, general or connection advisors, etc.):

Performance advisors, as we have already stated, can have multiple categories, and all of them are outlined below:

Summary

We hope that this blog post has provided you with some insight into the developer studio of ClusterControl and you will consider using it when you need to - however, if you find yourself needing some further advice, look around on the blog: we are 100% sure you will find some information that suits your needs. Happy reading!


Your DBA is Absent: What Do You Do?

$
0
0

If you are running a company, chances are that you already have a lot of things to take care of - you need to hire developers, designers, perhaps a couple of security experts, as well as database administrators. However, have you ever thought of what could happen if one or some of your database administrators could go missing? That is, take a couple of days, or even a week off?

So, if your DBA is absent, what do you do? Thankfully, you have somea couple of options: one of those options are tools. Tools, in this case, are related to database management tools: there are multiple companies that deal with database tooling. Some of the tools related to database management are better than others, of course, some worse. By choosing a database management tool, consider these factors:

  • Is the tool developed by known experts in the field? If the tool is developed by developers that are almost unknown to the industry, it’s probably not that good of a sign - on the other hand, if the tool is developed by world’s leading software or database experts, you’re in good hands!

  • Does the tool do what you ask from it? Does it solve your issues? Your database-related problems? Consider the fact that if you are dealing with performance-related issues and the tool only offers support for the high availability of your databases and the security related to them. What do you do then? Do you have a sheet of what you require from the database tool itself? You should!

  • Perhaps most importantly of all, would the tool of your choice even be able to replace the database administrator in your company or organization? Perhaps it would be more of a hassle than it’s worth? Is it even performing to the best of its ability? What do other people think of the tool? Did reputable companies use it?

Once you have considered the aforementioned factors, you should be able to easily choose a database tool from those available. Look around on the web and you should see at least a couple of database management tools - one of them should be ClusterControl developed by Severalnines or CCX also developed by the same company.

ClusterControl to the Rescue!

If you find yourself searching for a very good database management tool, you have probably already heard of ClusterControl developed by known database experts over at Severalnines. Here’s how the tool looks like from the inside:

If your DBA is absent, you probably need a tool that can take care of at least the majority of things that are taken care of by a database administrator that might be present in your company: as you can see, ClusterControl comes with a lot of features too! ClusterControl, when launched (and once you have logged in to the system, of course), will display what’s happening inside of your database servers (you will be able to observe the server load), it will let you know how the queries on your database instance are doing, what’s happening with the performance of your database instances, and it will even let you back up your data - automatically, mind you! We will start from queries and move on from there:

  • If your DBA is absent, how can you know how the queries of your database instance are doing without running queries that depict your database status? Well, with ClusterControl that’s easier than you could ever imagine - simply switch to the Query Monitor tab and you will be able to observe top queries, what’s happening with your database connections, and you will also be able to observe query outliers:


    The top queries tab will let you know what’s happening with your queries in your database instance at present - on what database they are running on, how many rows are being sent or examined according to the query, are they creating temporary tables, what’s their execution time, and when were they last seen too. Query outliers tab, on the other hand, will display all of the queries that deviate more than 2 sigmas from the response time.
  • Once your DBA is absent, you might also discover that it’s getting harder to get some advice relevant to database performance, storage engines, indexes, and whatnot - in this case, worry not: ClusterControl’s performance advisors will save the day.


    ClusterControl performance advisors, as you can see, are split into a few different categories - ClusterControl can advise you how to better optimize your MySQL schemas, how to advance your security procedures, what to do regarding replication, how to optimize performance, and so much more! In this case, we also see that all advisors can be also edited (for that you would need to have some knowledge of javascript) or disabled if you don’t want to use them at all - why use something that you don’t have a need for? Before disabling them though, make sure they are unnecessary.
  • If your DBA is absent and you need to observe settings relevant to your database instances and perhaps change them, what do you do then? In this case, you don’t ever need to worry too! ClusterControl has a section especially for that - it’s called “Database Variables” (or DB Variables for short) and it depicts, you guessed it, all of the variables relevant to a certain database instance. For example, if you want to modify your InnoDB parameters, simply start typing InnoDB… and ClusterControl will filter the list without you even needing to blink:


    Once you have figured out what the parameters for a given database instance are, you can make use of the Advisors to know whether to change them or not, and change them if necessary. How’s that for a virtual DBA?
  • You might also want someone capable of optimizing your schemas and keeping an eye on indexes, primary keys, and the like, however, it would be pretty hard to do without a DBA at your disposal. Again, worry not because ClusterControl also has a dedicated schema analyzer available for you to use! Excited yet?


    The schema analyzer, in this case, would observe all redundant indexes inside of your databases, provide you will a list of all of the columns in a covering index, and, obviously, provide you with some recommendations on what you need to do to make the indexes actually help your database instances and for them to work properly.
  • What happens once you notice that you might have a deadlock and your DBA is not around? Well, you wait for him or her to come back, and then voice your concerns, right? Not with ClusterControl: the tool has a transaction log letting you know everything about deadlocks related to transactions, long running queries, and the like:


    Still miss your DBA?

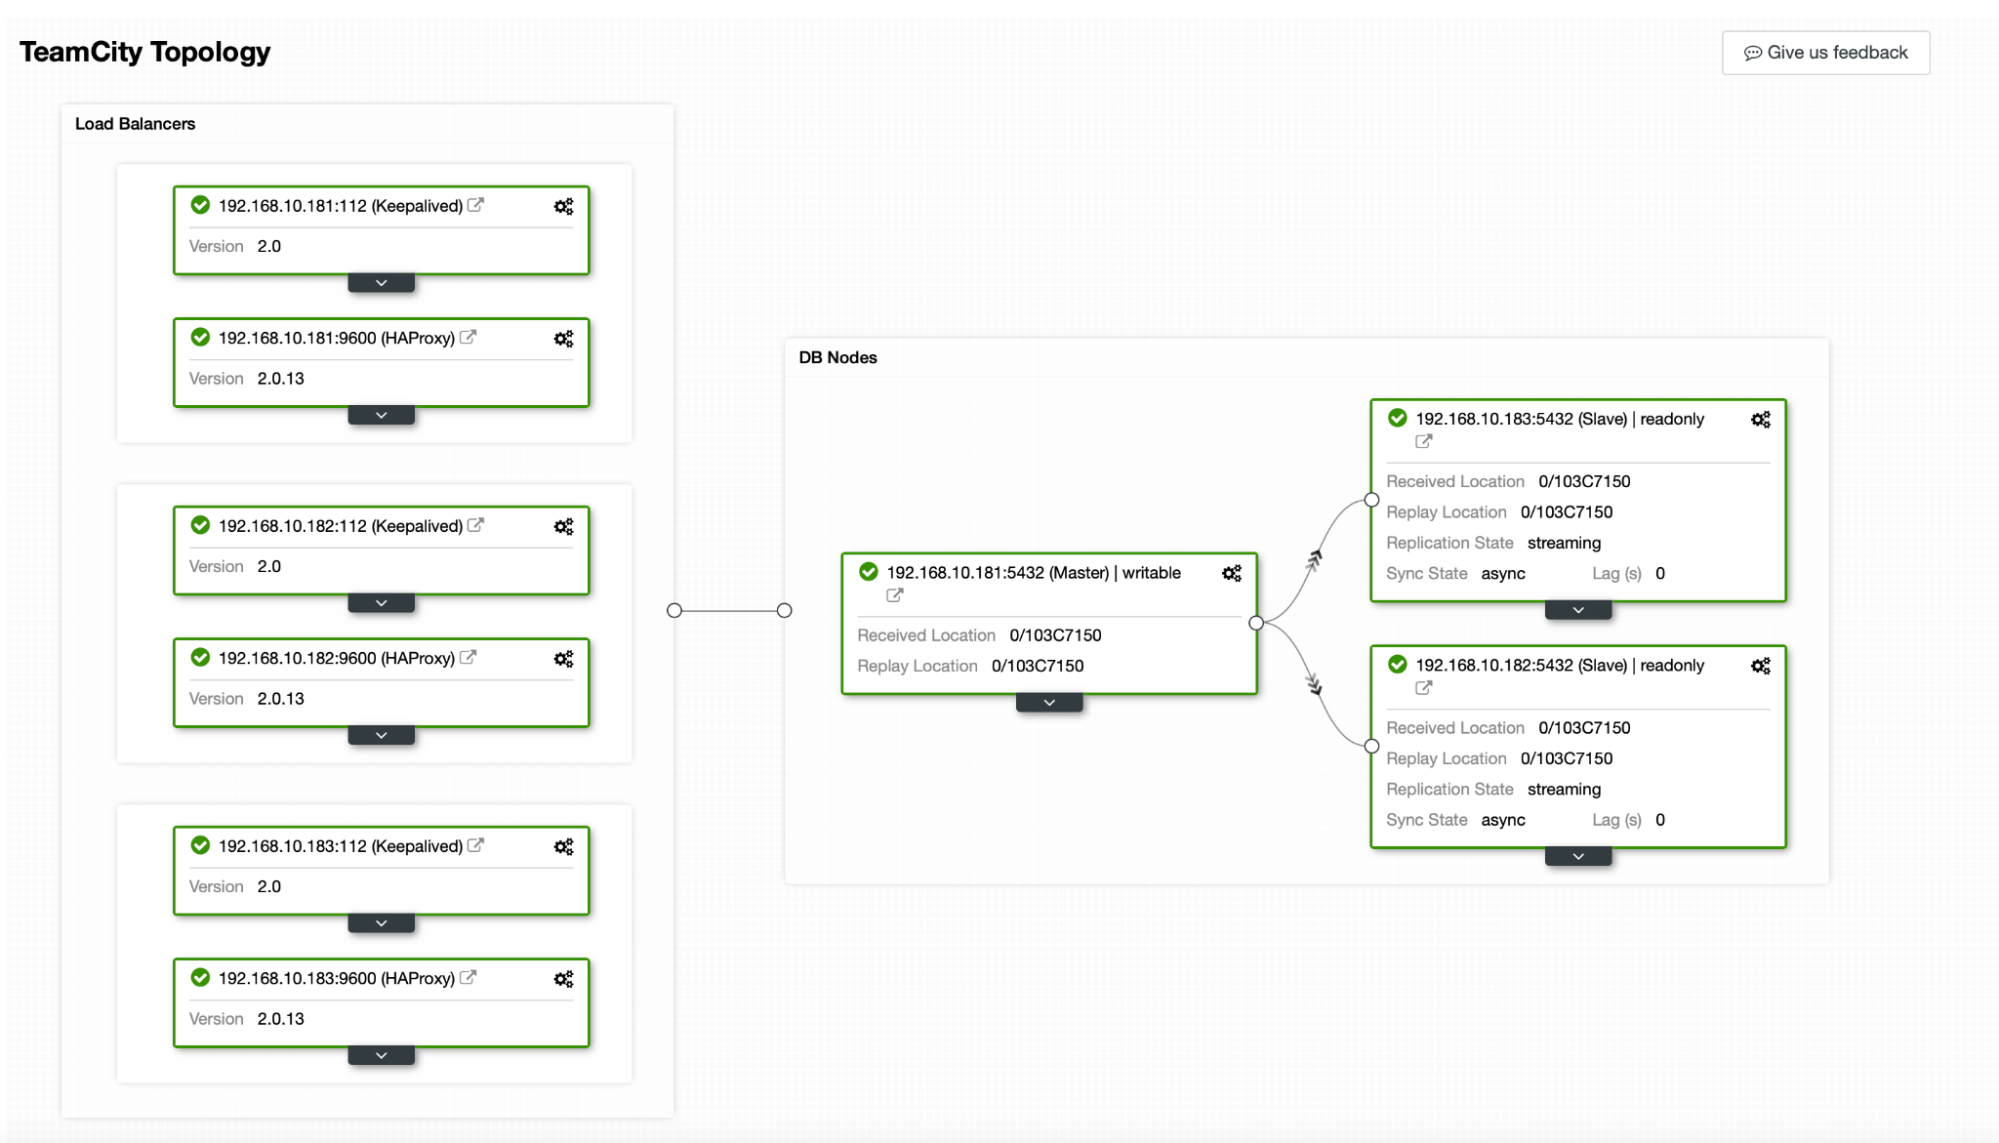
  • Sometimes you might need to ask your DBA: “wait, what is our database topology? Are our database nodes writable, or are they read-only?” but he or she might be missing. Oh no! What do you do now? Obviously, you turn to ClusterControl - it shouldn’t be surprising that it’s also able to provide you with the entire topology of your database cluster, is it?
     

ClusterControl is also developed by the leading database experts at Severalnines, so when choosing it as your database management option to replace your database administrator, you will never go wrong. Give ClusterControl a try today, reach out to support, or read the docs if you need any further information about any of the products that Severalnines can offer, and we will see you in the next blog!

ClusterControl supports Redis with version 1.9

$
0
0

If you are a frequent user of ClusterControl, you might have heard that the Severalnines team recently released ClusterControl version 1.9.0. The full changelog can be found here, but in this blog post, we are going to highlight some of the new features we introduced with this version. Excited yet? Let’s get rolling!

What’s new with ClusterControl 1.9?

ClusterControl 1.9.0 (or 1.9 for short) is the latest major version release of the AI-driven database automation platform. The highlight of this version is the support for high-availability Redis. The Severalnines team has also introduced an enhanced query monitoring implementation, providing even better insights into your database performance.

A deeper dive into what’s new

Now that we have got you hooked and you know some of the things that ClusterControl 1.9 entails, we should dive deeper, shouldn’t we? In a nutshell, here’s what new in ClusterControl 1.9 - it all comes down to a few improvements in the Redis, PostgreSQL, and query monitoring space:

High-availability Redis is now available

Users can now deploy Redis v5, v6 nodes with Sentinels - ClusterControl supports one primary and up to five replicas. You can  find out how to deploy Redis nodes from our next generation web application here. 

PostgreSQL pgBackRest has been overhauled

  • Some of the improvements to pgBackRest include the ability to import existing PostgreSQL nodes, unregister pgBackRest, but keep its configuration files around, or completely remove it.

  •  PostgreSQL can now be backed up on replica or standby nodes, users can also install pgBackRest at the time of deployment of the cluster.

  • ClusterControl 1.9 supports multiple pgbackrest methods including pgbackrestfull, pgbackrestdiff, and pgbackrestinc.

Query monitoring is now lighter and more informative

ClusterControl also introduced a new agent-based Query Monitor for both MySQL and PostgreSQL - ClusterControl’s agent-based architecture provides  optimized data collection and processing for query analytics by the agent. It also reduces load and bandwidth needed on the database server compared to an agentless setup. ClusterControl also comes with other improvements, namely:

  • The ability to install and remove agents on their nodes.

  • A new Query Workload overview showing people query digests, their latency, throughput and also concurrency.

And one more thing: you can now upload backups to any cloud storage provider that is compliant with the AWS S3 API!

What’s on the horizon? ClusterControl’s next generation web application

There’s no doubt - ClusterControl 1.9 gives your database instances more power than it ever did before. But the Severalnines team is also working on improvements to CC’s web application. Here’s a quick sneak peek:

The new web application, v2, is being built on a modern framework that’ll extend the CC web interface’s functionality. It’s current preview is where you’ll be able to deploy Redis Sentinel clusters. Upcoming improvements will include the addition of management operations for MySQL Replication, Galera, and NDB, PG, and MongoDB, e.g. deployment, imports and backup operations, as well as other functionality, e.g. global filtering. It’s simple to access and switch between v1 and 2, so check out how to access here!

Wrapping up

As you see, CC 1.9.0 is chock-full of feature enhancements that take its capabilities to the next level, including the introduction of Redis as a database option. Remember to check out our changelog to get the details on everything we’ve done since its initial release. For those already using ClusterControl, here is how you get the latest version. Not a ClusterControl customer yet? Try it free for 30 days. Otherwise, stay up-to-date by subscribing to our RSS feed or following us on Twitter. See you in the next blog!

Still Looking for a Machine That Unleashes the Power in Your Database Instances?

$
0
0

If you are a frequent reader of database-related blogs, you have probably heard about the Severalnines blog. Well, we mean, you are reading it right now, aren’t you?

And if you’re reading the Severalnines blog, you probably already know a thing or two about products developed by Severalnines: obviously, the flagship product is ClusterControl, but we also have a couple of other things, such as CCX, and Backup Ninja as well! A while ago we have written a blog on the CCX blog titled “Are You Looking for a Machine That Unleashes the Power In Your Database Instances?” where we have told you how you should go about using one of the tools developed by the team over at Severalnines - CCX - to achieve your database monitoring and backup goals. This blog will be a little different, but still a little similar: this time, we will tell you how you can use ClusterControl developed by Severalnines to turn it into a machine that solves your database problems as well.

Why ClusterControl?

Before telling you how you should use the product developed by Severalnines to solve your database-related problems, we should probably tell you why should you use it in the first place.

You see, ClusterControl is developed by the database experts over at Severalnines. Severalnines is primarily consisted of former MySQL staff, but we have other database experts (for example, MongoDB) on board as well which means that you can be sure that the tools developed by the team will be in the best quality possible. Don’t believe us? Check out our customer list: the Severalnines support team takes care of all kinds of issues across a very wide variety of industries: is your company in the healthcare business? ClusterControl can help. Are you a dean of a university faculty and find that your faculty needs to solve some issues relevant to database automation? ClusterControl can help as well (we mean, we have University of Antwerp in our customer list, they didn’t go wrong when choosing us as their trusted database partner, why should you?), we even have AVG (yes, the anti-virus company) on board: all of those companies entrust their most critical database infrastructure to Severalnines, and after you have read this blog post, we are sure that you will be confident enough to add your company to the list!

What ClusterControl Can Do For Me?

“Alright”, - we hear you saying. “I do know what your tool does and who uses it, but what’s in it for me? Why should I use ClusterControl instead of using a tool X developed by some company that may be close to the location of my company?” We are glad you ask that. Here are some key reasons you should consider using ClusterControl and adding ClusterControl to the list of your trusted database advisors:

  • ClusterControl can, of course, help with the monitoring of your database instances. We mean, launch your installation of ClusterControl, log in, and you will see a whole new world of database monitoring open right in front of your eyes - impressive, right?


    In this case (on the main page), you will see that ClusterControl will provide you with the details (overview) of what’s happening inside of your database clusters: you will instantly see the load of each one of your database servers that you are monitoring, you will see the amounts of connections, selects, updates, deletes, inserts and overall queries per second, you will also be able to observe the topology of your database cluster and other things. Perhaps it all sounds very complex, but don’t fret - with ClusterControl on your hands, your database instances will achieve performance at the levels you only dream of. How? Read further..

  • ClusterControl, among other things, also comes with a top-notch query monitoring system that depicts how your queries are doing too - we hope that your team were monitoring the queries inside of your database instances, didn’t you all? Even if not, no worries here as well:


    ClusterControl is also able to depict top slow and long-running queries allowing you to see what query on what database is running, what rows it’s sending and examining, what’s happening with your temporary tables, what is the execution speed of your queries (the execution speed is also split into three different parts including the max speed and average speed as you can see), ClusterControl’s query monitor also lets you see the amount and contents of current database connections and query outliers (queries deviating more than 2 sigmas from the normal response time.) Again, it all may sound very complex, but don’t fret: as already mentioned before, ClusterControl will let you see all of the queries that interact with your database instances, and you will, of course, be able to kill all of the processes that you desire to kill. For example, notice that a particular query is hogging resources? Alright, head over to ClusterControl and kill it! Wow, that was easy, wasn’t it?

  • In order to fully unleash the power hidden inside of your database instances, sometimes you might need some database-related advice. What do you do? You turn to your trusted colleagues - DBAs.. Yes? Well, sometimes.. Not until you have used ClusterControl! Leave DBAs alone and use ClusterControl instead: ClusterControl has a specialized Advisors section too!


    Advisors have multiple categories - advisors specific to Severalnines, MySQL advisors, security advisors, schema advisors, replication and performance advisors, even some advisors relevant to the storage engines of your MySQL instances! (InnoDB) - and that’s not even it… Advisors can be edited (for that, you would need some javascript-ish knowledge or disabled as well.) for example, here’s how the code of one of the advisors looks like: impressive, yeah?


    You can even select others on the left hand side - see how it all starts to work together so nicely, yeah?
    Advisors, in a nutshell, provide advice that will certainly help you improve your database performance: choose what kind of advisor you want to work with (you can choose from categories as already previously mentioned), then enable or disable one of them - that’s it - that’s just as much as it takes. You should be done! Advisors should be running properly.

  • Notice that your database instances are slow? You might want to take a look at your schema as well. For that, ClusterControl also has a Schema Analyzer that depicts MyISAM tables, indexes that are redundant, or tables without primary keys, etc.:


    Yes, that means that ClusterControl developed by Severalnines also lets you take a look into tables that you did some work on in the past (e.g. added indexes on): to make sure that your indexes are added properly and your indexes are actually helping you unleash the full power inside of your database instances, keep an eye on the Schema Analyzer as well.

  • Want to unleash the power of your database backups (e.g. take them automatically or monitor them) as well? ClusterControl lets you do that too!


    ClusterControl, in this case, can help you create a backup, restore your backup or schedule one as well. For example, here’s how the backup restoration window should look like:


  • ClusterControl can do so much more! And yes, it takes care of the security of your database instances too:
     

As you can see, ClusterControl can do a lot of things that help you unleash the entire power of your database instances: take a look into its functionality, and see how the tool developed by Severalnines can help you take your databases to the next level! Once you have taken a look, stick around the blog since we have more things prepared for you: see you in the next blog!

Microsoft SQL Server on Linux coming soon to ClusterControl

$
0
0

It is our mission to provide support for the most popular databases so that ops teams only need one control plane to automate their database lifecycle operations. That’s why we’re excited to announce our upcoming support of SQL Server 2019.

ClusterControl will initially support deployments on Ubuntu 20.4 and CentOS 8, giving users the ability to run it on-prem, in the public cloud, or both. In this post, we’ll give you the highlights of its initial release, as well as what to expect in the future. 

ClusterControl and SQL Server on Linux

Microsoft’s inclusion of SQL Server on Linux distributions has opened it to a new generation of development and ops professionals. But what’s been missing is a vendor and environment agnostic tool that allows users to automate its operations; enter ClusterControl. Here are the important highlights for our initial release:


  • We’ll provide support for Single node instances of SQL Server 2019 on CentOS 8 and Ubuntu 20.04.

  • You’ll be able to deploy your instances where you want: in on-prem, cloud, and hybrid setups.

  • You’ll be able to perform full, differential, and transaction log backups, and verify them.

  • You’ll be able to monitor the state of your instances with Prometheus.

We’ll also add functionality over time, including high-availability, and performance and query monitoring.

Wrapping up

Scheduled for around the end of September 2021, ClusterControl support of SQL Server on Linux will provide our customers the opportunity to run SQL Server implementations without fear of vendor or environment lock-in. Our initial release will introduce core features and act as a starting point for additional development.

A lot can happen between now and then, so subscribe to our RSS feed or follow us on Twitter and LinkedIn to stay up-to-date. We’ll be putting out a lot more related content as we draw nearer to its release. Talk soon!

Introduction to SQL Server on Linux

$
0
0

Microsoft SQL Server is an excellent choice for a relational database with key benefits including performance, security, reliability, and total cost of ownership. A few exciting features of SQL Server are outlined below:

  • SQL Server supports Python, R, Java, Spark with the combination of relational database and Artificial Intelligence (AI)

  • Database administrators and developers can choose the supported platform and language.

    • Available Platforms: Windows, Linux( RedHat, SUSE, Ubuntu), Docker containers.

  • Available Languages: C\C++, PHP, Java, Node.js, Python, Ruby.

  • SQL Server is the best relational database according to performance benchmarks. TPC-H 1TB, 10TB and 30TB SQL Server is considered the most secure database as per the National Institute of Standards and Technology (NIST). It supports Transparent Data Encryption, Column level encryption, Static and Dynamic data masking, Data discovery and classification, Certificates, SSL. SQL Server also allows for accessing external data from Hadoop clusters, NoSQL databases, Oracle, SAP Hana, Big data as external tables using PolyBase as well. SQL Server provides high availability and disaster recovery solutions such as the restoration of backups, log shipping, Always On Availability groups with multiple secondary replicas in synchronous and asynchronous data commit

SQL Server On Linux - Introduction


Image Reference: Microsoft cloud blogs

When we think about SQL Server, we always think about it as running on Windows. Starting from SQL Server 2017, you can run it on Linux as well.  

Microsoft executive vice president Scott Guthrie states: “Bringing SQL Server to Linux is another way we are making our products and new innovations more accessible to a broader set of users and meeting them where they are”.

SQL Server on Linux is an enterprise-ready relational database with industry-leading capabilities and robust business continuity. It combines the Microsoft SQL Server on a best-known and most-used open-source operating system Linux.

Supported SQL Server Flavors on Linux

  • Supported SQL Server flavors on Linux include Red Hat Enterprise Linux, SUSE Linux, Enterprise Server, Ubuntu, Kubernetes clusters, and Docker containers. That means that you will no longer have to worry about what Linux servers does your SQL Server support when choosing one!

The following image gives a high-level process model overview of the platform abstraction layer and its communication with Linux OS:

Image Reference: Microsoft cloud blogs

 Why Should You Run SQL Server on Linux?

You might be curious to learn more about SQL Server on Linux and wonder whether you can use it for critical databases. Therefore, let me tell you a few reasons you should:

  • Open-source platform:Linux is an open-source operating system. The Linux operating system requires low computing resources (RAM, CPU) if we compare it to other operating systems. Therefore, you can reduce the cost of an operating system license.
  • SQL Server license:You can move your existing Windows-based SQL Server Licenses to SQL Server at Linux without any additional cost. Therefore, you can plan to move Linux based SQL Server without worrying about licenses.
  • Enterprise-level features: SQL Server on Linux is an enterprise-ready database. It has features such as high availability and disaster recovery with Always On Availability Groups. You can also combine Always-on availability groups between Windows and Linux operating systems.

  • Simple backups: You can restore your database from Windows to Linux and vice-a-versa using a simple backup and restore method. Therefore, you can quickly move databases without worrying about the underlying operating system with multiple database environments.

  • Industry-leading performance: SQL Server Linux is tested on the TPC-E benchmark. It is ranked number 1 in the TPC-H1 TB, 10TB, 30 TB benchmarks.

  • Security: As per the Microsoft docs, the NIST institute rated SQL Server on Linux as the most secure database.

  • Simple installation: SQL Server on Linux supports command-line installation. It is quick, simple, and comparatively faster than installing on Windows Server.

  • Database upgrades: You can move out of unsupported SQL Server versions such as SQL Server 2008 R2 into SQL Server 2017 or 2019 Linux with simplified database migrations.

  • Quick deployments: SQL Server on Linux supports a docker container where you can deploy SQL Server within a few seconds. It helps developers build a container with SQL Server image and test their code without waiting for virtual machines or higher-end servers. The container can be deployed in the Azure cloud infrastructure. You can also use Kubernetes or Docker Swarm as an orchestration tool for managing many containers.

  • Similar functionality to T-SQL: The SQL Server on Linux uses similar T-SQL scripts, maintenance plans, backup mechanisms and routine administrative tasks. The users with Windows background can quickly get familiar with it without realizing much difference in the underlying operating system.

  • Data virtualization hub: SQL Server on Linux can act as a data virtualization hub by setting up external tables from Hadoop, Azure Blob Storage accounts, Oracle, PostgreSQL, MongoDB, and ODBC data sources.

  • Platform abstraction layer: Microsoft introduced a Platform Abstraction Layer (PAL) for database compatibility into a Linux environment. The PAL aligns operating system or platform-specific code in a single place. For example, the Linux setup includes about 81 MB of the uncompressed Windows libraries for SQLPAL.

Features of SQL Server on Linux

This section explores a few key features of the SQL Server on Linux that can justify migrating to SQL Server on Linux.

  1. Performance

SQL Server on Linux offers Hybrid Transactional Analytical Processing, a.k.a. HTAP, for fast transaction throughput, responsive analytics. The HTAP uses the following performance features:

  • In-Memory Online Transaction Processing (OLTP) - It contains memory-optimized tables and compiled stored procedures for improving the performance of heavy transactional applications. It can increase workload performance up to 30-100x.
  • Columnstore indexes - SQL Server on Linux supports the Columnstore index and the Rowstore indexes to improve  the performance of analytical queries.

  • Query store- The query store helps database administrators to monitor query performance and query regressions, their execution plan changes over time and reverts to the plan with the lowest query overhead.

  • Automatic tuning - In automatic tuning, SQL Server monitors the query performance based on the query store data. If it finds a new query plan causing an impact on performance, it reverts the old plan automatically without DBA intervention.

  • Intelligent query processing - There are features available from SQL Server 2019 for automatically improving query performance based on query workloads and collected statistics. It contains the following features:

    • Adaptive joins - SQL Server can automatically and dynamically select the join type as per the number of input rows.

    • Distinct approximate count - SQL Server can return an approximate count of the distinct number of rows with high performance and minimum resources.

    • Memory grant feedback- Sometimes we observe a spill to disk while executing large resource-intensive queries. It wastes assigned memory and impacts other queries as well. Therefore, the memory grant feedback helps SQL Server to avoid memory wastage based on the memory feedback.

    • Table variable cardinality - SQL Server on Linux can use the actual table variable cardinality instead of a fixed guess.

  • Security

Security is a critical feature for a relational database. Therefore, SQL Server on Linux contains advanced security features in all editions, including the standard edition:

  • Transparent Data Encryption (TDE) - The TDE features encrypt data files and database backups in rest. It protects the database from any malicious activity where the intruder grabs data files or backup files for accessing data.

  • Always Encrypted - The always encrypted features allow only applications to view and process the data. The developers and database administrators (highest privilege) cannot view original data (data that is decrypted). The encryption and decryption both take place on the client drivers. Therefore, data is encrypted both in-rest and in-motion.

  • Column-level Encryption - In column-level encryption, you can use certificates to encrypt the columns with sensitive information such as PII data and credit card numbers.

  • SQL Server Certificates - You can use SQL Server certificates for securing and encrypting all connections to the SQL Server on Linux.

  • Auditing - Auditing tracks specific events for capturing any malicious activity. You can view the event logs and audit files to help you investigate any data breaches.

  • Row-level Security - Row-level security allows users to view data based on user credentials. For example, the user can view only rows he is allowed to see. It prevents users from viewing or modifying other users' data.

  • Dynamic Data Masking - Dynamic data masking can mask the data in a column based on the masking functions. It can work with data such as email addresses, credit card numbers, social security numbers. For example, you can mask credit card numbers to display only the last four-digit numbers in the format of XXXX-XXXX-XXXX-1234.

  • Data Discovery and Classification - It is essential to identify, label and report sensitive data stored in your database. The Data discovery and classification tool can generate a report to discover sensitive data such as PII and classify the data based on the sensitivity.

  • Vulnerability Assessment - The vulnerability assessment can identify configurations and database design that can be vulnerable to common malicious attacks for your instance and database.3. High Availability

For a production database, the high availability and disaster recovery mechanism is very essential. Therefore, SQL Server on Linux includes the following high availability features:

  • Always on availability groups - You can configure availability groups between standalone SQL Server on Linux instances in an asynchronous way.

  • Always On failover clusters - SQL Server on Linux supports a pacemaker for providing a synchronous copy of the database in the same or a different data Centre. You can extend your Windows-based SQL Server Availability group with a Linux SQL Server replica node.

  • Log Shipping Using the SQL Agent- The log shipping works on the transaction log backups to provide warm stand-by data copies without complex configurations.

  • Containers Orchestrated Tools - You can use container orchestrated tools such as Kubernetes for enhancing SQL Server availability. It ensures that if a specific node of SQL Server is down, another node is bootstrapped automatically. Further, you can use always-on availability groups in Kubernetes clusters.


  1. Machine Learning Services

SQL Server on Linux supports machine learning models using R and Python scripts for data stored in your databases. Machine learning can help you do real-time predictive analytics on both operational and analytic data. You can add data science frameworks PyTorch, TensorFlow, Scikit-learn for enhancing Automation tasks capabilities using machine learning.

  1. PolyBase

SQL Server on Linux supports PolyBase, where you can configure external tables with Oracle, Big Data, SAP HANA, Hadoop, NoSQL Databases as a data virtualization tool. It eliminates the ETL transformation where you need to import or export data into SQL Server before querying it.

  1. Graph Database

SQL Server on Linux supports graph databases where it stores data as entities (nodes) and relationships(edges) for semantic queries

  1. Full-text Search

The SQL Server Linux supports full-text services for executing queries against the text data efficiently.

  1. SQL Server Integration Service (SSIS) Packages

SSIS packages can connect with the SQL Server on Linux databases or SQL Server in a container similar to the Windows-based SQL Server instance.

Conclusion

This article provided you with some high-level introduction to SQL Server on Linux, we went through its features. It lists why organizations should consider using SQL Server as their database solution on Linux operating systems and containers.

In subsequent articles, we will explore more useful SQL Server features on Linux and explore them practically.

Overview of SQL Server Requirements on Linux Requirements and Comparison with Windows SQL Server

$
0
0

Overview of SQL Server on Linux requirements and comparison with Windows SQL Server

In a previous article, Introduction to SQL Server on Linux, we learned about the SQL Server on Linux overview, features, performance, and high-availability concepts at a high level. Traditionally, SQL Server is a Windows-based relational database engine. Microsoft introduced SQL Server 2017 in both Windows and Linux platforms. The question is how they compare.  

This article will walk through the differences. Let’s begin our journey into SQL Server on Linux.

Note: This article focuses on SQL Server 2019 version for comparisons on both Linux and Windows SQL.

Supported platforms for SQL Server on Linux are the following:

  •  Red Hat Enterprise Linux 7.7 - 7.9, or 8.0 - 8.3 Server

  •  SUSE Enterprise Linux Server v12 SP3 - SP5

  • Ubuntu 16.04 LTS, 18.04 LTS, 20.04 LTS

  • Docker Engine 1.8+ on Windows, Mac, or Linux

What are the system requirements for SQL Server on Linux?

SQL Server has the following minimum requirements for SQL Server for Linux:

  • Processors: x-64 compatible

  • Memory: 2 GB

  • Number of cores: 2 cores

  • Processor speed: 2 GHz

  • Disk space: 6 GB

  • File system: XFS or EXT4

  • Network File System (NFS): NFS version 4.2 or higher

Note: You can only mount the /var/opt/mssql directory on the NFS mount.

What are the supported editions of SQL Server on Linux?

In this section, we talk about different editions of SQL Server on Linux, and their use-cases. These editions are similar to the SQL Server on Windows environment.

Enterprise

The Enterprise edition is Microsoft’s premium offering for relational databases. It offers all high-end data center capabilities for mission-critical workloads along with high availability and disaster recovery solutions.

Standard

The Standard edition has an essential data management and business intelligence database.

Developer

The Developer Edition has all features of the enterprise edition. It cannot be used in production systems. However, it can be used for development and test environments.

Web

The Web edition is a low-cost database system for Web hosting and Web VAPs.

Express edition

The Express edition is a free database for learning and building small data-driven applications. It is suitable for software vendors, developers.

Editions of SQL Server on Linux and Windows

The editions specified below apply to both Windows SQL Server and Linux:

Feature

Express

Web

Standard

Developer

Enterprise

Maximum relational database size

10 GB

524 PB

524 PB

524 PB

524 PB

Maximum memory

1410 MB

64 GB

128 GB

Operating System Maximum

Operating System Maximum

Maximum compute capacity – DB engine

1 socket or 4 cores

4 sockets or 24 cores

4 sockets or 24 cores

Operating system maximum

Operating system maximum

Maximum compute capacity – Analysis or Reporting service

1 socket or 4 cores

4 sockets or 24 cores

4 sockets or 24 cores

Operating system maximum

Operating system maximum

Log shipping

NA

Supported

Yes

Yes

Yes

Backup compression

NA

NA

Yes

Yes

Yes

Always On failover cluster instance

NA

NA

Yes

Yes

Yes

Always On availability groups

NA

NA

NA

Yes

Yes

Basic availability group

NA

NA

Yes

NA

NA

Clusterless availability group

NA

NA

Yes

Yes

Yes

Online indexing

NA

NA

NA

Yes

Yes

Hot add memory and CPU

NA

NA

NA

Yes

Yes

Backup encryption

NA

NA

NA

Yes

Yes

Partitioning

Yes

Yes

Yes

Yes

Yes

In-Memory OLTP

Yes

Yes

Yes

Yes

Yes

Always Encrypted

Yes

Yes

Yes

Yes

Yes

Dedicated admin connection

Yes, it requires a trace flag

Yes

Yes

Yes

Yes

Performance data collector

NA

Yes

Yes

Yes

Yes

Query Store

Yes

Yes

Yes

Yes

Yes

Internationalization support

Yes

Yes

Yes

Yes

Yes

Full-text and semantic search

Yes

Yes

Yes

Yes

Yes

Integration Services

Yes

NA

Yes

Yes

Yes


Note: You can refer to Microsoft documentation for detailed features details and comparison.

Features not supported by SQL Server on Linux

The following SQL Server features are not supported on Linux.


Database Engine features

  • Merge replication

  • Distributed query with 3rd-party connections

  • File table, FILESTREAM

  • Buffer Pool Extension

  • Backup to URL (page blobs)


SQL Server Agent

  • Alerts

  • Managed backups

  • CmdExec, PowerShell, Queue Reader, SSIS, SSAS, SSRS


Services

  • SQL Server Browser

  • Analysis service

  • Reporting service

  • R services

  • Data Quality Services

  • Master data service


Security

  • AD Authentication for Linked Servers

  • AD Authentication for Availability Group (AG) Endpoints

  • Extensible Key Management (EKM)


  • Is there any difference in the SQL Server licensing on Linux and Windows?

There is no difference in the licensing for Windows and SQL Server Linux. You can use the licenses on the cross-platforms. For example, if you have a Windows-based license, you can use it for Linux SQL Server.

  • Can you use SQL Server Management Studio for connecting with SQL Server on Linux?

Yes, we can use it. However, the SQL Server Management Studio ( SSMS) can be installed on a Windows server and remotely access the Linux SQL Server.

  • Do we require a specific version of SQL Server to move from SQL Server Windows to Linux?

No, you can move your existing databases in any version of SQL Server from Windows to Linux.

  • Can we migrate databases from Oracle or other database engines to SQL Server on Linux?

Yes,  you can use SQL Server Migration Assistant (SSMA) for migrating from Microsoft Access, MySQL, DB2, Oracle or SAP ASE to SQL Server on Linux.

  • Can we install SQL Server for Linux on Linux Subsystem for Windows 10?

No, Linux Subsystem for Windows 10 is not supported.

  • Can we perform an unattended installation of SQL Server on Linux?

Yes.

  • Is there any tool to install on Linux SQL Server for connection or executing queries?

Yes, you can install Azure Data Studio on Linux as well. It is a cross-database platform tool with rich features for development, such as below.

  • Code editor with IntelliSense

  • Code snippets

  • Customizable Server and Database Dashboards

  • Integrated Terminal for Bash, PowerShell, sqlcmd, BCP, and ssh

  • Extensions for additional features

You can refer to Microsoft documentation for more details on Azure Data Studio.

  • Do we have a utility like SQL Server Configuration Manager for Linux?

SQL Server Configuration Manager lists down SQL Services, their status, network protocols, ports, file system configurations in a graphical window for Windows.

SQL Server Linux includes a command-line utility mssql-conf for these configurations.

  • Can we use Active Directory Authentication for SQL Server on Linux?

Yes, you can configure and use AD credentials to connect SQL Server on Linux with AD authentications.

  • Can we configure the replication from Windows to Linux or vice versa?

Yes, you can use read scale replicas for one-way data replication between Windows to Linux SQL or vice versa.

Conclusion

It is essential to know the SQL Server on Linux edition, features and how it is different from SQL Server running on WIndows. Therefore, this article provided a comparison between SQL Server on Windows and Linux operating systems. You should understand the differences and evaluate your requirements while planning to move your databases to SQL Server on Linux.

Preparing Your Databases For a COVID Battle with ClusterControl

$
0
0

During these COVID-ridden days, chances are that your database instances are facing a lot of problems. Some of these problems might be related to performance issues (we mean, have you ever thought about how many people are staying at home during lockdowns and whatnot and how many of them are using the services your business provides? Numbers are scary, aren’t they?), some of them - to security issues (due to the hackers staying at home as well, the numbers of data breaches have been on the rise as well), some of them to high availability too (your service has to be able to keep itself up even with a huge influx of users, doesn’t it?)

ClusterControl to the Rescue

If your database instances are facing problems, there are a couple of tools that can assist in solving them. When choosing a tool of such a caliber though, be sure to evaluate whether it’s made by known database ninjas or not, and also evaluate whether it’s able to solve all of the problems your business encounters. A tool that solves only performance-related issues might be of no use if the majority of your problems are related to high availability or security of your database instances, right?

Thankfully, ClusterControl by Severalnines can solve all of those problems. ClusterControl is the only database management system you will ever need to solve all of your database problems, and, perhaps more importantly, take control of your entire database infrastructure. ClusterControl by Severalnines comes with many advanced features, each with their bells and whistles like:

  • The ability to observe how your database clusters and database nodes are doing in real-time by simply observing a couple of graphs. For example, look how your MariaDB Galera Clusters can look like when ClusterControl is in use:
     

  • The ability to let you observe your database server statistics - don’t have a DBA at hand? Don’t know how to see how many disk reads and (or) disk writes are running on your database instances at the present moment? No worries - turn to ClusterControl and it will solve all of your issues without you even needing to blink - the index page, for example, has a Server Stats part that can help you see for how long your database clusters were up, etc.:
     

  • The ability to advise you what should you do to improve your database performance - in these COVID days, a lot of people could be using your application, and you would think that if you don’t know enough about how databases work and function in this space, you might be in for a little trouble. Well, not with ClusterControl. ClusterControl has a bunch of advisors that will improve your MySQL, InnoDB performance, as well as advise you in regards to miscellaneous information - here’s how it could look like when ClusterControl would be monitoring your database instances:

    ClusterControl advisors can be even scheduled, disabled, or even edited if you are into javascript-like code as well: isn’t that amazing?

  • In these COVID days, you might also be pressed to back up your data because there are all kinds of regulations that require you to do so. Well, with ClusterControl everything is very easy - head over to the Backups tab and you will be able to create a backup, restore one, or, if you desire, even schedule one as well!

    In this case, note that backups can also be uploaded to the cloud to not waste your precious disk space. ClusterControl can also compress your backups for you, encrypt them if you so desire, and help you choose for how long you want to keep them as well: the default period of backups being kept is a month (31 days), but you can also define a custom period, or, if you want to, keep your backups on the disk forever. Hey, it’s your call!

    Yes, your backups can also use extended inserts, and they can be even verified - after all, isn’t that part of what the DBAs at your company are tasked to do, no? You can also choose a compression level as well if you feel like your backups would consume a lot of disk space.

  • During COVID times, chances are that your databases will no longer perform at the very best of their ability and there are also chances that some database jobs that are usually running without any kinds of problems will start to error out. ClusterControl by Severalnines has you covered in this space too:

    As you can see, ClusterControl lets you see what database jobs were successfully completed and what database jobs failed. You will also be able to see what part of those database jobs failed which could be incredibly helpful if you want to get to the core of the issue. After all, ClusterControl is your automatic DBA - is a DBA really a DBA if he or she cannot find database-related issues? With ClusterControl, you will no longer have to worry about having any of these!

  • You might also want to keep an eye out for your database topology as well: ClusterControl makes it easy too! Just click on the topology button and you will be presented with all of the glory that your databases consist of:

    Easy? Convenient? Yes, we think so too!

ClusterControl has many other unique features (such as a command line client (CLI) and some others), but we will let you figure out these yourself. ClusterControl also has a documentation section because, after all, what kind of a battle is a battle if you don’t even know what (database performance-based) “enemies” are you going to fight and how to fend them off? Keep an eye out on the documentation as well and you will be very well prepared for any kind of storms that might blow towards your database instances at any time.


Zero Downtime Upgrades Made Easy with ClusterControl

$
0
0

“Keep your database upgraded to the latest version - it’s for your safety” is something you may frequently hear as sound advice and best practice when it comes to database management. On the other hand, upgrading your database can be a time-consuming task. Even a minor version upgrade requires that you thoroughly test the upgrade in a staging environment before upgrading your production setup. So what’s the big deal? If you’re only lagging behind one minor version, it shouldn’t matter, right? Well, it might not...until it does. And are you really prepared to take that kind of risk?

Earlier this year, a new potentially dangerous vulnerability was identified in Galera Cluster (CVE-2021-27928). At first glance, we see that the severity was marked as high, and when we start digging into the issue further, it does indeed look severe. It appears that a SUPER user may execute any arbitrary code by changing wsrep_provider and wsrep_notify_cmd variables at the runtime. It allows the user to load the .so library and point towards a script that the server will execute. As you can imagine, this is not a good situation. Sure, you need to have access to the SUPER user, and you would need to have something available to execute on the database node, but the fact that Galera can be configured to execute arbitrary code as a ‘mysql’ user is bad enough on its own.

As usual, in cases such as these, the fixes have been created, and new versions of the software, unaffected by the vulnerability, have been pushed. This particular issue has been fixed in MariaDB 10.5.9, 10.4.18, 10.3.28, and 10.2.37, as well as Percona XtraDB Cluster 5.6.51-28.46, Percona XtraDB Cluster 5.7.33-31.49, and Percona XtraDB Cluster 8.0.22-13.1. All seems to be back to normal. Right?

Wrong. There are countless systems running on production that have not yet been upgraded to the new, unaffected version. Severalnines support team is in touch with many database environments in the wild, and we are constantly working with prospects to help them migrate to an environment managed by ClusterControl. We see all kinds of MySQL (and not only MySQL) running in outdated versions, sometimes even versions that have reached their End Of Life and are no longer getting security updates. That should not be the case, especially if you are a ClusterControl user.

ClusterControl comes with a set of features that will help you to stay up to date with all security fixes. Let’s take a look:

First of all, ClusterControl comes with Operational Reports, one of them being the Package Upgrade Report:

Like all of ClusterControl’s operational reports, the Package Upgrade Report can be scheduled to be executed regularly and then delivered via email. It will contain information about the package versions installed on the nodes and if there are any kind of upgrades that should be performed:

The Package Upgrade Report presents a list of packages that should be updated for all databases, loadbalancers, security fixes, and any other packages installed on the node. For all of the system packages, the solution is to upgrade them using standard methods (apt, yum). When it comes to the databases and loadbalancers, ClusterControl comes with functionality that allows you to perform the minor version upgrade directly from the UI.

Before we head there, let’s assume that the database has to be updated. You do not want to just proceed and run the upgrade blindly - it might potentially cause problems for your application. It shouldn’t - minor versions do not break backwards compatibility (except when you use MySQL 8.0 - then yes, you may expect anything when going from 8.0.x to 8.0.x+1); however, there is always some risk involved. What you should do first is test the upgrade in a separate environment.

We have a simple MariaDB Galera cluster with ProxySQL and Keepalived:

We would like to build a test cluster so that we can test the upgrade process. With ClusterControl, it is as easy as using Create Replica Cluster job:

We can get the fresh data from the existing cluster, or we can use the data from a backup.

We also have to pick a source node in the production cluster:

Then we have to go through a regular deployment wizard, picking the version and vendor of the database, defining root password, and so on. We conclude by passing the nodes on which the cluster will be installed.

As a result, you will see a new cluster on the list with a clear mark that it is replicating off the production cluster. One thing worth mentioning, in the default setup, ClusterControl will use the latest versions of the packages to create the replica cluster. If you want to double-check just the queries, this is enough. If you want to go through the whole upgrade process, you would need to pin down older versions of the MySQL packages in order to install an old version (and then unpin them and test the upgrade).

One way or the other, after successful tests, you will eventually want to perform the upgrade. ClusterControl can help you to accomplish this:

In Manage -> Upgrades, you will find a UI to perform the upgrade.

You can use “Check For New Packages” to refresh the database of available packages. We can also pick which nodes we want to upgrade and which services: 

Simply confirm and that’s it - ClusterControl will perform the upgrade and get you the latest version of the packages.

As you can see, ClusterControl makes keeping your databases up to date easy and straightforward. The only step that you must handle manually is the proper testing. Otherwise - everything else can be performed for you by ClusterControl. Interested in learning more about how ClusterControl can help you effectively manage your database? Try it free for 30 days.

ClusterControl now supports SQL Server 2019

$
0
0

We are pleased to announce the latest release of ClusterControl, version 1.9.1. This version of ClusterControl comes with support for SQL Server 2019 and MongoDB versions 4.4 and 5.0,  as well as more functionality improvements for our next generation web application project, ClusterControl v2. Let’s go!

Introducing Support for SQL Server 2019

One of our most customer-requested database systems, SQL Server 2019 operations, such as deployment and full, differential, and transaction log backups, can now be automated with ClusterControl 1.9.1.

Our vision for SQL Server will be to give users the ability to automate full lifecycle ops of HA clusters wherever they choose. It currently only supports single node deployments, but here’s what’s next:

  • Always On availability groups for high-availability and disaster recovery

  • Cloud upload and verification of backups

  • Performance monitoring in CC v2

Nonetheless, that doesn’t mean you can’t begin testing it with ClusterControl so go ahead and download version 1.9.1 to get a feel for how easy your work will become! Next up? CC v2 improvements.

ClusterControl 2.0

ClusterControl v2.0 is a new generation web application GUI for ClusterControl. The Severalnines team has also made some significant improvements on that front. The key improvements for the second version?

  • Ability to import Redis database with Sentinel clusters

  • New cluster actions, e.g. configuring read-only mode for MySQL, Galera cluster restart, etc.

  • New node actions for MySQL, e.g. promote and rebuild replicas, stop, restart, and remove nodes, etc. 

This is by no means an exhaustive list, in fact, there are more than fifteen improvements including split brain improvements with MySQL primary / secondary replication. Check out the changelog for a complete list.

Wrapping up

In a few short months, our team has worked tirelessly, adding two new datastores, HA Redis and SQL Server 2019, and progressing rapidly with CC v2, not to mention the dozens of platform improvements. 

There’s even more to come, including support for a popular search / analytics database so stay tuned by subscribing to our newsletter above or following us on Twitter

For those of you already using CC, follow these instructions on upgrading ClusterControl. Not using CC? Download ClusterControl 1.9.1 in minutes. Talk soon!

Resources

Install SQL Server on Linux using ClusterControl

$
0
0

Microsoft has taken a big step in releasing SQL Server Linux for users to build their applications. That’s great news for organizations where the only requirement is that you should be using SQL Server 2017 or 2019.

In some of our earlier articles, we looked into the fact that SQL Server Linux provides command-line installation. You also need to learn basic commands for Linux for installation, configuration, and management. If you are looking for an automated way to Install, Configure, Manage SQL Server on Linux, then ClusterControl from Severalnines can help you achieve that.

ClusterControl’s support for SQL Server on Linux

Recently, ClusterControl added support for SQL Server on Linux.  Using ClusterControl, you can achieve the following benefits:

  • Graphical installation of your SQL Server instances.

  • Access to tools that can provide automatic configuration such as SQL Server Agent, Certificates, Backups, Storage encryption, Backup retention, and restoring backups with a proper backup chain.

  • Upgrades and Patching (Upcoming)

  • Security and compliance (Upcoming)

  • Operational reporting and dashboards (Upcoming)

  • Performance management (Upcoming)

  • High availability (HA) and disaster recovery (DR) using SQL Server Always On Availability Groups (Upcoming)

Note: ClusterControl can install a standalone SQL Server on Linux with limited features in the initial release. It will begin adding the above-mentioned features in the upcoming release.

Installing SQL Server using ClusterControl

To begin installing SQL Server with ClusterControl, launch ClusterControl and provide your credentials on the login page shown below. 

To deploy a database, click on Create a service, and it takes you to the Service Launch Wizard for the following options.

  • Create a database cluster: This option lets you choose a database technology, configure and create a database service on a fresh host. 

  • Import a database cluster: This option lets you import an existing database deployment into ClusterControl. 


To build a new server, choose the option – Create a database cluster.

In the deploy service, ClusterControl lists the supported database systems.

Choose SQL Server on the left, and you will see some of the basics related to SQL Server.

Click on Continue, and ClusterControl will start deploying your cluster. Here’s how it looks like.

Step 1: Cluster details

The first step allows you to enter cluster name (optional) and tags (optional). If you do not provide any cluster name, the ClusterControl assigns an auto-generated name. It is recommended to provide a familiar name for SQL Server Linux instances to connect to the instance using the friendly name.


Step 2: SSH Configuration

Enter the SSH user and SSH user key path in the second step. You can choose from a couple of options – you can either install the software, disable the firewall, or disable AppArmor. It is recommended to use the default configuration.

Step 3: Node Configuration

By default, ClusterControl creates a user called “SQLServerAdmin” that performs administrative tasks. It auto-generates the password for the user as well. However, you can enter your password to remember it. 

If you want to enter the custom password, check the password policy from the link given. See image below:

Step 4: Add Nodes

In the add nodes step, enter the IP address of the virtual machine in which you want to install SQL Server on Linux.

Note: Currently, ClusterControl supports a single SQL Server on Linux. Therefore, you need to add a single VM IP address in the add nodes section.

Step 5: Preview

The step gives a preview of your configurations before installing SQL Server on Linux, allowing you to go back and make changes if required.

Click on Finish, and ClusterControl will start a deployment job.

Click on Go to activity list, and you see a task title – Deploy SQL Server 2019 cluster in the running state.

To check the installation progress, click on the three dots icon and click Logs. In the logs, we can notice the following things:


  • ClusterControl uses the directory /var/opt/mssql/data as its data directory.

  • The system memory is 32GB.


  • ClusterControl starts the installation of the mssql-server service on the specified node.


  • ClusterControl configures a SQL Server Agent.

  • It creates a SQL Server admin user “SQLServerAdmin.”

  • If you provided any special character such as @ in the password, it is replaced by %.

  • ClusterControl configures the error log location to /var/log/mssql/errorlog

  • It sets the maximum SQL Server memory to 80% of the server memory.

Once the installation is completed successfully, you will see a green tick, as shown below. 


We can use SQL Server Management Studio (remotely), Azure Data Studio, or SQLCMD tool to connect to SQL Server. The following screenshot shows the SSMS connection window with the public IP address and its port number. 

For the authentication, choose the SQL Server Authentication, and specify the SQL credentials. 


It connects to the SQL instance with SQL authentication. By default, SQL Server has databases called master, model, MSDB, and TempDB.


You can create new databases using the CREATE DATABASE statement. For example, In the below screenshot, we create a [demodb] user database.


The ClusterControl dashboard shows the deployed SQL Server on Linux status along with the health of its components. For example, the cluster sqlserverlinuxdemo is operational, nodes are active, and the auto-recovery for cluster and nodes are healthy.


Once ClusterControl deploys a SQL Server on a Linux instance, it creates a master key, certificates and takes the certificate backup as well. As you can see the BACKUP CERTIFICATE statement takes backup for the [s9sBackupEncryptCert] certificate in the following screenshot.


Creating SQL Server Linux backups with Backup on Demand

ClusterControl allows you to create database backups including Full, Differential, and Log backups for all databases in the SQL instance. The system databases are critical for SQL instances, and they are small in size. Therefore, if you take differential and log backup for your system databases, ClusterControl upgrades the backup type as FULL. We will see this in action later in this article. 

Click on the Backup tab in ClusterControl, you will see a part of the tool called Create a backup. It allows you to create the backup on-demand or schedule a backup should you so desire.

The create a backup wizard has a couple of steps, all of which are outlined below.

Step 1: Configuration

On the configuration page, select the cluster for which you want to take the database backup. You are also required to select the backup type (your backups can either be full, differential, or you can also take the backups of the log files.)

By default, ClusterControl will take a full backup for all databases.

Step 2: Additional Settings

The Additional Settings page allows the following configurations.

  • Compression: By default, the ClusterControl takes a compressed backup for all databases in SQL Server on Linux. If you require an uncompressed backup, disable the compression using the toggle switch.

  • Include system databases: If required, you can avoid taking system database backups.

  • Retention: The default backup retention is 31 days. You can specify a different retention period if required.


Step 3: Storage

The storage configuration includes the configuration storage directory and backup subdirectory. These values are auto-filled. Therefore, you can skip the storage configuration for the database backup.

Step 4: Preview

On the preview page, review your backup configurations and click on the Finish button to start creating your database backups.

Click on Finish, and you will see that ClusterControl will take a full backup for Master, Model, MSDB, and DemoDB databases as those are available in our instance. Do note that SQL Server does not support database backups for TempDB.


Similarly, you can launch a backup wizard for differential and transaction log backups, see below:


As shown below, ClusterControl upgrades differential and Transaction Log backups for the system databases to the backup type FULL.

Restoring SQL Server backups with ClusterControl

ClusterControl also allows you to restore database backups. It automatically selects the required backups for restore; for example, if you take full, differential, and transaction log backups for a user database and you try to restore the log backup, it automatically restores full, differential, and log backups in sequence to restore the database with valid backup sets. 

For example, let's drop the user database [demodb] using the T-SQL statement below

DROP DATABASE DEMODB;


Now, to restore the backup, select the log backup in ClusterControl and click on Restore. 

You can view the restore progress for the full, differential, and log backups in the logs. 


Once the restore process is finished, refresh the object explorer in SSMS, and you will see that the database is in an online state.

Wrapping up

Now you should know how to install SQL Server on Linux using the ClusterControl GUI, as well as know how you should go about creating and restoring backups. We will continue developing SQL Server and adding new features, such as Always On HA groups, to make it more resilient and ready for production-grade environments, so stay tuned.

In the meantime, make sure you download ClusterControl if you haven’t already and subscribe to the Severalnines RSS feed or follow us on Twitter and LinkedIn to stay up-to-date with SQL Server and other releases. See you soon!

SQL Server Always On availability groups now supported in ClusterControl's Latest Release

$
0
0

It’s an understatement to say that we’re very excited to announce our first release of 2022 — ClusterControl 1.9.2! This release supports high-availability SQL Server 2019 clusters, SNMP (Simple Network Management Protocol), new versions of MariaDB, PostgreSQL, TimescaleDB, and multiple operating systems, as well as the latest improvements for ClusterControl v2. Keep reading — we will tell you all about it in this post.

ClusterControl 1.9.2 at a Glance

A high-level overview of the features that ClusterControl 1.9.2 comes with include:

  • Support for Always On Availability Groups for Microsoft SQL Server 2019.
  • Users can now enable SNMP traps to send alarms and alerts to SNMP monitoring systems.
  • Support for AlmaLinux 8.x, RockyLinux 8.x, Debian 11.x, MariaDB 10.6, PostgreSQL 14 and TimescaleDB with PG v13 and 14.

Support for High-availability SQL Server 2019

Users can now deploy a high-availability SQL Server 2019 cluster with up to 8 nodes (1 primary / 7 replicas) with asynchronous replication. This release also includes performance monitoring enhancements and the ability to upload backups to the cloud. To get more details about the enhancements, visit our release notes.

Support for Simple Network Management Protocol (SNMP)

ClusterControl 1.9.2 enables users to send alarms to SNMP monitoring systems via SNMP traps. The feature is very easy to enable by adding an SNMP monitoring/target host, port, and a trap community string. That can be done by editing the CMON configuration file directly or making changes using the ‘Runtime configuration’ feature. When using this feature, ClusterControl automatically generates a MIB file.

Support for new database and operating system versions

ClusterControl 1.9.2 comes with support for multiple new database and operating system versions:

  • Database version updates:
    • MariaDB 10.6
    • PostgreSQL 14
    • TimescaleDB w/PG v13 and 14


  • Operating system version updates:
    • AlmaLinux 8.x
    • RockyLinux 8.x
    • Debian 11.x

Wrapping up

We’ve put a lot of work into building out SQL Server 2019 to make it production-grade and enhancing the rest of the platform. Be sure to visit our changelog for detailed notes on the latest features, including how to access these features and what versions of SNMP are supported. 

We’ve got a lot more work ahead of us, including a new search database, so stay tuned by following us on Twitter or LinkedIn, or subscribing to our RSS feed, and we will see you in the next one. In the meantime, upgrade to the latest version of ClusterControl and enjoy!

How to Deploy Teamcity with PostgreSQL for High Availability

$
0
0

TeamCity is a continuous integration and continuous delivery server built in Java. It's available as a cloud service and on-premises. As you can imagine, continuous integration and delivery tools are crucial to software development, and their availability must be unaffected. Fortunately, TeamCity can be deployed in a Highly Available mode. 

This blog post will cover preparing and deploying a highly available environment for TeamCity.

The Environment

TeamCity consists of several elements. There is a Java application and a database that backs it up. It also uses agents that are communicating with the primary TeamCity instance. The highly available deployment consists of several TeamCity instances, where one is acting as the primary, and the others secondary. Those instances share access to the same database and the data directory. Helpful schema is available on the TeamCity documentation page, as shown below:

As we can see, there are two shared elements — the data directory and the database. We must ensure that those are also highly available. There are different options that you can use to build a shared mount; however, we will use GlusterFS. As for the database, we will use one of the supported relational database management systems — PostgreSQL, and we'll use ClusterControl to build a high availability stack based around it.

How to Configure GlusterFS

Let’s start with the basics. We want to configure hostnames and /etc/hosts on our TeamCity nodes, where we will also be deploying GlusterFS. To do that, we need to setup the repository for the latest packages of GlusterFS on all of them:

sudo add-apt-repository ppa:gluster/glusterfs-7

sudo apt update

Then we can install the GlusterFS on all of our TeamCity nodes:

sudo apt install glusterfs-server

sudo systemctl enable glusterd.service

root@node1:~# sudo systemctl start glusterd.service

root@node1:~# sudo systemctl status glusterd.service

● glusterd.service - GlusterFS, a clustered file-system server

     Loaded: loaded (/lib/systemd/system/glusterd.service; enabled; vendor preset: enabled)

     Active: active (running) since Mon 2022-02-21 11:42:35 UTC; 7s ago

       Docs: man:glusterd(8)

    Process: 48918 ExecStart=/usr/sbin/glusterd -p /var/run/glusterd.pid --log-level $LOG_LEVEL $GLUSTERD_OPTIONS (code=exited, status=0/SUCCESS)

   Main PID: 48919 (glusterd)

      Tasks: 9 (limit: 4616)

     Memory: 4.8M

     CGroup: /system.slice/glusterd.service

             └─48919 /usr/sbin/glusterd -p /var/run/glusterd.pid --log-level INFO


Feb 21 11:42:34 node1 systemd[1]: Starting GlusterFS, a clustered file-system server...

Feb 21 11:42:35 node1 systemd[1]: Started GlusterFS, a clustered file-system server.

GlusterFS uses port 24007 for connectivity between the nodes; we must make sure that it is open and accessible by all of the nodes.

Once the connectivity is in place, we can create a GlusterFS cluster by running from one node:

root@node1:~# gluster peer probe node2

peer probe: success.

root@node1:~# gluster peer probe node3

peer probe: success.

Now, we can test what the status looks like:

root@node1:~# gluster peer status

Number of Peers: 2


Hostname: node2

Uuid: e0f6bc53-d47d-4db6-843b-9feea111a713

State: Peer in Cluster (Connected)


Hostname: node3

Uuid: c7d285d1-bcc8-477f-a3d7-7e56ff6bfd1a

State: Peer in Cluster (Connected)

It looks like all is good and the connectivity is in place.

Next, we should prepare a block device to be used by GlusterFS. This must be executed on all of the nodes. First, create a partition:

root@node1:~# echo 'type=83' | sudo sfdisk /dev/sdb

Checking that no-one is using this disk right now ... OK


Disk /dev/sdb: 30 GiB, 32212254720 bytes, 62914560 sectors

Disk model: VBOX HARDDISK

Units: sectors of 1 * 512 = 512 bytes

Sector size (logical/physical): 512 bytes / 512 bytes

I/O size (minimum/optimal): 512 bytes / 512 bytes


>>> Created a new DOS disklabel with disk identifier 0xbcf862ff.

/dev/sdb1: Created a new partition 1 of type 'Linux' and of size 30 GiB.

/dev/sdb2: Done.


New situation:

Disklabel type: dos

Disk identifier: 0xbcf862ff


Device     Boot Start      End  Sectors Size Id Type

/dev/sdb1        2048 62914559 62912512  30G 83 Linux


The partition table has been altered.

Calling ioctl() to re-read partition table.

Syncing disks.

Then, format that partition:

root@node1:~# mkfs.xfs -i size=512 /dev/sdb1

meta-data=/dev/sdb1              isize=512    agcount=4, agsize=1966016 blks

         =                       sectsz=512   attr=2, projid32bit=1

         =                       crc=1        finobt=1, sparse=1, rmapbt=0

         =                       reflink=1

data     =                       bsize=4096   blocks=7864064, imaxpct=25

         =                       sunit=0      swidth=0 blks

naming   =version 2              bsize=4096   ascii-ci=0, ftype=1

log      =internal log           bsize=4096   blocks=3839, version=2

         =                       sectsz=512   sunit=0 blks, lazy-count=1

realtime =none                   extsz=4096   blocks=0, rtextents=0

Finally, on all of the nodes, we need to create a directory that will be used to mount the partition and edit fstab to ensure it will be mounted at startup:

root@node1:~# mkdir -p /data/brick1

echo '/dev/sdb1 /data/brick1 xfs defaults 1 2'>> /etc/fstab

Let’s verify now that this works:

root@node1:~# mount -a && mount | grep brick

/dev/sdb1 on /data/brick1 type xfs (rw,relatime,attr2,inode64,logbufs=8,logbsize=32k,noquota)

Now we can use one of the nodes to create and start the GlusterFS volume:

root@node1:~# sudo gluster volume create teamcity replica 3 node1:/data/brick1 node2:/data/brick1 node3:/data/brick1 force

volume create: teamcity: success: please start the volume to access data

root@node1:~# sudo gluster volume start teamcity

volume start: teamcity: success

Please notice that we use the value of ‘3’ for the number of replicas. It means that every volume will exist in three copies. In our case, every brick, every /dev/sdb1 volume on all nodes will contain all data.

Once the volumes are started, we can verify their status:

root@node1:~# sudo gluster volume status

Status of volume: teamcity

Gluster process                             TCP Port  RDMA Port  Online  Pid

------------------------------------------------------------------------------

Brick node1:/data/brick1                    49152     0          Y       49139

Brick node2:/data/brick1                    49152     0          Y       49001

Brick node3:/data/brick1                    49152     0          Y       51733

Self-heal Daemon on localhost               N/A       N/A        Y       49160

Self-heal Daemon on node2                   N/A       N/A        Y       49022

Self-heal Daemon on node3                   N/A       N/A        Y       51754


Task Status of Volume teamcity

------------------------------------------------------------------------------

There are no active volume tasks

As you can see, everything looks ok. What’s important is that GlusterFS picked port 49152 for accessing that volume, and we must ensure that it's reachable on all of the nodes where we will be mounting it.

The next step will be to install the GlusterFS client package. For this example, we need it installed on the same nodes as the GlusterFS server:

root@node1:~# sudo apt install glusterfs-client

Reading package lists... Done

Building dependency tree

Reading state information... Done

glusterfs-client is already the newest version (7.9-ubuntu1~focal1).

glusterfs-client set to manually installed.

0 upgraded, 0 newly installed, 0 to remove and 0 not upgraded.

Next, we need to create a directory on all nodes to be used as a shared data directory for TeamCity. This has to happen on all of the nodes:

root@node1:~# sudo mkdir /teamcity-storage

Lastly, mount the GlusterFS volume on all of the nodes:

root@node1:~# sudo mount -t glusterfs node1:teamcity /teamcity-storage/
root@node1:~# df | grep teamcity
node1:teamcity                     31440900    566768  30874132   2% /teamcity-storage

This completes the shared storage preparations.

Building a Highly Available PostgreSQL Cluster

Once the shared storage setup for TeamCity is complete, we can now build our highly available database infrastructure. TeamCity can use different databases; however, we will be using PostgreSQL in this blog. We will leverage ClusterControl to deploy and then manage the database environment.

TeamCity's guide to building multi-node deployment is helpful, but it seems to leave out the high availability of everything other than TeamCity. TeamCity's guide suggests an NFS or SMB server for data storage, which, on its own, does not have redundancy and will become a single point of failure. We have addressed this by using GlusterFS. They mention a shared database, as a single database node obviously does not provide high availability. We have to build a proper stack:

In our case. it will consist of three PostgreSQL nodes, one primary, and two replicas. We will use HAProxy as a load balancer and use Keepalived to manage Virtual IP to provide a single endpoint for the application to connect to. ClusterControl will handle failures by monitoring the replication topology and performing any required recovery as needed, such as restarting failed processes or failing over to one of the replicas if the primary node goes down.

To start, we will deploy the database nodes. Please keep in mind that ClusterControl requires SSH connectivity from the ClusterControl node to all of the nodes it manages.

Then, we pick a user that we’ll use to connect to the database, its password, and the PostgreSQL version to deploy:

Next, we're going to define which nodes to use for deploying PostgreSQL:

Finally, we can define if the nodes should use asynchronous or synchronous replication. The main difference between these two is that synchronous replication ensures that every transaction executed on the primary node will always be replicated on the replicas. However, synchronous replication also slows down the commit. We recommend enabling synchronous replication for the best durability, but you should verify later if the performance is acceptable.

After we click “Deploy”, a deployment job will start. We can monitor its progress in the Activity tab in the ClusterControl UI. We should eventually see that the job has been completed and the cluster was successfully deployed.

Deploy HAProxy instances by going to Manage -> Load balancers. Select HAProxy as the load balancer and fill in the form. The most important choice is where you want to deploy HAProxy. We used a database node in this case, but in a production environment, you most likely want to separate load balancers from database instances. Next, select which PostgreSQL nodes to include in HAProxy. We want all of them.

Now the HAProxy deployment will start. We want to repeat it at least once more to create two HAProxy instances for redundancy. In this deployment, we decided to go with three HAProxy load balancers. Below is a screenshot of the settings screen while configuring the deployment of a second HAProxy:

When all of our HAProxy instances are up and running, we can deploy Keepalived. The idea here is that Keepalived will be collocated with HAProxy and monitor HAProxy’s process. One of the instances with working HAProxy will have Virtual IP assigned. This VIP should be used by the application to connect to the database. Keepalived will detect if that HAProxy becomes unavailable and move to another available HAProxy instance.

The deployment wizard requires us to pass HAProxy instances that we want Keepalived to monitor. We also need to pass the IP address and network interface for VIP.

The last and final step will be to create a database for TeamCity:

With this, we have concluded the deployment of the highly available PostgreSQL cluster.

Deploying TeamCity as Multi-node

The next step is to deploy TeamCity in a multi-node environment. We will use three TeamCity nodes. First, we have to install Java JRE and JDK that match the requirements of TeamCity. 

apt install default-jre default-jdk

Now, on all nodes, we have to download TeamCity. We will install in a local, not shared directory.

root@node1:~# cd /var/lib/teamcity-local/

root@node1:/var/lib/teamcity-local# wget https://download.jetbrains.com/teamcity/TeamCity-2021.2.3.tar.gz

Then we can start TeamCity on one of the nodes:

root@node1:~# /var/lib/teamcity-local/TeamCity/bin/runAll.sh start

Spawning TeamCity restarter in separate process

TeamCity restarter running with PID 83162

Starting TeamCity build agent...

Java executable is found: '/usr/lib/jvm/default-java/bin/java'

Starting TeamCity Build Agent Launcher...

Agent home directory is /var/lib/teamcity-local/TeamCity/buildAgent

Agent Launcher Java runtime version is 11

Lock file: /var/lib/teamcity-local/TeamCity/buildAgent/logs/buildAgent.properties.lock

Using no lock

Done [83731], see log at /var/lib/teamcity-local/TeamCity/buildAgent/logs/teamcity-agent.log

Once TeamCity has started, we can access the UI and begin deployment. Initially, we have to pass the data directory location. This is the shared volume we created on GlusterFS.

Next, pick the database. We are going to use a PostgreSQL cluster that we have already created. 

Download and install the JDBC driver:

Next, fill in access details. We will use the virtual IP provided by Keepalived. Please note that we use port 5433. This is the port used for the read/write backend of HAProxy; it will always point towards the active primary node. Next, pick a user and the database to use with TeamCity.

Once this is done, TeamCity will start initializing the database structure.

Agree to the License Agreement:

Finally, create a user for TeamCity:

That's it! We should now be able to see the TeamCity GUI:

Now, we have to set up TeamCity in multi-node mode. First, we have to edit the startup scripts on all of the nodes:

root@node1:~# vim /var/lib/teamcity-local/TeamCity/bin/runAll.sh

We have to make sure that the following two variables are exported. Please verify that you use the proper hostname, IP, and the correct directories for local and shared storage:

export TEAMCITY_SERVER_OPTS="-Dteamcity.server.nodeId=node1 -Dteamcity.server.rootURL=http://192.168.10.221 -Dteamcity.data.path=/teamcity-storage -Dteamcity.node.data.path=/var/lib/teamcity-local"

export TEAMCITY_DATA_PATH="/teamcity-storage"

Once this is done, you can start the remaining nodes:

root@node2:~# /var/lib/teamcity-local/TeamCity/bin/runAll.sh start

You should see the following output in Administration -> Nodes Configuration: One main node and two standby nodes.

Please keep in mind that failover in TeamCity is not automated. If the main node stops working, you should connect to one of the secondary nodes. To do this, go to "Nodes Configuration" and promote it to the “Main” node. From the login screen, you will see a clear indication that this is a secondary node:

In the "Nodes Configuration," you will see that the one node has dropped from the cluster:

You'll receive a message stating that you cannot write to this node. Don't worry; the write required to promote this node to the “main” status will work just fine:

Click "Enable," and we have successfully promoted a secondary TimeCity node:

When node1 becomes available and TeamCity is started again on that node, we will see it rejoin the cluster:

If you want to improve performance further, you can deploy HAProxy + Keepalived in front of the TeamCity UI to provide a single entry point to the GUI. You can find details on configuring HAProxy for TeamCity in the documentation.

Wrapping Up

As you can see, deploying TeamCity for high availability is not that difficult — most of it has been covered thoroughly in the documentation. If you're looking for ways to automate some of this and add a highly available database backend, consider evaluating ClusterControl free for 30 days. ClusterControl can quickly deploy and monitor the backend, providing automated failover, recovery, monitoring, backup management, and more.

For more tips on software development tools and best practices, check out how to support your DevOps team with their database needs.

To get the latest news and best practices for managing your open-source-based database infrastructure, don't forget to follow us on Twitter or LinkedIn and subscribe to our newsletter. See you soon!

Viewing all 385 articles
Browse latest View live