Quantcast
Channel: Severalnines - clustercontrol
Viewing all 385 articles
Browse latest View live

Installing Redis Cluster (cluster mode enabled) with auto failover

$
0
0

Redis is an open-source in-memory datastore used as a database or cache. It has built-in replication and provides high availability via Redis Sentinel and automatic partitioning with Redis Cluster. In this blog, we will see what is and how to install a Redis Cluster.

What is Redis Cluster?

Redis Cluster is a built-in Redis feature that offers automatic sharding, replication, and high availability which was previously implemented using Sentinels. It has the ability to automatically split your dataset among multiple nodes and to continue operations when a subset of the nodes are experiencing failures or are unable to communicate with the rest of the cluster.

The Redis Cluster goals are:

  • High performance and linear scalability for up to 1,000 nodes. There are no proxies, asynchronous replication is used, and no merge operations are performed on values.

  • An acceptable degree of write safety. The system tries to retain all the writes originating from clients connected with the majority of the master nodes. Usually, there are small windows of time where acknowledged writes can be lost. 

  • It is able to survive partitions where the majority of the master nodes are reachable and there is at least one reachable slave for every master node that is no longer reachable. 

Now that we know what it is, let’s see how to install it.

How to install Redis Cluster

According to the official documentation, the minimal cluster that works as expected requires to contain at least three master nodes, but actually, the recommendation is to have a six nodes cluster with three masters and three nodes for the slaves, so let’s do that.

For this example, we will install Redis Cluster on CentOS 8 using the following topology:

Master 1: 10.10.10.121
Master 2: 10.10.10.122
Master 3: 10.10.10.123
Slave 1: 10.10.10.124
Slave 2: 10.10.10.125
Slave 3: 10.10.10.126

The following commands must be run in all the nodes, master and slave.

By default, during the creation of this blog post, the available Redis version on CentOS 8 is 5.0.3, so let’s use the Remi Repository to have the current stable version 6.2:

$ dnf install https://rpms.remirepo.net/enterprise/remi-release-8.rpm -y
$ dnf module install redis:remi-6.2 -y

Enable the Redis Service:

$ systemctl enable redis.service

To configure your Redis Cluster you need to edit the Redis configuration file /etc/redis.conf and change the following parameters:

$ vi /etc/redis.conf
bind 10.10.10.121 #Replace this IP address to the local IP address on each node
protected-mode no
port 7000
cluster-enabled yes
cluster-config-file nodes.conf
cluster-node-timeout 15000
appendonly yes

These parameters are:

  • bind: By default, if it is not specified, Redis listens for connections from all available network interfaces on the server. It is possible to listen to just one or multiple selected interfaces.

  • protected-mode: Protected mode is a layer of security protection, in order to avoid that Redis instances left open on the internet are accessed and exploited. By default protected mode is enabled. 

  • port: Accept connections on the specified port, default is 6379. If port 0 is specified Redis will not listen on a TCP socket.

  • cluster-enabled: Enables/Disables Redis Cluster support on a specific Redis node. If it is disabled, the instance starts as a stand-alone instance as usual.

  • cluster-config-file: The file where a Redis Cluster node automatically persists the cluster configuration every time there is a change, in order to be able to re-read it at startup.

  • cluster-node-timeout: The maximum amount of time (in milliseconds) a Redis Cluster node can be unavailable, without it being considered as failing. If a master node is not reachable for more than the specified amount of time, it will be failed over by its slaves.

  • appendonly: The Append Only File is an alternative persistence mode that provides much better durability. For instances using the default data fsync policy, Redis can lose just one second of writes in a server failure like a power outage, or a single write if something is wrong with the Redis process itself, but the operating system is still running correctly.

Every Redis Cluster node requires two TCP connections open. The normal Redis TCP port used to serve clients, by default 6379, and the port obtained by adding 10000 to the data port, so by default 16379. This second port is assigned for the Cluster bus, which is used by nodes for failure detection, configuration update, failover authorization, and more. 

Now, you can start the Redis Service:

$ systemctl start redis.service

In the Redis log file, by default /var/log/redis/redis.log, you will see this:

76:M 02 Jul 2021 18:06:17.658 * Ready to accept connections

Now everything is ready, you need to create the cluster using the redis-cli tool. For this, you must run the following command in only one node:

$ redis-cli --cluster create 10.10.10.121:7000 10.10.10.122:7000 10.10.10.123:7000 10.10.10.124:7000 10.10.10.125:7000 10.10.10.126:7000 --cluster-replicas 1

In this command, you need to add the IP Address and Redis port for each node. The three first nodes will be the master nodes, and the rest the slave ones. The cluster-replicas 1 means one slave node for each master. The output of this command will look something like this:

>>> Performing hash slots allocation on 6 nodes...

Master[0] -> Slots 0 - 5460

Master[1] -> Slots 5461 - 10922

Master[2] -> Slots 10923 - 16383

Adding replica 10.10.10.125:7000 to 10.10.10.121:7000

Adding replica 10.10.10.126:7000 to 10.10.10.122:7000

Adding replica 10.10.10.124:7000 to 10.10.10.123:7000

M: 4394d8eb03de1f524b56cb385f0eb9052ce65283 10.10.10.121:7000

   slots:[0-5460] (5461 slots) master

M: 5cc0f693985913c553c6901e102ea3cb8d6678bd 10.10.10.122:7000

   slots:[5461-10922] (5462 slots) master

M: 22de56650b3714c1c42fc0d120f80c66c24d8795 10.10.10.123:7000

   slots:[10923-16383] (5461 slots) master

S: 8675cd30fdd4efa088634e50fbd5c0675238a35e 10.10.10.124:7000

   replicates 22de56650b3714c1c42fc0d120f80c66c24d8795

S: ad0f5210dda1736a1b5467cd6e797f011a192097 10.10.10.125:7000

   replicates 4394d8eb03de1f524b56cb385f0eb9052ce65283

S: 184ada329264e994781412f3986c425a248f386e 10.10.10.126:7000

   replicates 5cc0f693985913c553c6901e102ea3cb8d6678bd

Can I set the above configuration? (type 'yes' to accept):

After accepting the configuration, the cluster will be created:

>>> Nodes configuration updated

>>> Assign a different config epoch to each node

>>> Sending CLUSTER MEET messages to join the cluster

Waiting for the cluster to join

.

>>> Performing Cluster Check (using node 10.10.10.121:7000)

M: 4394d8eb03de1f524b56cb385f0eb9052ce65283 10.10.10.121:7000

   slots:[0-5460] (5461 slots) master

   1 additional replica(s)

S: 184ada329264e994781412f3986c425a248f386e 10.10.10.126:7000

   slots: (0 slots) slave

   replicates 5cc0f693985913c553c6901e102ea3cb8d6678bd

M: 5cc0f693985913c553c6901e102ea3cb8d6678bd 10.10.10.122:7000

   slots:[5461-10922] (5462 slots) master

   1 additional replica(s)

M: 22de56650b3714c1c42fc0d120f80c66c24d8795 10.10.10.123:7000

   slots:[10923-16383] (5461 slots) master

   1 additional replica(s)

S: ad0f5210dda1736a1b5467cd6e797f011a192097 10.10.10.125:7000

   slots: (0 slots) slave

   replicates 4394d8eb03de1f524b56cb385f0eb9052ce65283

S: 8675cd30fdd4efa088634e50fbd5c0675238a35e 10.10.10.124:7000

   slots: (0 slots) slave

   replicates 22de56650b3714c1c42fc0d120f80c66c24d8795

[OK] All nodes agree about slots configuration.

>>> Check for open slots...

>>> Check slots coverage...

[OK] All 16384 slots covered.


If you take a look at the master log file, you will see:

3543:M 02 Jul 2021 19:40:23.250 # configEpoch set to 1 via CLUSTER SET-CONFIG-EPOCH

3543:M 02 Jul 2021 19:40:23.258 # IP address for this node updated to 10.10.10.121

3543:M 02 Jul 2021 19:40:25.281 * Replica 10.10.10.125:7000 asks for synchronization

3543:M 02 Jul 2021 19:40:25.281 * Partial resynchronization not accepted: Replication ID mismatch (Replica asked for '1f42a85e22d8a19817844aeac14fbb8201a6fc88', my replication IDs are '9f8db08a36207c17800f75487b193a624f17f091' and '0000000000000000000000000000000000000000')

3543:M 02 Jul 2021 19:40:25.281 * Replication backlog created, my new replication IDs are '21abfca3b9405356569b2684c6d68c0d2ec19b3b' and '0000000000000000000000000000000000000000'

3543:M 02 Jul 2021 19:40:25.281 * Starting BGSAVE for SYNC with target: disk

3543:M 02 Jul 2021 19:40:25.284 * Background saving started by pid 3289

3289:C 02 Jul 2021 19:40:25.312 * DB saved on disk

3289:C 02 Jul 2021 19:40:25.313 * RDB: 0 MB of memory used by copy-on-write

3543:M 02 Jul 2021 19:40:25.369 * Background saving terminated with success

3543:M 02 Jul 2021 19:40:25.369 * Synchronization with replica 10.10.10.125:7000 succeeded

3543:M 02 Jul 2021 19:40:28.180 # Cluster state changed: ok

And the replica’s log file:

11531:M 02 Jul 2021 19:40:23.253 # configEpoch set to 4 via CLUSTER SET-CONFIG-EPOCH

11531:M 02 Jul 2021 19:40:23.357 # IP address for this node updated to 10.10.10.124

11531:S 02 Jul 2021 19:40:25.277 * Before turning into a replica, using my own master parameters to synthesize a cached master: I may be able to synchronize with the new master with just a partial transfer.

11531:S 02 Jul 2021 19:40:25.277 * Connecting to MASTER 10.10.10.123:7000

11531:S 02 Jul 2021 19:40:25.277 * MASTER <-> REPLICA sync started

11531:S 02 Jul 2021 19:40:25.277 # Cluster state changed: ok

11531:S 02 Jul 2021 19:40:25.277 * Non blocking connect for SYNC fired the event.

11531:S 02 Jul 2021 19:40:25.278 * Master replied to PING, replication can continue...

11531:S 02 Jul 2021 19:40:25.278 * Trying a partial resynchronization (request 7d8da986c7e699fe33002d10415f98e91203de01:1).

11531:S 02 Jul 2021 19:40:25.279 * Full resync from master: 99a8defc35b459b7b73277933aa526d3f72ae76e:0

11531:S 02 Jul 2021 19:40:25.279 * Discarding previously cached master state.

11531:S 02 Jul 2021 19:40:25.299 * MASTER <-> REPLICA sync: receiving 175 bytes from master to disk

11531:S 02 Jul 2021 19:40:25.299 * MASTER <-> REPLICA sync: Flushing old data

11531:S 02 Jul 2021 19:40:25.300 * MASTER <-> REPLICA sync: Loading DB in memory

11531:S 02 Jul 2021 19:40:25.306 * Loading RDB produced by version 6.2.4

11531:S 02 Jul 2021 19:40:25.306 * RDB age 0 seconds

11531:S 02 Jul 2021 19:40:25.306 * RDB memory usage when created 2.60 Mb

11531:S 02 Jul 2021 19:40:25.306 * MASTER <-> REPLICA sync: Finished with success

11531:S 02 Jul 2021 19:40:25.308 * Background append only file rewriting started by pid 2487

11531:S 02 Jul 2021 19:40:25.342 * AOF rewrite child asks to stop sending diffs.

2487:C 02 Jul 2021 19:40:25.342 * Parent agreed to stop sending diffs. Finalizing AOF...

2487:C 02 Jul 2021 19:40:25.342 * Concatenating 0.00 MB of AOF diff received from parent.

2487:C 02 Jul 2021 19:40:25.343 * SYNC append only file rewrite performed

2487:C 02 Jul 2021 19:40:25.343 * AOF rewrite: 0 MB of memory used by copy-on-write

11531:S 02 Jul 2021 19:40:25.411 * Background AOF rewrite terminated with success

11531:S 02 Jul 2021 19:40:25.411 * Residual parent diff successfully flushed to the rewritten AOF (0.00 MB)

11531:S 02 Jul 2021 19:40:25.411 * Background AOF rewrite finished successfully

Monitoring Redis Cluster Nodes

To know the status of each Redis node, you can use the following command:

$ redis-cli -h 10.10.10.121 -p 7000 cluster nodes

184ada329264e994781412f3986c425a248f386e 10.10.10.126:7000@17000 slave 5cc0f693985913c553c6901e102ea3cb8d6678bd 0 1625255155519 2 connected

5cc0f693985913c553c6901e102ea3cb8d6678bd 10.10.10.122:7000@17000 master - 0 1625255153513 2 connected 5461-10922

22de56650b3714c1c42fc0d120f80c66c24d8795 10.10.10.123:7000@17000 master - 0 1625255151000 3 connected 10923-16383

ad0f5210dda1736a1b5467cd6e797f011a192097 10.10.10.125:7000@17000 slave 4394d8eb03de1f524b56cb385f0eb9052ce65283 0 1625255153000 1 connected

8675cd30fdd4efa088634e50fbd5c0675238a35e 10.10.10.124:7000@17000 slave 22de56650b3714c1c42fc0d120f80c66c24d8795 0 1625255154515 3 connected

4394d8eb03de1f524b56cb385f0eb9052ce65283 10.10.10.121:7000@17000 myself,master - 0 1625255152000 1 connected 0-5460

You can also filter the output using the grep linux command to check only the master nodes:

$ redis-cli -h 10.10.10.121 -p 7000 cluster nodes  | grep master

5cc0f693985913c553c6901e102ea3cb8d6678bd 10.10.10.122:7000@17000 master - 0 1625255389768 2 connected 5461-10922

22de56650b3714c1c42fc0d120f80c66c24d8795 10.10.10.123:7000@17000 master - 0 1625255387000 3 connected 10923-16383

4394d8eb03de1f524b56cb385f0eb9052ce65283 10.10.10.121:7000@17000 myself,master - 0 1625255387000 1 connected 0-5460

Or even the slave nodes:

$ redis-cli -h 10.10.10.121 -p 7000 cluster nodes  | grep slave

184ada329264e994781412f3986c425a248f386e 10.10.10.126:7000@17000 slave 5cc0f693985913c553c6901e102ea3cb8d6678bd 0 1625255395795 2 connected

ad0f5210dda1736a1b5467cd6e797f011a192097 10.10.10.125:7000@17000 slave 4394d8eb03de1f524b56cb385f0eb9052ce65283 0 1625255395000 1 connected

8675cd30fdd4efa088634e50fbd5c0675238a35e 10.10.10.124:7000@17000 slave 22de56650b3714c1c42fc0d120f80c66c24d8795 0 1625255393000 3 connected

Redis Cluster Auto Failover

Let’s test the auto failover feature in Redis Cluster. For this, we are going to stop the Redis Service in one master node, and see what happens.

On Master 2 - 10.10.10.122:

$ systemctl stop redis
$ systemctl status redis |grep Active
   Active: inactive (dead) since Fri 2021-07-02 19:53:41 UTC; 1h 4min ago

Now, let’s check the output of the command that we used in the previous section to monitor the Redis nodes:

$ redis-cli -h 10.10.10.121 -p 7000 cluster nodes

184ada329264e994781412f3986c425a248f386e 10.10.10.126:7000@17000 master - 0 1625255654350 7 connected 5461-10922

5cc0f693985913c553c6901e102ea3cb8d6678bd 10.10.10.122:7000@17000 master,fail - 1625255622147 1625255621143 2 disconnected

22de56650b3714c1c42fc0d120f80c66c24d8795 10.10.10.123:7000@17000 master - 0 1625255654000 3 connected 10923-16383

ad0f5210dda1736a1b5467cd6e797f011a192097 10.10.10.125:7000@17000 slave 4394d8eb03de1f524b56cb385f0eb9052ce65283 0 1625255656366 1 connected

8675cd30fdd4efa088634e50fbd5c0675238a35e 10.10.10.124:7000@17000 slave 22de56650b3714c1c42fc0d120f80c66c24d8795 0 1625255655360 3 connected

4394d8eb03de1f524b56cb385f0eb9052ce65283 10.10.10.121:7000@17000 myself,master - 0 1625255653000 1 connected 0-5460

As you can see, one of the slave nodes was promoted to master, in this case, Slave 3 - 10.10.10.126, so the auto failover worked as expected.

Conclusion

Redis is a good option in case you want to use an in-memory datastore. As you can see in this blog post, the installation is not rocket science and the usage of Redis Cluster is explained in its official documentation. This blog just covers the basic installation and test steps, but you can also improve this by, for example, adding authentication in the Redis configuration, or even running a benchmark using the redis-benchmark tool to check performance.


Redis How To: Installation, setup and configuration

$
0
0

Twitter, GitHub, Pinterest, Snapchat, Craigslist, StackOverflow and Flickr just to name a few are the companies that are adopting Redis either for their storage or as a cache to boost performance. Redis is an in-memory data structure store that can be used as a database, cache, message broker and an open-source (BSD licensed). The word Redis is derived from REmote Dictionary Server.
The history of Redis begins in 2009 when Salvatore Sanfilippo, the original author of Redis, encountered significant obstacles in scaling some types of workloads using traditional database systems. This issue started to become famous and get more interest after he announced the project on Hacker News. 

In this blog post, we will go through the steps to install Redis, setup and configuration.

Top 5 Benefits of Redis

Redis is written in ANSI C and runs in most POSIX systems like Linux, BSD, and OS X, with no external dependencies required. Moreover, Redis supports data structures like strings, hashes, lists, sets, and sorted sets with range queries, bitmaps, hyperloglogs, also geospatial indexes with radius queries. Let’s take a look at the top 5 benefits of using Redis with some details:

  1. In-memory data store

  2. Most of the databases store their data on disk or SSD, but for Redis the data remains in the server’s main memory. By doing this, it eliminates the need for a roundtrip to disk which results in blazing fast performance with average read or write operations taking less than a millisecond.

  3. Simplicity and ease-of-use

  4. With this simplicity, you may write fewer lines of code in your applications for the purpose of storing, accessing and using the data. Redis supports languages like Java, Python, PHP, C, C++, C#, JavaScript, Node.js, Ruby, R, Go etc.

  5. High availability and scalability

  6. Redis can be deployed either as a primary-replica architecture in a single node primary or a clustered topology which allows us to build highly available solutions. High availability can be achieved through Redis Sentinel plus automatic partitioning across multiple Redis nodes with Redis Cluster.

  7. Replication and persistence

  8. Redis supports asynchronous replication where data can be replicated to many replica servers. For persistence, it supports point-in-time backups.

  9. Extensibility

  10. Even though Redis is an open-source project, it has a very active community.

How To Install Redis Using Source

For simplification, we will install and run Redis in a standalone server without any high availability setup. If you are interested in high availability using Redis Sentinel, we recommend learning more about that in this blog post. 

While you could install Redis using the package manager of your Linux distribution, nevertheless, this approach is discouraged to avoid installing an outdated version. The best way to install Redis is by compiling it from sources as they have no dependencies. The only prerequisites are a GCC compiler for your system and libc. In this example, we will install Redis on a Ubuntu 20.04 server. 

The first step is to download the latest version of Redis tarball. You can choose whether you want to download from the redis.io website or you can simply use this URL that will redirect you to the latest stable version of Redis.

As mentioned before, we need GCC and libc to compile the source code. Since our test system does not have those packages yet, we will proceed to install them first by executing the following command. Typically it will take a while considering there are a lot of packages to be installed:

$ apt-get install build-essential -y

Now let’s go ahead and download the tarball - we will use the second option to download it since this is the easier way to do it. Once the tarball is ready and we may proceed to extract the file:

$ wget http://download.redis.io/redis-stable.tar.gz
$ tar xvzf redis-stable.tar.gz

The next 2 steps are to navigate into the extracted directory and run the compiler.

$ cd redis-stable
$ make

If you run the compilation without installing GCC and libc packages, the following error will appear:

zmalloc.h:50:10: fatal error: jemalloc/jemalloc.h: No such file or directory
 #include <jemalloc/jemalloc.h>
          ^~~~~~~~~~~~~~~~~~~~~

To fix the error, you may simply run the following command. If there is no error, the command does not need to be executed:

$ make distclean

Once the compilation is complete, you should see the message that suggests running “make test” like below. This is an optional step however we recommend doing so to make sure the previous process ran properly. The final step is to execute the following command to make sure “redis-server” and “redis-cli” are moved to the correct directory:

$ make install

cd src && make install

make[1]: Entering directory '/root/redis/redis-stable/src'

    CC Makefile.dep

Hint: It's a good idea to run 'make test' ;)

    INSTALL redis-server

    INSTALL redis-benchmark

    INSTALL redis-cli

We may verify all Redis files are moved to that directory:

$ ls /usr/local/bin/ |grep redis
redis-benchmark
redis-check-aof
redis-check-rdb
redis-cli
redis-sentinel
redis-server

To start Redis, simply type “redis-server” and you will see the welcome message as follows:

How To Make Redis Application Friendly

It’s worth mentioning that the installation that we went through just now is only suitable for the purpose of testing and development. In order for us to make Redis more application friendly, we could either run Redis using “screen” or do a proper install using an init script (the most suggested option). In this section, we will go through the steps on how to configure init script for Redis providing both “redis-server” and “redis-cli” already copied to /usr/local/bin

The first step is to create the following directory to store your Redis config files:

$ mkdir /etc/redis
$ mkdir /var/redis

Copy the init script that is available in the “utils” directory (from the previously extracted tarball) into /etc/init.d. The best suggestion for the name is by calling it with the port number for Redis. For our case, since we are using a default port, we can use the following:

$ cp utils/redis_init_script /etc/init.d/redis_6379

The next step is to edit the init file and modify the parameter for the port if you are using a different port other than the default. Skip this step if you are using port 6379.

$ vi /etc/init.d/redis_6379

Copy the template configuration file that is available in the root directory of our extracted distribution tarball into /etc/redis/ and preferably use the port number as a name:

$ cp redis.conf /etc/redis/6379.conf

Now, create the following directory inside /var/redis. This directory will work as the data and working directory for our Redis instance:

$ mkdir /var/redis/6379

We need to make some adjustments on the configuration file to the following parameters (this is important):

$ /etc/redis/6379.conf

daemonize yes

pidfile /var/run/redis_6379.pid (modify the port according to your setting)

port 6379 (modify the port according to your setting)

loglevel notice (modify to your preferred level)

logfile /var/log/redis_6379.log

dir /var/redis/6379 (important)

The last step is to add our Redis init script to all default runlevels with the following command and start our instance. Test with redis-cli to make sure it’s running properly:

$ update-rc.d redis_6379 defaults
$ /etc/init.d/redis_6379 start
$ redis-cli
127.0.0.1:6379> info server
# Server
redis_version:6.2.4
redis_git_sha1:00000000
redis_git_dirty:0
redis_build_id:3b0db603495bd2d2
redis_mode:standalone
os:Linux 4.19.0-17-amd64 x86_64
arch_bits:64
multiplexing_api:epoll
atomicvar_api:c11-builtin
gcc_version:8.3.0
process_id:20732
process_supervised:no
run_id:27bfed8c945c506789f08cdff6ee0be2dd17ce16
tcp_port:6379
server_time_usec:1624898338307033
uptime_in_seconds:934
uptime_in_days:0
hz:10
configured_hz:10
lru_clock:14285602
executable:/usr/local/bin/redis-server
config_file:/etc/redis/6379.conf
io_threads_active:0

In the event that you are not able to get the Redis instance running, you may troubleshoot the error from the log that you set (for example /var/log/redis_6379.log). However, the log name is probably different if you use other names than the default.

The previous configuration that we just completed is suited for Debian or Ubuntu-based distributions and not tested in other distributions. Even though the installation through the package manager is not suggested, you are still able to install it if you would like to run Redis in other distributions. We hope this blog post will benefit you to some extent

Importance of Append-only File in Redis

$
0
0

While looking around Redis data directory you may have noticed several files, among them a file with .aof extension. 

root@vagrant:~# ls -alh /var/lib/redis/
total 54M
drwxr-x---  2 redis redis 4.0K Jul  1 10:40 .
drwxr-xr-x 39 root  root  4.0K Jun 17 11:32 ..
-rw-r-----  1 redis redis  39M Jun 25 09:56 appendonly.aof
-rw-rw----  1 redis redis  16M Jul  1 10:36 dump.rdb

You may wonder what it is and what its role is. Actually, it is quite an important file for your Redis installation. Let’s have a quick look at it and see what it is for.

Snapshotting basics

First, the basics. Redis is an in-memory data store which means that all the data you store in it will reside in memory. As we all know, memory is quite volatile storage and cannot be trusted with any serious data. If we use Redis for storing data we can easily recreate (for example, a caching layer), this may be acceptable (even though, as we discussed in one of our earlier blogs, it still is better to have backups of your cache nodes) but generally speaking we would like to persist our data on disk so that it can survive restart of the nodes (no matter if it is a planned maintenance or a crash).

Luckily, Redis comes with a mechanism of snapshotting the data to disk. It can be invoked by hand through SAVE or BGSAVE commands in Redis. 

127.0.0.1:6379> SAVE
OK
127.0.0.1:6379> BGSAVE
Background saving started

Former will happen immediately, interfering with the operations on the database, latter will spawn a child process that will perform the dump, minimizing the impact to the performance of the Redis datastore.

Redis may also be configured to automatically snapshot the data.

127.0.0.1:6379> CONFIG GET save
1) "save"
2) "10 1000"

Here the snapshot will be performed every 10 seconds if at least 1000 changes to the dataset were made. You can reconfigure this setting to your liking:

127.0.0.1:6379> CONFIG SET save "5 1000"
OK

Here we have increased the frequency of the snapshotting as long as 1000 writes will happen.

This is ok but it is not ideal. Snapshots will be executed every second but you still may lose some data that happened within the last second. When using only the RDB snapshots you do not really have a proper durability.

Enters Append Only File

Given that RDB snapshot can’t deliver proper durability, Append Only File (AOF) has been created. The idea behind this is to store all of the changes that are happening in the database in the file. If you are familiar with other database systems like PostgreSQL or MySQL, you can think of it as a WAL or binary log. New entries are always appended (thus the name) so the writes are always sequential. This helps with performance, even with SSD sequential access is faster than the random one.

AOF has to be enabled in Redis configuration:

appendonly yes

Once enabled, it will take the role of a main source of truth regarding the status of the data. What it means is, whenever there will be a need to load the data, either after the restart or to provision replicas, AOF will be used for that.

Redis configuration file presents a couple more settings that govern the durability. First, appendfsync, defines if fsync is executed after every write to AOF. There are three options. ‘No’ means that fsync is not executed and when the data will be persisted on the disk depends on the settings of the operating system. Data will be persisted only when the filesystem cache will be flushed to disk and then persisted on the device. This is the fastest option but it does not provide proper durability regarding cases where the whole node crashes or is restarted. Second option, ‘everysec’, means that the fsync is performed after every second so, theoretically, assuming that the disk will persist data immediately after receiving the write, it is possible to lose up to a second of data. Third option, ‘always’, means that the fsync is performed after every write. This is the most expensive option performance-wise but it guarantees the best durability.

AOF file eventually will have to be rewritten otherwise it will grow indefinitely. How it is going to be done depends on the configuration: auto-aof-rewrite-percentage and auto-aof-rewrite-min-size define when exactly AOF should be rewritten. To reduce the length of the AOF it is also possible to combine RDB and AOF into one file. The setting aof-use-rdb-preamble, when enabled, means that the AOF file will be split into two parts. One would be RDB file and then the AOF tail. RDB will contain the snapshot of the database at the given moment and then AOF tail will continue keeping the track of the changes.

As we mentioned, AOF is quite useful for multiple purposes. First, it is obviously a way to persist the data stored in Redis. Then, when you use replication across Redis instances, replicas will reach out to the master and ask for the missing data. Such data will be read from AOF, making sure that the replica is up to data.

You can clearly see that the Append-only File has numerous functions. While not a must-have, it is the only way to obtain proper durability in Redis.

Running Vitess and MySQL with ClusterControl

$
0
0

For all who are not familiar with Vitess, it is a MySQL-based database system that is intended to deliver an easy-to-scale, sharded, relational database management system. We will not get into details about the design but, in short, Vitess consists of proxy nodes that route the requests, gateways that are managing the database nodes and, finally, MySQL database nodes themselves, which are intended to store the data. If we are talking about MySQL, one may think if there is an option to, actually, use external tools like, for example, ClusterControl to manage those underlying databases. Short answer is “yes”. Longer answer will be this blog post.

MySQL in Vitess

First of all, we want to spend a bit of time talking about how Vitess uses MySQL. The high level architecture is described on the Vitess documentation page. In short, we have VTGate that acts as a proxy, we have a Topology Service which is a metadata store based on Zookeeper, Consul or Etcd, where all the information about the nodes in the system is located, finally we have VTTablets, which act as a middleman between VTGate and MySQL instance. MySQL instances can be standalone or they can be configured using standard asynchronous (or semi synchronous) replication. MySQL is used to store data. Data can be split into shards, in that case a MySQL instance will contain a subset of the data.

All this works great. Vitess is able to determine which node is the master, which nodes are slaves, routing queries accordingly. There are several issues, though. Not all of the most basic functionality is delivered by Vitess. Topology detection and query routing, yes. Backups - yes as well, Vitess can be configured to take backups of the data and allow users to restore whatever has been backed up. Unfortunately, there is no internal support for automated failover. There is no proper trending UI that would help users to understand the state of the databases and their workload. Luckily, as we are talking about standard MySQL, we can easily use external solutions to accomplish this. For example, for failover, Vitess can be integrated with Orchestrator. Let’s take a look at how ClusterControl can be used in conjunction with Vitess to provide management, monitoring and failover.

Deploying a new database cluster using ClusterControl

First, let’s have a new cluster deployed. As usual with ClusterControl, you have to provision hardware and ensure that ClusterControl can access those nodes using SSH.

First, we have to define SSH connectivity.

Next, we’ll pick the vendor and version. According to the documentation, Vitess supports MySQL and Percona Server in versions 5.7 and 8.0 (although it does not support caching_sha2_password method so you have to be careful when creating users). It also supports MariaDB up to 10.3.

Finally, we define the topology. After clicking on “Deploy”, ClusterControl will perform the cluster deployment.

Once it’s ready, you should see the cluster and you should be able to manage it using ClusterControl. If Auto Recovery for Cluster and Node are enabled, ClusterControl will perform automated failovers should that be needed. 

You will also benefit from agent-based monitoring in the “Dashboard” section of the ClusterControl UI.

Importing the cluster to Vitess

As a next step we should have Vitess deployed. What we describe here is by no means a production-grade setup therefore we are going to cut some corners and just deploy Vitess suite on a single node following the tutorial from Vitess documentation. To make it easier to deal with, we’ll go with the Local Install guide, which will deploy all of the services, along with example databases on a single node. Make it large enough to accommodate them. For testing purposes a node with a couple CPU cores and 4GB of memory should be enough.

Let’s assume that everything went just fine and you have a local Vitess deployment running on the node. The next step will be to import our cluster deployed by ClusterControl into Vitess. For that we have to run two more VTTablets. First, we shall create directories for those VTTablets:

vagrant@vagrant:~$ cd /home/vagrant/my-vitess-example/
vagrant@vagrant:~/my-vitess-example$ source env.sh
vagrant@vagrant:~/my-vitess-example$ mkdir $VTDATAROOT/vt_0000000401
vagrant@vagrant:~/my-vitess-example$ mkdir $VTDATAROOT/vt_0000000402

Then, on the database, we are going to create a user that will be used for Vitess to connect and manage the database.

mysql> CREATE USER vtuser@'%' IDENTIFIED BY 'pass';
Query OK, 0 rows affected (0.01 sec)
mysql> GRANT ALL ON *.* TO vtuser@'%' WITH GRANT OPTION;
Query OK, 0 rows affected (0.01 sec)

If we want, we may also want to create more users. Vitess allows us to pass a couple of users with different access privileges: application user, DBA user, replication user, fully privileged user and a couple more.

The last thing we have to do is to disable the super_read_only on all MySQL nodes as Vitess will attempt to create metadata on the replica, resulting in a failed attempt to start vttablet service.

Once this is done, we should start VTTablets. In both case we have to ensure that the ports are unique and that we pass correct credentials to access the database instance:

vttablet $TOPOLOGY_FLAGS -logtostderr -log_queries_to_file $VTDATAROOT/tmp/vttablet_0000000401_querylog.txt -tablet-path "zone1-0000000401" -init_keyspace clustercontrol -init_shard 0 -init_tablet_type replica -port 15401 -grpc_port 16401 -service_map 'grpc-queryservice,grpc-tabletmanager,grpc-updatestream' -pid_file $VTDATAROOT/vt_0000000401/vttablet.pid -vtctld_addr http://localhost:15000/ -db_host 10.0.0.181 -db_port 3306 -db_app_user vtuser -db_app_password pass -db_dba_user vtuser -db_dba_password pass -db_repl_user vtuser -db_repl_password pass -db_filtered_user vtuser -db_filtered_password pass -db_allprivs_user vtuser -db_allprivs_password pass -init_db_name_override clustercontrol -init_populate_metadata &

vttablet $TOPOLOGY_FLAGS -logtostderr -log_queries_to_file $VTDATAROOT/tmp/vttablet_0000000402_querylog.txt -tablet-path "zone1-0000000402" -init_keyspace clustercontrol -init_shard 0 -init_tablet_type replica -port 15402 -grpc_port 16402 -service_map 'grpc-queryservice,grpc-tabletmanager,grpc-updatestream' -pid_file $VTDATAROOT/vt_0000000402/vttablet.pid -vtctld_addr http://localhost:15000/ -db_host 10.0.0.182 -db_port 3306 -db_app_user vtuser -db_app_password pass -db_dba_user vtuser -db_dba_password pass -db_repl_user vtuser -db_repl_password pass -db_filtered_user vtuser -db_filtered_password pass -db_allprivs_user vtuser -db_allprivs_password pass -init_db_name_override clustercontrol -init_populate_metadata &

Once it is ready, we can check how Vitess sees the new VTTablets:

vagrant@vagrant:~/my-vitess-example$ mysql

Welcome to the MySQL monitor.  Commands end with ; or \g.

Your MySQL connection id is 10

Server version: 5.7.9-vitess-10.0.2 Version: 10.0.2 (Git revision fc78470 branch 'HEAD') built on Thu May 27 08:45:22 UTC 2021 by runner@fv-az204-619 using go1.15.12 linux/amd64


Copyright (c) 2000, 2021, Oracle and/or its affiliates.


Oracle is a registered trademark of Oracle Corporation and/or its

affiliates. Other names may be trademarks of their respective

owners.


Type 'help;' or '\h' for help. Type '\c' to clear the current input statement.


mysql> SHOW vitess_tablets;

+-------+----------------+-------+------------+---------+------------------+------------+----------------------+

| Cell  | Keyspace       | Shard | TabletType | State   | Alias            | Hostname   | MasterTermStartTime  |

+-------+----------------+-------+------------+---------+------------------+------------+----------------------+

| zone1 | clustercontrol | 0     | REPLICA    | SERVING | zone1-0000000401 | vagrant.vm |                      |

| zone1 | clustercontrol | 0     | REPLICA    | SERVING | zone1-0000000402 | vagrant.vm |                      |

| zone1 | commerce       | 0     | MASTER     | SERVING | zone1-0000000100 | vagrant.vm | 2021-07-08T13:12:21Z |

| zone1 | commerce       | 0     | REPLICA    | SERVING | zone1-0000000101 | vagrant.vm |                      |

| zone1 | commerce       | 0     | RDONLY     | SERVING | zone1-0000000102 | vagrant.vm |                      |

+-------+----------------+-------+------------+---------+------------------+------------+----------------------+

5 rows in set (0.00 sec)

Nodes are there but both are reported as replicas by Vitess. We can now trigger Vitess to check the topology for our real master (node that we imported with ID of 401)

vagrant@vagrant:~/my-vitess-example$ vtctlclient TabletExternallyReparented zone1-401

Now all looks correct:

mysql> SHOW vitess_tablets;

+-------+----------------+-------+------------+---------+------------------+------------+----------------------+

| Cell  | Keyspace       | Shard | TabletType | State   | Alias            | Hostname   | MasterTermStartTime  |

+-------+----------------+-------+------------+---------+------------------+------------+----------------------+

| zone1 | clustercontrol | 0     | MASTER     | SERVING | zone1-0000000401 | vagrant.vm | 2021-07-08T13:27:34Z |

| zone1 | clustercontrol | 0     | REPLICA    | SERVING | zone1-0000000402 | vagrant.vm |                      |

| zone1 | commerce       | 0     | MASTER     | SERVING | zone1-0000000100 | vagrant.vm | 2021-07-08T13:12:21Z |

| zone1 | commerce       | 0     | REPLICA    | SERVING | zone1-0000000101 | vagrant.vm |                      |

| zone1 | commerce       | 0     | RDONLY     | SERVING | zone1-0000000102 | vagrant.vm |                      |

+-------+----------------+-------+------------+---------+------------------+------------+----------------------+

5 rows in set (0.00 sec)

Integrating ClusterControl automated failover into Vitess

The last bit we want to take a look at is the automated failover handling with ClusterControl and see how you can integrate it with Vitess. It will be quite similar to what we have just seen. The main problem to deal with is that the failover does not change anything in the Vitess. The solution is what we have used earlier, TabletExternallyReparented command. The only challenge is to trigger it when the failover happens. Luckily, ClusterControl comes with hooks that allow us to plug into the failover process. We’ll use them to run the vtctlclient. It has to be installed on the ClusterControl instance first, though. The easiest way to accomplish that is just by copying the binary from Vitess instance to ClusterControl.

First, let’s create the directory on the ClusterControl node:

mkdir -r /usr/local/vitess/bin

Then, just copy the file:

scp /usr/local/vitess/bin/vtctlclient root@10.0.0.180:/usr/local/vitess/bin/

As a next step, we have to create a script that will execute the command to reparent shards. We will use replication_post_failover_script and replication_post_switchover_script. Cmon will execute the script with several arguments. We are interested in the third of them, it will contain the hostname of the master candidate - the node that has been picked as a new master.

The example script may look something like this.

#!/bin/bash

if [[ $3 == 10.0.0.181 ]] ; then tablet="zone1-401" ; fi

if [[ $3 == 10.0.0.182 ]] ; then tablet="zone1-402" ; fi

vitess="10.0.0.50"

/usr/local/vitess/bin/vtctlclient -server ${vitess}:15999 TabletExternallyReparented ${tablet}

Please keep in mind that this is just a bare minimum that works. You should implement a more detailed script that will perform maybe additional sanity checks. Instead of hardcoding the hostnames and tablet names you may actually query ClusterControl to get the list of nodes in the cluster, then you may want to compare it with the contents of the Topology Service to see which tablet alias should be used.

Once we are ready with the script, we should configure it to be executed by ClusterControl:

We can test this by manually promoting the replica. The initial state, as seen by Vitess, was:

mysql> SHOW vitess_tablets;

+-------+----------------+-------+------------+---------+------------------+------------+----------------------+

| Cell  | Keyspace       | Shard | TabletType | State   | Alias            | Hostname   | MasterTermStartTime  |

+-------+----------------+-------+------------+---------+------------------+------------+----------------------+

| zone1 | clustercontrol | 0     | MASTER     | SERVING | zone1-0000000401 | vagrant.vm | 2021-07-08T13:27:34Z |

| zone1 | clustercontrol | 0     | REPLICA    | SERVING | zone1-0000000402 | vagrant.vm |                      |

| zone1 | commerce       | 0     | MASTER     | SERVING | zone1-0000000100 | vagrant.vm | 2021-07-08T13:12:21Z |

| zone1 | commerce       | 0     | REPLICA    | SERVING | zone1-0000000101 | vagrant.vm |                      |

| zone1 | commerce       | 0     | RDONLY     | SERVING | zone1-0000000102 | vagrant.vm |                      |

+-------+----------------+-------+------------+---------+------------------+------------+----------------------+

5 rows in set (0.00 sec)

We are interested in ‘clustercontrol’ keyspace. 401 (10.0.0.181) was the master and 402 (10.0.0.182) was the replica.

We can promote 10.0.0.182 to become a new master. Job starts and we can see that our script was executed:

Finally, job is completed:

All went well in the ClusterControl. Let’s take a look at Vitess:

mysql> SHOW vitess_tablets;
+-------+----------------+-------+------------+---------+------------------+------------+----------------------+
| Cell  | Keyspace       | Shard | TabletType | State   | Alias            | Hostname   | MasterTermStartTime  |
+-------+----------------+-------+------------+---------+------------------+------------+----------------------+
| zone1 | clustercontrol | 0     | MASTER     | SERVING | zone1-0000000402 | vagrant.vm | 2021-07-09T13:38:00Z |
| zone1 | clustercontrol | 0     | REPLICA    | SERVING | zone1-0000000401 | vagrant.vm |                      |
| zone1 | commerce       | 0     | MASTER     | SERVING | zone1-0000000100 | vagrant.vm | 2021-07-08T13:12:21Z |
| zone1 | commerce       | 0     | REPLICA    | SERVING | zone1-0000000101 | vagrant.vm |                      |
| zone1 | commerce       | 0     | RDONLY     | SERVING | zone1-0000000102 | vagrant.vm |                      |
+-------+----------------+-------+------------+---------+------------------+------------+----------------------+
5 rows in set (0.00 sec)

As you can see, all is ok here as well. 402 is the new master and 401 is marked as the replica.

Of course, this is just an example of how you can benefit from ClusterControl's ability to monitor and manage your MySQL databases while still being able to leverage Vitess' ability to scale out and shard the data. Vitess is a great tool but it lacks a couple of elements. Luckily, ClusterControl can back you up in those cases.

How to Configure PostgreSQL Sharding with ClusterControl

$
0
0

Sometimes it is hard to manage a large amount of data in a company, especially with the exponential increment of Data Analytics and IoT usage. Depending on the size, this amount of data could affect the performance of your systems and you will probably need to scale your databases or find a way to fix this. There are different ways to scale your PostgreSQL databases and one of them is Sharding. In this blog, we will see what Sharding is and how to configure it in PostgreSQL using ClusterControl to simplify the task.

What is Sharding?

Sharding is the action of optimizing a database by separating data from a big table into multiple small ones. Smaller tables are Shards (or partitions). Partitioning and Sharding are similar concepts. The main difference is that sharding implies the data is spread across multiple computers while partitioning is about grouping subsets of data within a single database instance.

There are two types of Sharding:

  • Horizontal Sharding: Each new table has the same schema as the big table but unique rows. It is useful when queries tend to return a subset of rows that are often grouped together.

  • Vertical Sharding: Each new table has a schema that is a subset of the original table’s schema. It is useful when queries tend to return only a subset of columns of the data.

Let’s see an example:

Original Table

ID

Name

Age

Country

1

James Smith

26

USA

2

Mary Johnson

31

Germany

3

Robert Williams

54

Canada

4

Jennifer Brown

47

France


Vertical Sharding

Shard1

Shard2

ID

Name

Age

ID

Country

1

James Smith

26

1

USA

2

Mary Johnson

31

2

Germany

3

Robert Williams

54

3

Canada

4

Jennifer Brown

47

4

France

Horizontal Sharding

Shard1

Shard2

ID

Name

Age

Country

ID

Name

Age

Country

1

James Smith

26

USA

3

Robert Williams

54

Canada

2

Mary Johnson

31

Germany

4

Jennifer Brown

47

France

Sharding involves splitting data into two or more smaller chunks, called logical shards. The logical shards are distributed across separate database nodes, called physical shards, which can hold multiple logical shards. The data held within all the shards represent an entire logical dataset.

Now that we reviewed some Sharding concepts, let’s proceed to the next step.

How to Deploy a PostgreSQL Cluster?

We will use ClusterControl for this task. If you are not using ClusterControl yet, you can install it and deploy or import your current PostgreSQL database selecting the “Import” option and follow the steps to take advantage of all the ClusterControl features like backups, automatic failover, alerts, monitoring, and more.

To perform a deployment from ClusterControl, simply select the “Deploy” option and follow the instructions that appear.

When selecting PostgreSQL, you must specify your User, Key or Password, and Port to connect by SSH to your servers. You can also add a name for your new cluster and if you want, you can also use ClusterControl to install the corresponding software and configurations for you.

After setting up the SSH access information, you need to define the database credentials, version, and datadir (optional). You can also specify which repository to use.

For the next step, you need to add your servers to the cluster that you are going to create using the IP Address or Hostname.

In the last step, you can choose if your replication will be Synchronous or Asynchronous, and then just press on “Deploy”.

Once the task is finished, you will see your new PostgreSQL cluster in the main ClusterControl screen.

Now that you have your cluster created, you can perform several tasks on it like adding a load balancer (HAProxy), connection pooler (pgBouncer), or a new replica.

Repeat the process to have at least two separate PostgreSQL clusters to configure Sharding, which is the next step.

How to Configure PostgreSQL Sharding?

Now we will configure Sharding using PostgreSQL Partitions and Foreign Data Wrapper (FDW). This functionality allows PostgreSQL to access data stored in other servers. It is an extension available by default in the common PostgreSQL installation. 

We will use the following environment:

Servers: Shard1 - 10.10.10.137, Shard2 - 10.10.10.138
Database User: admindb
Table: customers

To enable the FDW extension, you just need to run the following command in your main server, in this case, Shard1:

postgres=# CREATE EXTENSION postgres_fdw;
CREATE EXTENSION

Now let’s create the table customers partitioned by registered date:

postgres=# CREATE TABLE customers (
  id INT NOT NULL,
  name VARCHAR(30) NOT NULL,
  registered DATE NOT NULL
)
PARTITION BY RANGE (registered);

And the following partitions:

postgres=# CREATE TABLE customers_2021
    PARTITION OF customers
    FOR VALUES FROM ('2021-01-01') TO ('2022-01-01');
postgres=# CREATE TABLE customers_2020
    PARTITION OF customers
    FOR VALUES FROM ('2020-01-01') TO ('2021-01-01');

These Partitions are locals. Now let’s insert some test values and check them:

postgres=# INSERT INTO customers (id, name, registered) VALUES (1, 'James', '2020-05-01');
postgres=# INSERT INTO customers (id, name, registered) VALUES (2, 'Mary', '2021-03-01');

Here you can query the main partition to see all the data:

postgres=# SELECT * FROM customers;

 id | name  | registered

----+-------+------------

  1 | James | 2020-05-01

  2 | Mary  | 2021-03-01

(2 rows)

Or even query the corresponding partition:

postgres=# SELECT * FROM customers_2021;

 id | name | registered

----+------+------------

  2 | Mary | 2021-03-01

(1 row)

postgres=# SELECT * FROM customers_2020;

 id | name  | registered

----+-------+------------

  1 | James | 2020-05-01

(1 row)


As you can see, data was inserted in different partitions, according to the registered date. Now, in the remote node, in this case Shard2, let’s create another table:

postgres=# CREATE TABLE customers_2019 (

    id INT NOT NULL,

    name VARCHAR(30) NOT NULL,

    registered DATE NOT NULL);

You need to create this Shard2 server in Shard1 in this way:

postgres=# CREATE SERVER shard2 FOREIGN DATA WRAPPER postgres_fdw OPTIONS (host '10.10.10.138', dbname 'postgres');

And the user to access it:

postgres=# CREATE USER MAPPING FOR admindb SERVER shard2 OPTIONS (user 'admindb', password 'Passw0rd');

Now, create the FOREIGN TABLE in Shard1:

postgres=# CREATE FOREIGN TABLE customers_2019
PARTITION OF customers
FOR VALUES FROM ('2019-01-01') TO ('2020-01-01')
SERVER shard2;

And let’s insert data in this new remote table from Shard1:

postgres=# INSERT INTO customers (id, name, registered) VALUES (3, 'Robert', '2019-07-01');

INSERT 0 1

postgres=# INSERT INTO customers (id, name, registered) VALUES (4, 'Jennifer', '2019-11-01');

INSERT 0 1

If everything went fine, you should be able to access the data from both Shard1 and Shard2:

Shard1:

postgres=# SELECT * FROM customers;

 id |   name   | registered

----+----------+------------

  3 | Robert   | 2019-07-01

  4 | Jennifer | 2019-11-01

  1 | James    | 2020-05-01

  2 | Mary     | 2021-03-01

(4 rows)

postgres=# SELECT * FROM customers_2019;

 id |   name   | registered

----+----------+------------

  3 | Robert   | 2019-07-01

  4 | Jennifer | 2019-11-01

(2 rows)

Shard2:

postgres=# SELECT * FROM customers_2019;

 id |   name   | registered

----+----------+------------

  3 | Robert   | 2019-07-01

  4 | Jennifer | 2019-11-01

(2 rows)

That’s it. Now you are using Sharding in your PostgreSQL Cluster.

Conclusion

Partitioning and Sharding in PostgreSQL are good features. It helps you in case you need to separate data in a big table to improve performance, or even to purge data in an easy way, among other situations. An important point when you are using Sharding is to choose a good shard key that distributes the data between the nodes in the best way. Also, you can use ClusterControl to simplify the PostgreSQL deployment and to take advantage of some features like monitoring, alerting, automatic failover, backup, point-in-time recovery, and more.

ClusterControl - Advanced Backup Management - mariabackup Part I

$
0
0

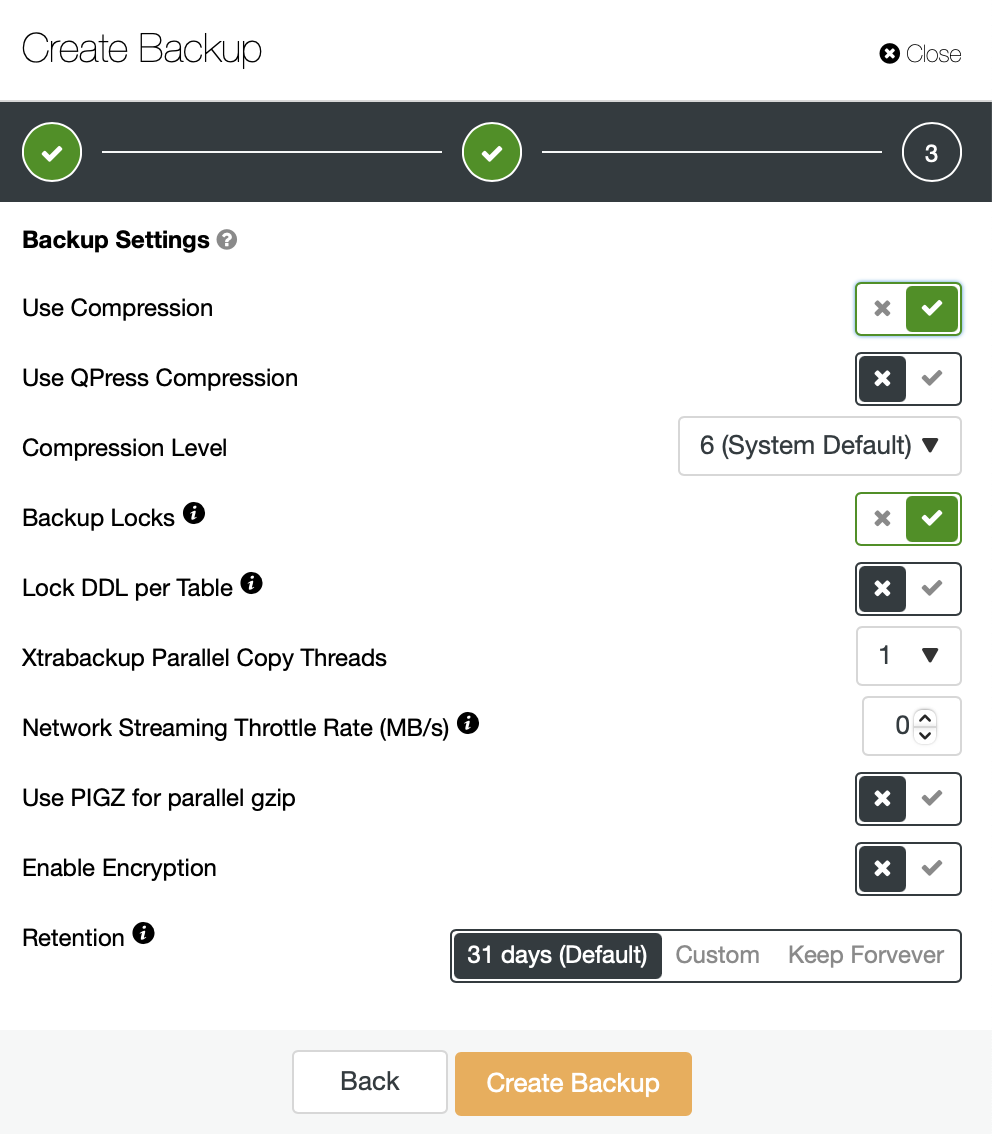
ClusterControl can, among others, act as a great tool to help you design and execute the backup schedule. Numerous features are available including backup verification, transparent backup encryption and many others. What is quite commonly missing is the ability of ClusterControl to tune backup tools that we use to create the backup. In this blog we would like to go over some of the settings that can be applied to MariaBackup. Let’s get started.

Initial setup

The initial setup is a MariaDB cluster with one master and one replica which is lagging at this moment due to the import of the data running in the background.

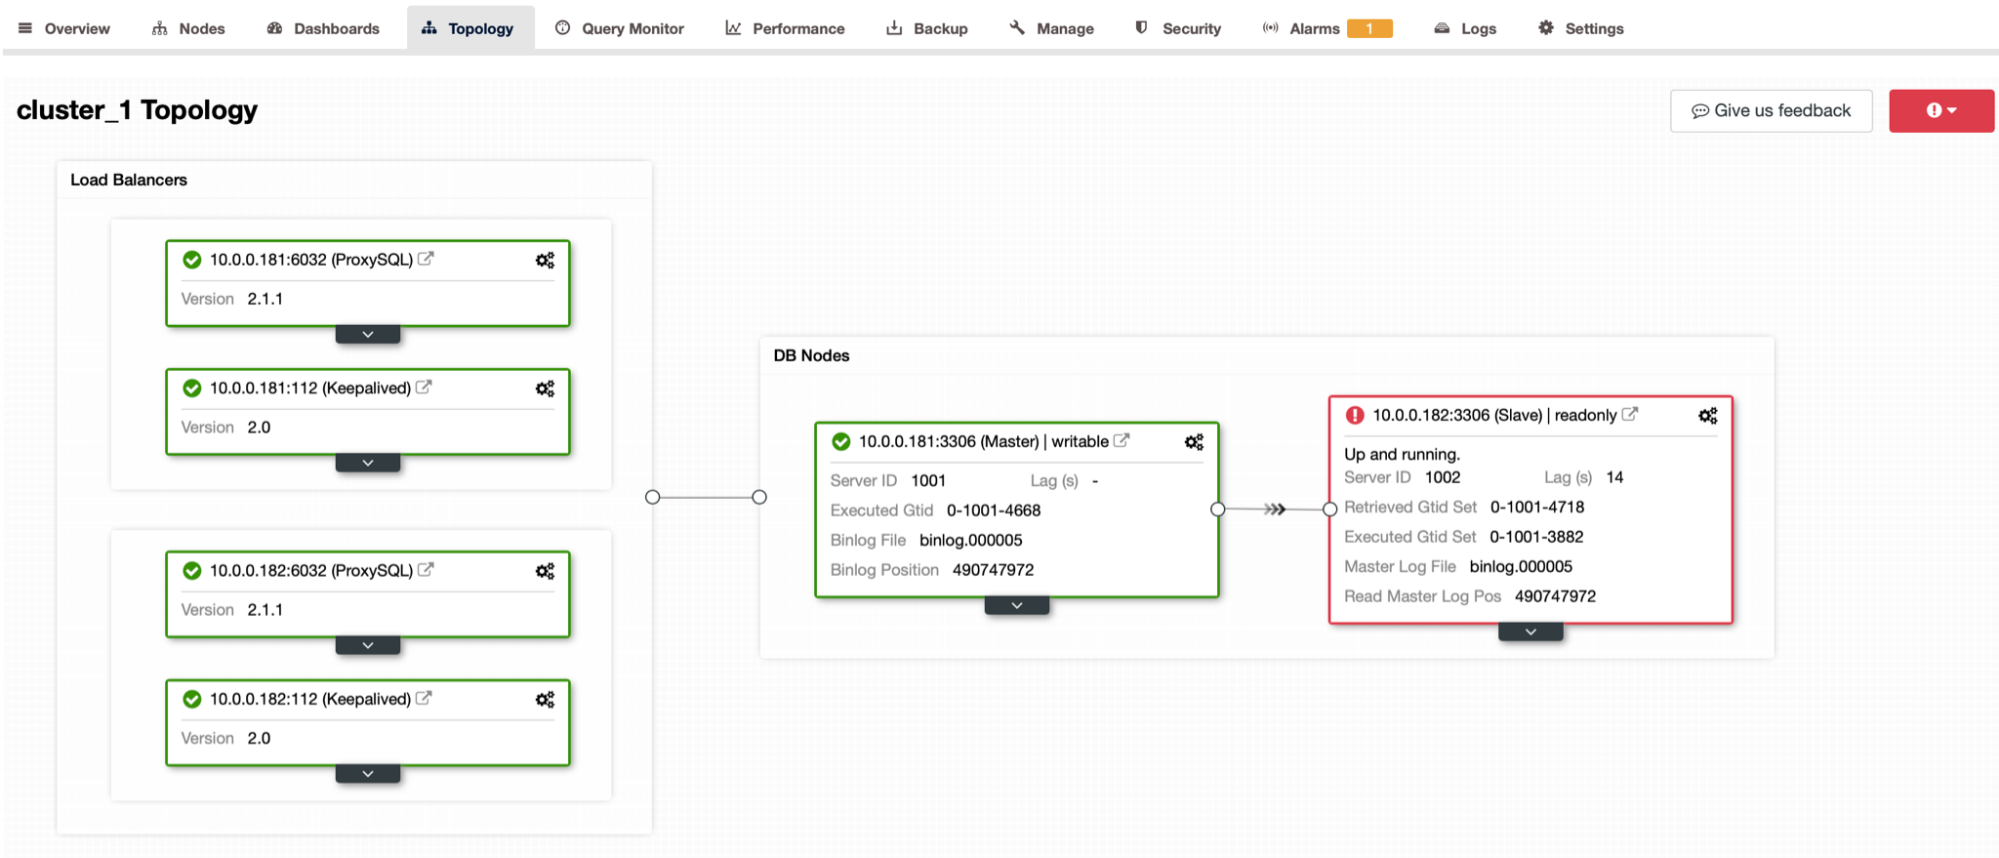
We have two ProxySQL nodes and two Keepalived nodes, providing Virtual IP and making sure that the ProxySQL is reachable. We are populating the cluster (thus the lag) with data generated by sysbench. We have used following command to trigger this process:

sysbench /root/sysbench/src/lua/oltp_read_write.lua --threads=4 --mysql-host=10.0.0.111 --mysql-user=sbtest --mysql-password=sbtest --mysql-port=6033 --tables=32 --table-size=1000000 prepare

This will generate around 7.6GB of data that we are going to test different backup settings on.

Compression settings

As we mentioned, there are quite a few settings that you can use to tweak MariaBackup and other tools involved in the backup process.

In this blog post we would like to focus on the compression level and see if it has any kind of real impact on our backup process. Does it change the length of the backup run?  Does it change the size of the backup? How? Does it make any point in actually using anything else than the default setting? Let’s take a look at it shortly.

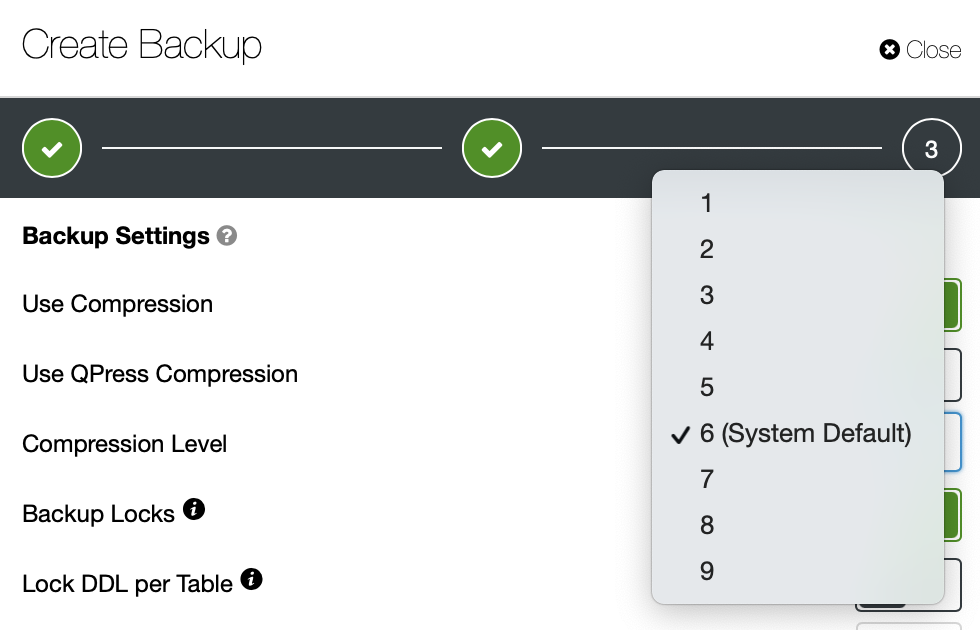
We are going to run backups using all the settings from the Compression level dropdown:

Backups will be stored on the node, locally, to minimize the impact caused by the network. We are going to use full MariaBackup. Data in the database is not encrypted or compressed in any way.

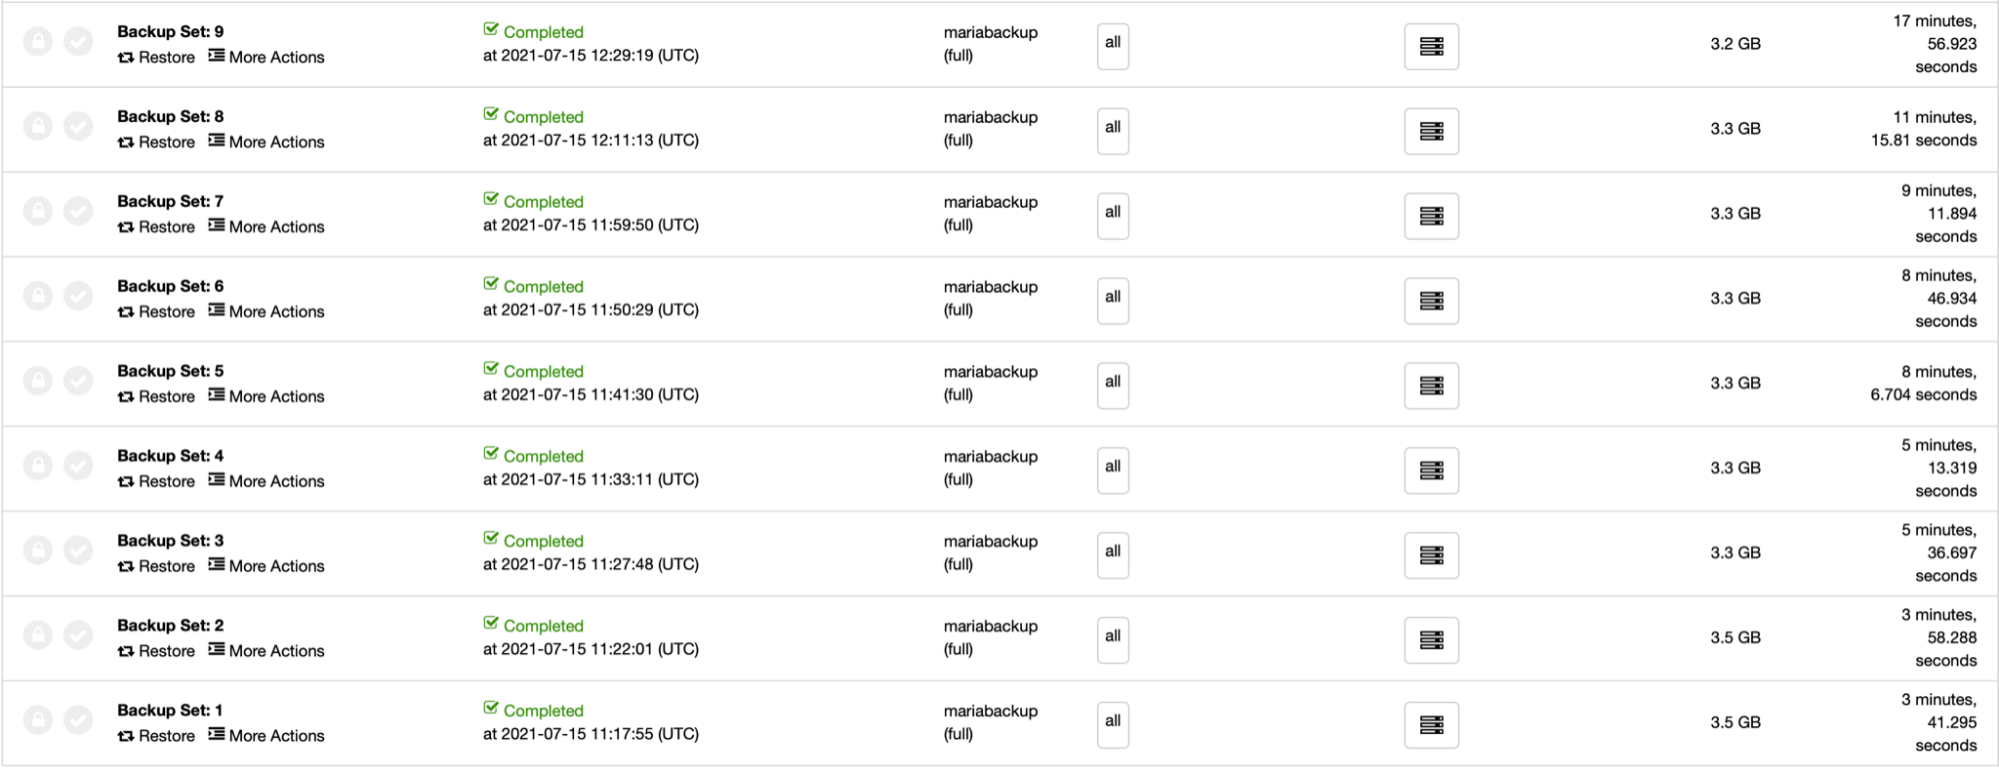
We will start 9 backup jobs, each with a different setting of the compression level. This setting is passed to gzip that is used, by default, to compress the data. What we expect to see is an increase of the backup execution time and reduction of the backup size when we’ll increase this setting.

As you can see, with an exception of backup 4, which we can just count out as a transient fluctuation, the backup execution time increases starting from 3 minutes and 41 seconds up to 17 minutes and 57 seconds. The backup size decreases from 3.5GB to 3.3GB. We can also check the exact size of the backup:

du -s /root/backups/*
3653288 /root/backups/BACKUP-1
3643088 /root/backups/BACKUP-2
3510420 /root/backups/BACKUP-3
3486304 /root/backups/BACKUP-4
3449392 /root/backups/BACKUP-5
3437504 /root/backups/BACKUP-6
3429152 /root/backups/BACKUP-7
3425492 /root/backups/BACKUP-8
3405348 /root/backups/BACKUP-9

This confirms that the backup size, in fact, decreases with every compression level but the differences are quite small between the first and the last level we tested. Smallest backup has 93.2% of the size of the largest one. On the other hand, its execution time (1077 seconds) is almost 5 times longer than the execution time of the largest backup (221 seconds).

Please keep in mind that your mileage will vary. You may use data that compress better, making the impact of the compression level more significant. Based on the outcome of this test, for sysbench dataset it hardly makes sense to use a compression level higher than 3.

Qpress compression

Another option we would like to test today is the Qpress compression. Qpress is a compression method that can be used to replace gzip.

As you can see, it is definitely faster than gzip but it comes with a significant increase in the size of the data. After 100 seconds of compression, we got 4.6GB of data. 

Picking the most suitable compression method may require a series of tests but, as we hope you can see, it definitely makes a point to do that. For large data sets being able to trade a somewhat larger archive for an almost 5 times faster backup process may be quite handy. If we consider using Qpress, we can trade disk space even for a 10 times faster backup process. This may mean a difference between 20 hours backup and 2 hours backup. Sure, the increase of the disk space needed for storing such data will be visible but then, when you think about it, getting a larger disk volume is doable. Adding additional hours to the day, when 24 hours are not enough to get the backup done, is not.

We hope this short blog was insightful for you and it will encourage you to play with and tweak different settings that can be used for MariaBackup. If you would like to share your experience with them, we’d love to see your comments.

ClusterControl runtime configuration options

$
0
0

When you install ClusterControl, it has a default configuration that maybe doesn’t fit your requirements so probably you will need to customize this installation. For this, you can modify the configuration files, but you can also check or modify the runtime ClusterControl settings. In this blog, we will show you where you can see this configuration and what are the available options to use here.

Where can you see the ClusterControl Runtime Configuration?

There are two different ways to check this. First, you can go to ClusterControl -> Global Settings -> Runtime Configurations, then choose your Cluster.

Another way is ClusterControl -> Select Cluster -> Settings -> Runtime Configurations.

In both cases, you will go to the same place, the Runtime Configuration section.

Runtime Configuration Parameters

Now, let’s see these parameters one by one. Keep in mind that these parameters depend on the database technology that you are using, so most probably you won’t see all of them at the same time in the same cluster.

Backup

Name

Default Value

Description

disable_backup_email

false

This setting controls if emails are sent or not if a backup is finished or failed.

backup_user

backupuser

The username of the database account used for managing backups.

backup_create_hash

true

Configures ClusterControl if it has to calculate md5hash on the created backup files and verify them.

pitr_retention_hours

0

Retention hours (to erase old WAL archive logs) for PITR.

netcat_port

9999,9990-9998

List of Netcat ports and port ranges used to stream backups. Defaults to '9999,9990-9998' and port 9999 will be preferred if available.

backupdir

/home/user/backups

The default backup directory, to be pre-filled in Frontend.

backup_subdir

BACKUP-%I

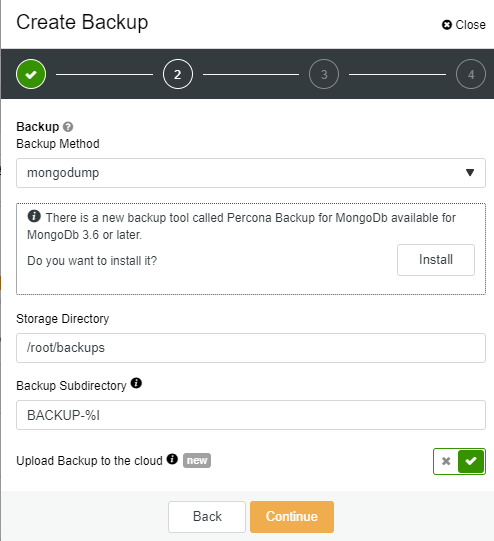
Set the name of the backup subdirectory. This string may hold standard "%X" field separators, the "%06I" for example will be replaced by the numerical ID of the backup in 6 field-wide format that uses '0' as leading fill characters. Here is the list of fields the backend currently supports: - B The date and time when the backup creation was beginning. - H The name of the backup host, the host that created the backup. - i The numerical ID of the cluster. - I The numerical ID of the backup. - J The numerical ID of the job that created the backup. - M The backup method (e.g. "mysqldump"). - O The name of the user who initiated the backup job. - S The name of the storage host, the host that stores the backup files. - % The percent sign itself. Use two percent signs, "%%" the same way the standard printf() function interprets it as one percent sign.

backup_retention

31

The setting of how many days to keep the backups. Backups matching retention period are removed.

backup_cloud_retention

180

The setting of how many days to keep the backups uploaded to a cloud. Backups matching retention period are removed.

backup_n_safety_copies

1

The setting of how many completed full backups will be kept regardless of their retention status.


Cluster

Name

Default Value

Description

cluster_name


The name of the cluster for easy identification.

enable_node_autorecovery

true

Node auto-recovery setting.

enable_cluster_autorecovery

true

If true, ClusterControl will perform cluster auto-recovery, if false no cluster recovery will be done automatically.

configdir

/etc/

The database server config directory.

created_by_job


The ID of the job created this cluster.

ssh_keypath

/home/user/.ssh/id_rsa

The SSH key file used for connection to nodes.

server_selection_try_once

true

MongoDB connection URI option. Defines if server selection should be repeated on failure until a server selection timeout expires, or just return with failure at once.

server_selection_timeout_ms

30000

MongoDB connection URI option. Defines the timeout value till mongodriver should try to do a successful server selection operation.

owner


The ClusterControl user ID of the owner of the cluster object.

group_owner


The ClusterControl group ID of the group that owns the cluster object.

cdt_path


The location of the cluster object in the ClusterControl Directory Tree.

tags

/

A set of strings the user can specify.

acl


The Access Control List as a string controlling the access to the cluster object.

mongodb_user

admindb

The MongoDB username.

mongodb_basedir

/usr/

The basedir for MongoDB installation.

mysql_basedir

/usr/

The basedir for MySQL installation.

scriptdir

/usr/bin/

The scripts dir of MySQL installation.

staging_dir

/home/user/s9s_tmp

A staging path for temporary files.

bindir

/usr/bin

The /bin directory of the MySQL installation.

monitored_mysql_port

3306

The monitored MySQL server's port number.

ndb_connectstring

127.0.0.1:1186

The NDB connect string setting for MySQL Cluster.

ndbd_datadir


The datadir of the NDBD nodes.

mgmd_datadir


The datadir of the NDB MGMD nodes.

os_user


The SSH username used for accessing nodes.

repl_user

cmon_replication

The replication username.

vendor


The database vendor name used for deployments.

galera_version


The used Galera version number.

server_version


The used database server version for deployments.

postgresql_user

admindb

The PostgreSQL user name.

galera_port

4567

The galera port to be used when adding nodes/garbd, and constructing wsrep_cluster_address. Do not change at runtime.

auto_manage_readonly

true

Allow ClusterControl to manage the read-only flag of the managed MySQL servers.

node_recovery_lock_file


Specify a lock file and if present on a node, the node will not recover. It is the responsibility of the administrator to create/remove the file.


Cmondb

Name

Default Value

Description

cmon_db

cmon

The local ClusterControl database name.

cmondb_hostname

127.0.0.1

The local ClusterControl database MySQL server hostname.

mysql_port

3306

The local ClusterControl database MySQL server port.

cmon_user

cmon

The account name for accessing the local ClusterControl database.


Controller

Name

Default Value

Description

controller_id

5a3a993d-xxxx

An arbitrary identifier string of this controller instance.

cmon_hostname

192.168.xx.xx

The controller hostname.

error_report_dir

/home/user/s9s_tmp

Storage location of error reports.


Long_query

Name

Default Value

Description

long_query_time

0.5

Threshold value for slow query checking.

query_monitor_alert_long_running_query

true

Raises an alarm if a query is executed for longer than query_monitor_long_running_query_ms.

query_monitor_kill_long_running_query

false

Kill the query if the query executed for longer than query_monitor_long_running_query_ms.

query_monitor_long_running_query_time_ms

30000

Raises an alarm if a query is executed for longer than query_monitor_long_running_query_ms. The minimum value is 1000.

query_monitor_long_running_query_matching_info


Match only queries with an 'Info' only matching this POSIX regex. No default value, match any Info.

query_monitor_long_running_query_matching_info_negate

false

Negate the result of query_monitor_long_running_query_matching_info.

query_monitor_long_running_query_matching_host


Match only queries with a 'Host' only matching this POSIX regex. No default value, matches any Host.

query_monitor_long_running_query_matching_db


Match only queries with a 'Db' only matching this POSIX regex. No default value, matches any Db.

query_monitor_long_running_query_matching_user


Match only queries with a 'User' only matching this POSIX regex. No default value, matches any User.

query_monitor_long_running_query_matching_user_negate

false

Negate the result of query_monitor_long_running_query_matching_user.

query_monitor_long_running_query_matching_command

Query

Match only queries with a 'Command' only matching this POSIX regex. Defaults to 'Query'.


Replication

Name

Default Value

Description

max_replication_lag

10

Max allowed replication lag in seconds before sending an Alarm.

replication_stop_on_error

true

Controls if the failover/switchover procedures should fail if errors are encountered that may cause data loss.

replication_auto_rebuild_slave

false

If the SQL THREAD is stopped and the error code is non-zero then the slave will be automatically rebuilt.

replication_failover_blacklist


Comma-separated list of hostname: port pairs. Blacklisted servers will not be considered as a candidate during failover. replication_failover_blacklist is ignored if replication_failover_whitelist is set.

replication_failover_whitelist


Comma-separated list of hostname: port pairs. Only whitelisted servers will be considered as a candidate during failover. If no server on the whitelist is available (up/connected) the failover will fail. replication_failover_blacklist is ignored if replication_failover_whitelist is set.

replication_onfail_failover_script


This script is executed as soon as it has been discovered that failover is needed. If the script returns non-zero or does not exist, the failover will be aborted. Four arguments are supplied to the script and set if they are known, else empty: arg1='all servers' arg2='failed master' arg3='selected candidate', arg4='slaves of oldmaster (the candidates)' and passed like this: 'scripname arg1 arg2 arg3 arg4' The script must be accessible on the controller and executable.

replication_pre_failover_script


This script is executed before the failover happens, but after a candidate has been elected and it is possible to continue the failover process. If the script returns non-zero or does not exist, the failover will be aborted. Four arguments are supplied to the script and set if they are known, else empty: arg1='all servers' arg2='failed master' arg3='selected candidate', arg4='slaves of oldmaster (the candidates)' and passed like this: 'scripname arg1 arg2 arg3 arg4' The script must be accessible on the controller and executable.

replication_post_failover_script


This script is executed after the failover happens ( a new master is elected and up and running). If the script returns non-zero or does not exist, the failover will be aborted. Four arguments are supplied to the script and set if they are known, else empty.: arg1='all servers' arg2='failed master' arg3='selected candidate', arg4='slaves of oldmaster (the candidates)' and passed like this: 'scripname arg1 arg2 arg3 arg4' The script must be accessible on the controller and executable.

replication_post_unsuccessful_failover_script


This script is executed if the failover attempt fails. If the script returns non-zero or does not exist, the failover will be aborted. Four arguments are supplied to the script and set if they are known, else empty.: arg1='all servers' arg2='failed master' arg3='selected candidate', arg4='slaves of oldmaster (the candidates)' and passed like this: 'scripname arg1 arg2 arg3 arg4' The script must be accessible on the controller and executable.


Retention

Name

Default Value

Description

ops_report_retention

31

The setting of how many days to keep operational reports. Reports matching retention period are removed.


Sampling

Name

Default Value

Description

enable_icmp_ping

true

Toggles if ClusterControl shall measure the ICMP ping times to the host.

host_stats_collection_interval

30

Setting for the host (CPU, memory, etc) collection interval.

host_stats_window_size

180

Setting the window size (in seconds) to examine stats to raise/clear host stats alarms.

db_stats_collection_interval

30

Setting for database stats collection interval.

db_proc_stats_collection_interval

5

Setting for database process stats collection interval. Min allowed value is 1 second. Requires a cmon service restart.

lb_stats_collection_interval

15

Setting for load balancer stats collection interval.

db_schema_stats_collection_interval

108000

Setting for schema stats monitoring interval.

db_deadlock_check_interval

0

How often to check for deadlocks. Specified in seconds. Deadlock detection will affect CPU usage on database nodes.

log_collection_interval

600

Controls the interval between logfile collections.

db_hourly_stats_collection_interval

5

Controls how many seconds are between every individual sample in the hourly range statistics.

monitored_mountpoints


The list of mount points to be monitored.

monitor_cpu_temperature

false

Monitor CPU temperature.

log_queries_not_using_indexes

false

Set the query monitor to detect queries not using indexes.

query_sample_interval

1

Controls the query monitor interval in seconds, -1 means no query monitoring.

query_monitor_auto_purge_ps

false

If enabled, the P_S table events_statements_summary_by_digest will be auto-purged (TRUNCATE TABLE) every hour.

schema_change_detection_address


Checks will be executed (using SHOW TABLES/SHOW CREATE TABLE) to determine if the schema has changed. The checks are executed on the address specified and are of the format HOSTNAME:PORT. The schema_change_detection_databases must also be set. A diff of a changed table is created.

schema_change_detection_databases


Comma separated list of databases to monitor for schema changes. If empty, no checks are made.

schema_change_detection_pause_time_ms

0

Pause time in ms between each SHOW CREATE TABLE. The pause time will affect the duration of the detection process.

enable_is_queries

true

Specifies whether queries to the information_schema will be executed or not. Queries to the information_schema may not be suitable when having many schema objects (100s of databases, 100s of tables in each database, triggers, users, events, sprocs). If disabled, the query that would be executed will be logged so it can be determined if the query is suitable in your environment.


Swapping

Name

Default Value

Description

swap_warning

20

Warning alarm threshold for swap usage.

swap_critical

90

Critical alarm threshold for swap usage.

swap_inout_period

0

The interval for swap I/O alarms (<= 0 disables).

swap_inout_warning

10240

The number of pages swapped I/O in the specified interval (swap_inout_period, by default 10 minutes) for warning.

swap_inout_critical

102400

The number of pages swapped I/O in the specified interval (swap_inout_period, by default 10 minutes) for critical.


System

Name

Default Value

Description

cmon_config_path

/etc/cmon.d/cmon_x.cnf

The config file path. This configuration value is read-only.

os

debian/redhat

The OS type. Possible values are 'debian' or 'redhat'.

libssh_timeout

30

The network timeout value for SSH connections.

sudo

sudo -n 2>/dev/null

The command used to obtain superuser privileges.

ssh_port

22

The port for SSH connections to the nodes.

local_repo_name


The used local repository names for cluster deployment.

frontend_url


The URL sent in the emails to direct the recipient to the ClusterControl web interface.

purge

7

How long ClusterControl shall keep data. Measured in days, jobs, job messages, alarms, collected logs, operational reports, database growth information older than this will be deleted.

os_user_home

/home/user

The HOME directory of the user used on nodes.

cmon_mail_sender


The used email sender for sent emails.

plugin_dir


The path of the plugins directory.

use_internal_repos

false

Setting which disabled the 3rd party repository to be set up.

cmon_use_mail

false

Setting to use the 'mail' command for e-mailing.

enable_html_emails

true

Enables sending of HTML emails.

send_clear_alarm

true

Toggles the email sending in case of cluster alarms being cleared.

software_packagedir


This is the storage location of software packages, i.e, all necessary files to successfully install a node, if there is no yum/apt repository available, must be placed here. Applies mainly to MySQL Cluster or older Codership/Galera installations.

Threshold

Name

Default Value

Description

ram_warning

80

Warning alarm threshold for RAM usage.

ram_critical

90

Critical alarm threshold for RAM usage.

diskspace_warning

80

Warning alarm threshold for disk usage.

diskspace_critical

90

Critical alarm threshold for disk usage.

cpu_warning

80

Warning alarm threshold for CPU usage.

cpu_critical

90

Critical alarm threshold for CPU usage.

cpu_steal_warning

10

Warning alarm threshold for CPU steal.

cpu_steal_critical

20

Critical alarm threshold for CPU steal.

cpu_iowait_warning

50

Warning alarm threshold for CPU IO Wait.

cpu_iowait_critical

60

Critical alarm threshold for CPU IO Wait.

slow_ssh_warning

6

A Warning alarm will be raised if it takes longer than the specified time to set up an SSH connection (secs).

slow_ssh_critical

12

A Critical alarm will be raised if it takes longer than the specified time to set up an SSH connection (secs).

Conclusion

As you can see, there are many parameters to change if you need to adapt ClusterControl to your workload or business. It could be a time-consuming task to review all the values and change them accordingly, but at the end of the day, it will save time as you can make the most out of all the ClusterControl features.

ClusterControl - Advanced Backup Management - mariabackup Part II

$
0
0

In the previous part we have tested backup time and effectiveness of the compression for different backup compression levels and methods. In this blog we will continue our efforts and we will talk about more settings that, probably, most of the users do not really change yet they may have a visible effect on the backup process.

The setup is the same as in the previous part: we will use MariaDB master-slave replication cluster with ProxySQL and Keepalived.

We have generated 7.6GB of data using sysbench:

sysbench /root/sysbench/src/lua/oltp_read_write.lua --threads=4 --mysql-host=10.0.0.111 --mysql-user=sbtest --mysql-password=sbtest --mysql-port=6033 --tables=32 --table-size=1000000 prepare

Using PIGZ

This time we are going to enable Use PIGZ for parallel gzip for our backups. As before, we will test every compression level to see how it performs.

We are storing the backup locally on the instance, the instance is configured with 4 vCPUs.

The outcome is sort of expected. The backup process was significantly faster than when we used just a single CPU core. The size of the backup remains pretty much the same, there is no real reason for it to change significantly. It is clear that using pigz improves the backup time. There is a dark side of using parallel gzip though, and it is CPU utilization:

As you can see, the CPU utilization skyrockets and it reaches almost 100% for higher compression levels. Increasing CPU utilization on the database server is not necessarily the best idea as, typically, we want CPU to be available for the database. On the other hand, if we happen to have a replica that is dedicated to taking backups and, let’s say, heavier queries - a node that is not used for serving an OLTP type of traffic, we can enable parallel gzip to greatly reduce the backup time. As can be clearly seen, it is not an option for everyone but it is definitely something that you can find useful in some particular scenarios. Just keep in mind that CPU utilization is something you need to track as it will impact the latency of the queries and, as through it, it will impact the user experience - something we always should consider when working with the databases.

Xtrabackup Parallel Copy Threads

Another setting we want to highlight is Xtrabackup Parallel Copy Threads. To understand what it is, let’s talk a bit about the way Xtrabackup (or MariaBackup) works. In short, those tools perform two actions at the same time. They copy the data, physical files, from the database server to the backup location while monitoring the InnoDB redo logs for any updates. The backup consists of the files and the record of all changes to InnoDB that happened during the backup process. This, with backup locks or FLUSH TABLES WITH READ LOCK, allows to create backup that is consistent at the point of time when the data transfer has been finished. Xtrabackup Parallel Copy Threads define the number of threads that will perform the data transfer. If we set it to 1, one file will be copied at the same time. If we’ll set it to 8, theoretically up to 8 files can be transferred at once. Of course, there has to be fast enough storage to actually benefit from such a setting. We are going to perform several tests, changing Xtrabackup Parallel Copy Threads from 1 through 2 and 4 to 8. We will run tests on compression level of 6 (default one) with and without parallel gzip enabled.

First four backups (27 - 30) have been created without parallel gzip, starting from 1 through 2, 4 and 8 parallel copy threads. Then we repeated the same process for backups 31 to 34, this time using parallel gzip. As you can see, in our case there is hardly a difference between the parallel copy threads. This will most likely be more impactful if we would increase the size of the data set. It also would improve the backup performance if we would use faster, more reliable storage. As usual, your mileage will vary and in different environments this setting may affect the backup process more than what we see here.

Network throttling

Finally, in this part of our short series we would like to talk about the ability to throttle the network usage.

As you may have seen, backups can be stored locally on the node or it can also be streamed to the controller host. This happens over the network and, by default, it will be done “as fast as possible”.

In some cases, where your network throughput is limited (cloud instances, for example), you may want to reduce the network usage caused by the MariaBackup by setting a limit on the network transfer. When you do that, ClusterControl will use ‘pv’ tool to limit the bandwidth available for the process.

As you can see, the first backup took around 3 minutes but when we throttled the network throughput, backup took 13 minutes and 37 seconds.

In both cases we used pigz and the compression level 1. The graph above shows that throttling the network also reduced the CPU utilization. It makes sense, if pigz has to wait for the network to transfer the data, it doesn’t have to push hard on the CPU as it has to idle most of the time.

Hopefully you found this short blog interesting and maybe it will encourage you to experiment with some of the not-so-commonly-used features and options of MariaBackup. If you would like to share some of your experience, we would like to hear from you in the comments below.


ACL using s9s CLI

$
0
0

Starting with ClusterControl 1.8.2, we have introduced new user management, permissions as well as access controls. From this version onwards, all of the features we mentioned earlier will be controlled by a set of Access Control List (ACL) text forms called read (r), write (w), and execute (x). ACL is not a new thing to most system administrators in configuring permission for users and groups, in fact, this is one of the common ways in allowing certain privileges.

In ClusterControl 1.8.1 and earlier, role-based access control (RBAC) is used. The roles need to be created and assigned a set of permissions to access certain features or pages. While the role enforcement happens on the front-end, the ClusterControl controller service (cmon) does not really know whether the active user has the privilege to access the functionality since the information is not shared between the two authentication engines. Over time, this method would make both authentication and authorization hard to control especially for the features compatible with both GUI and CLI interfaces.

In this blog post, we will review how to enable ACL using s9s CLI especially for the use case that requires some external ClusterControl access. We also will briefly review how to manage the access from the GUI.

Access Control in ClusterControl UI

There are 2 ways that can be applied to configure the permission in ClusterControl either by using GUI or the CLI. With ClusterControl GUI, the steps are less complicated and easy to follow as opposed to the CLI. All cluster is owned by a team, the team can be configured either to have admin, denied the access or read access only, all of these are similar to the earlier ClusterControl version. From your ClusterControl 1.8.2 UI, this option is available on the left sidebar like in the screenshot below:

As you may notice, there are 4 options that you could manage the permissions as listed below:

  • Clusters

  • Cluster Deployment

  • LDAP Configuration

  • Controller Configuration

If you click on each of the tabs, the information will be displayed in the textbox on the right-hand side. For example, for “Cluster Access Control” the following information is displayed:

Read - Can view this cluster and its properties such as jobs, backups, charts, metrics, and settings of the cluster

Admin - Can view this cluster and its properties such as jobs, backups, charts, metrics, and settings of the cluster. Can also change settings of the cluster, and manage (clone, create, delete, abort ) jobs on the specific cluster. Is not allowed to Create or Delete a cluster

No Access - Access denied

On this page also, you can add/remove any team or group that you would like to assign permission to by clicking on the “Add Team” button. From the previous screenshot also, you may notice “readergroup” has been assigned with “read” access for the “Cluster Access Control”.

To add a user to the team, you may do so from the “Team and Users” page. Simply click on the “Create User” button and fill in all the required information as per the example below:

If any of the members from “readergroup” access the ClusterControl UI, they will see a different interface compare to the user from with the “admin” access. The following screenshot is what they will see:

They will not see some of the options and if they try to change any of the settings the following popup will appear:

That is a brief example of how to use Access Control and manage the permission using the GUI. The detailed step on how to use the new user management can be found in our documentation here.

ACL Using s9s CLI

In this section, we will go through a few examples of the common permissions setting that are being used and configure them using the “s9s” CLI. For the first example, we will configure a dedicated read-only user that will be connected from his client and integrate with the ClusterControl platform via the RPC interface. For this purpose, the requirements would be like in the list below:

  • A client/host that will act as the ClusterControl monitor server

  • ClusterControl node, 10.10.80.10

  • MySQL Replication setup - you could use your own setup

  • PostgreSQL 13 - you could use your own setup

Creating a Read-only User

Assuming all of our requirements are ready, let’s go ahead with the steps. Take note that this needs to be done in the ClusterControl node:

  1. Add the following line inside /etc/default/cmon. Take note of the IP address, it should be the same as your ClusterControl node IP:

RPC_BIND_ADDRESSES="10.10.80.10,127.0.0.1"
  1. Restart CMON service to make sure ClusterControl listens on port 9501 for both IP addresses defined above:

$ systemctl restart cmon
  1. Create a read-only user called “readeruser” (you could choose any name):

$ s9s user --create --group=readergroup --create-group --generate-key --new-password=s3cr3tP455 --email-address=reader@somewhere.com --first-name=Reader --last-name=User --batch readeruser


*A new private and public key will be created under ~/.s9s directory called readeruser.key and readeruser.pub.

  1. Run the following command to confirm the user is created:

$ s9s user --list --long
A ID UNAME      GROUPS      EMAIL                 REALNAME
-  1 system     admins      -                     System User
-  2 nobody     nobody      -                     Default User
-  3 admin      admins      -                     Default User
-  4 ccrpc      admins      -                     RPC API
-  5 ccadmin    admins      me@example.com        Zamani
A  9 dba        admins      -                     -
- 11 worf       users       worfdoe@somewhere.com Worf Doe
- 15 readeruser readergroup reader@somewhere.com  Reader User
Total: 8
  1. Get the Cmon Directory Tree (CDT) value for your cluster (imagine this as ls -al in UNIX). In this example, our cluster name is “MySQL Replication”, as shown below:

$ s9s tree --list --long
MODE        SIZE OWNER      GROUP  NAME
crwxrwxr--+    - ccadmin    admins MySQL Replication
srwxrwxrwx     - system     admins localhost
drwxrwxr--  1, 0 system     admins groups
urwxr--r--     - admin      admins admin
urwxr--r--     - ccadmin    admins ccadmin
urwxr--r--     - ccrpc      admins ccrpc
urwxr--r--     - dba        admins dba
urwxr--r--     - nobody     admins nobody
urwxr--r--     - readeruser admins readeruser
urwxr--r--     - system     admins system
urwxr--r--     - worf       admins worf
  1. Assign read permission for “readeruser” and “readergroup” for the cluster that you want. Our CDT path is “/MySQL Replication” (take note to always start with a “/”, similar to UNIX):

$ s9s tree --add-acl --acl="group:readergroup:r--""/MySQL Replication"
Acl is added.
$ s9s tree --add-acl --acl="user:readeruser:r--""/MySQL Replication"
Acl is added.

The configuration is complete for the ClusterControl node part. Next, we need to configure the s9s client in the reader’s workstation/host.

Client Configuration 

All the commands that we are going to execute should be done on the reader’s workstation. You could have as many readers as you want. The steps would be the same for all workstations (client).

  1. Install s9s CLI. Detailed instructions can be found here.

$ wget http://repo.severalnines.com/s9s-tools/install-s9s-tools.sh
$ chmod 755 install-s9s-tools.sh
$ ./install-s9s-tools.sh
  1. Make sure .s9s directory is created. If it’s not, proceed to create the directory and copy the readeruser.key and readeruser.pub from the ClusterControl server into it:

$ mkdir ~/.s9s
$ cd ~/.s9s
$ scp root@10.10.80.10:~/.s9s/readeruser.key .
$ scp root@10.10.80.10:~/.s9s/readeruser.pub .
  1. Edit the s9s configuration file at ~/.s9s/s9s.conf:

[global]
cmon_user=readeruser
controller=https://10.10.80.10:9501

At this point, the configuration is complete on the client-side. You may test it by executing the following commands to list out the cluster’s objects (from the reader’s workstation):

$ s9s cluster --list --long
ID STATE   TYPE        OWNER   GROUP  NAME              COMMENT
 5 STARTED replication ccadmin admins MySQL Replication All nodes are operation…
Total: 1
$ s9s cluster --cluster-id=5 --stat

Creating a Read/Write User

In this example, we will review the steps to create the read/write user and add the ACL. These steps need to be performed in the ClusterControl node:

  1. Create a read/write user called “writeuser” (you could choose any name):

$ s9s user --create --group=writegroup --create-group --generate-key --new-password=s3cr3tP455 --email-address=readwrite@somewhere.com --first-name=Write --last-name=User --batch writeuser

*A new private and public key will be created under ~/.s9s directory called writeuser.key and writeuser.pub.

  1. Run the following command to confirm the user is created:

$ s9s user --list --long
A ID UNAME      GROUPS      EMAIL                   REALNAME
-  1 system     admins      -                       System User
-  2 nobody     nobody      -                       Default User
-  3 admin      admins      -                       Default User
-  4 ccrpc      admins      -                       RPC API
-  5 ccadmin    admins      me@example.com          Zamani
A  9 dba        admins      -                       -
- 11 worf       users       worfdoe@somewhere.com   Worf Doe
- 15 readeruser readergroup reader@somewhere.com    Reader User
- 16 writeuser  writegroup  readwrite@somewhere.com Write User
Total: 9
  1. Get the Cmon Directory Tree (CDT) value for your cluster. In this example, we will use “PostgreSQL 13”, as shown below:

$ s9s tree --list --long
MODE        SIZE OWNER      GROUP  NAME
crwxrwxr--+    - ccadmin    admins MySQL Replication
crwxrwx---     - ccadmin    admins PostgreSQL 13
srwxrwxrwx     - system     admins localhost
drwxrwxr--  1, 0 system     admins groups
urwxr--r--     - admin      admins admin
urwxr--r--     - ccadmin    admins ccadmin
urwxr--r--     - ccrpc      admins ccrpc
urwxr--r--     - dba        admins dba
urwxr--r--     - nobody     admins nobody
urwxr--r--     - readeruser admins readeruser
urwxr--r--     - system     admins system
urwxr--r--     - worf       admins worf
urwxr--r--     - writeuser  admins writeuser
  1. Assign read/write permission for “writeuser” and “writegroup” for the cluster that you want. Our CDT path is “/PostgreSQL 13” (take note to always start with a “/”, similar to UNIX):

$ s9s tree --add-acl --acl="group:writegroup:rw-""/PostgreSQL 13"
Acl is added.
$ s9s tree --add-acl --acl="user:writeuser:rw-""/PostgreSQL 13"  
Acl is added.


For the client configuration, make sure the private key, public key and ~/.s9s/s9s.conf updated accordingly. Once all of them are updated, you may test the access using the following command:

$ s9s user --whoami
writeuser
$ s9s tree --add-tag --tag="Production""/PostgreSQL 13"
Tag is added.

Adding Multiple Groups To A Cluster

If you have a situation where you want to add multiple groups for a particular cluster, you may achieve this by using the following command. Suppose you would like to add “writegroup” and “users” for cluster “MySQL Replication”:

$ s9s tree --add-acl --acl="group:writegroup:rw-""/MySQL Replication";s9s tree --add-acl --acl="group:users:rw-""/MySQL Replication"
Acl is added.
Acl is added.
You may verify the access using the following command:
$ s9s tree --get-acl "/MySQL Replication" |grep 'writegroup\|users'
group:users:rw-
group:writegroup:rw-

Allowing One Group For Multiple Clusters

In the event you would like to allow one group for multiple clusters, the following command could be executed. Suppose you would like to add “readergroup” for both “MySQL Replication” and “PostgreSQL 13” clusters:

$ s9s tree --add-acl --acl="group:readergroup:r--""/MySQL Replication";s9s tree --add-acl --acl="group:readergroup:r--""/PostgreSQL 13"
Acl is added.
Acl is added.
Verify again the access for the group by executing the following commands:
$ s9s tree --get-acl "/MySQL Replication";s9s tree --get-acl "/PostgreSQL 13"
# name: MySQL Replication
# owner: ccadmin
# group: admins
user::rwx
user:readeruser:r--
group::rwx
group:readergroup:r--
group:users:rw-
group:writegroup:rw-
other::r--
# name: PostgreSQL 13
# owner: ccadmin
# group: admins
user::rwx
group::rwx
group:readergroup:r--
other::---

Conclusion

ClusterControl 1.8.2 is using new user management, permissions as well as access controls. You could manage the permissions and customize them in both GUI and CLI. ACL is quite useful when you want to use an RPC call to call any object and class in ClusterControl. Should you like to learn more about our RPC, a detailed explanation of the operations can be found here.

Digging Deeper into ClusterControl’s Performance Advisors

$
0
0

If you are a frequent reader of the Severalnines’ database blog, you have probably noticed that Severalnines’ crew talks about performance of databases pretty frequently. Part of that is because of ClusterControl - the flagship Severalnines’ product - but another part of it is just because monitoring the performance of your open source databases is so important. In this blog post we will dig deeper into ClusterControl’s performance advisors and tell you what can ClusterControl do for you in this space in a little more detail.

Why Monitor Performance?

If you are a developer, you probably already know how important it is to keep an eye out on your database instances at all times - one step in the wrong direction and your databases will be in turmoil: improper monitoring of your database clusters can be the primary cause of downtime other issues for both you and your business. If you are a database administrator, monitoring the performance of your database instances is probably one of the key things you do every day - for you, it’s even more important.

How to Monitor Performance?

If you are a database administrator, you are probably already familiar with some of the ways that you can use to monitor your database performance. You can either accomplish everything manually if you so desire, or you can also use tools provided by your software vendors (you can use tools provided by MariaDB, MySQL, Percona, MongoDB, TimescaleDB and the like) - one of those tools is also developed by Severalnines - that’s ClusterControl.
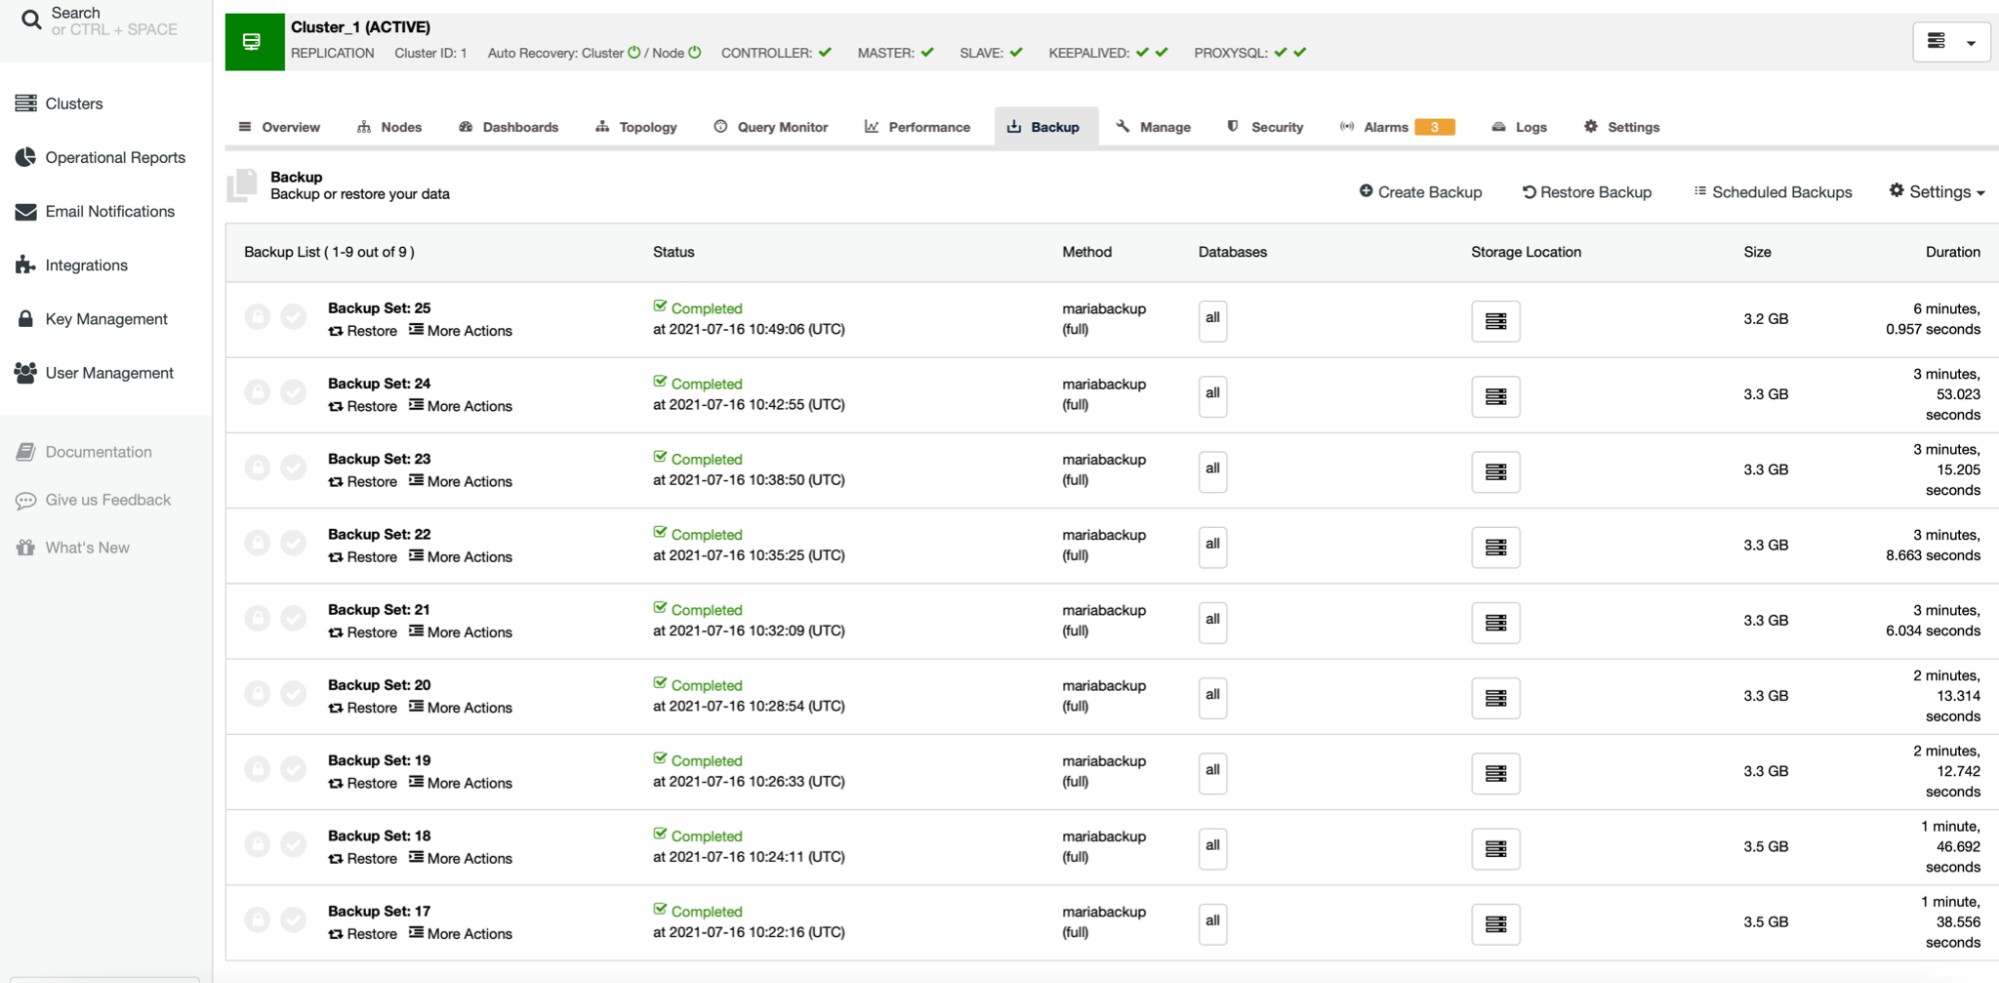
ClusterControl can be useful in a wide variety of scenarios: we can use the tool to get an overview of the things happening in our database clusters, we can observe the amount and layout of our database nodes, we can observe our database cluster topology, we can see the amount of long-running queries, database connections and query outliers, ClusterControl can help us back up our database instances - we can either create or schedule a backup. We can even manage our hosts, database configurations, deploy or import load balancers, manage our database users and schemas, manage scripts in our database instances, or you can use tags to allow for tagging and searching of clusters. Also, you can enable or disable SSL encryption, observe all of the alarms in your database cluster and be informed when some jobs run successfully or fail.

Why Keep an Eye on Performance Advisors?

We have explained what can ClusterControl do for your business above - however, if you have used ClusterControl extensively, chances are that you already know all of the things ClusterControl can do for your business and want to dig deeper into one of them. We will do that now.

Launch ClusterControl, log into the service, and you will be able to see a Performance tab at the top. Hover over it and you should see Advisors readily accessible to you - click on it:

Once you click on the link,

As you might see, performance advisors are divided into a few different categories: you can observe the performance of your MySQL instances, you can dive deeper into security, schema, replication, the performance schema, InnoDB, general advisors, advisors that let you observe connection information, host advisors as well. All of these advisors can either be enabled or disabled too.

For example, filter advisors by MySQL and you will be able to only see advisors relevant to MySQL:

MySQL, in this space, has a few areas that ClusterControl takes care of:

  • Performance schema advisors let you know whether it’s enabled or disabled.

  • The top queries advisor provides information about top slow or long-running queries.

In the replication space, we have three advisors:

  • ClusterControl provides us with information about the binary log storage location.

  • We are able to see when our binary logs expire.

  • ClusterControl is able to check the status of the report host setting - this setting reports some information to the source during replica registration.

If we scroll down, we are also able to see connection advisors, general advisors, InnoDB advisors, as well as schema and security advisors:


In this case, for example, ClusterControl is able to inform you:

  • Whether your InnoDB log file size is greater than the log produced per hour allowing you to see whether the InnoDB log file size is sized correctly.

  • An advisor below is able to check for tables with duplicate indexes (duplicate indexes might waste disk space and have an impact on performance too)

  • An advisor below is able to see whether your MySQL instances have any accounts allowed to connect from any host or user: doing so is a bad idea security-wise.

  • ClusterControl in this space also checks whether your database instances have any accounts that do not have a password set up: in this case, consider setting up a password for every account that you use together with your database instance - not doing so puts your business (and your database) at a tremendous risk - in that case, anyone who is able to access a login page for the management of your database instances (for example, anyone who is able to access phpMyAdmin) would be able to log in without needing a password.

In general, performance advisors provided by ClusterControl can save your database instances from all kinds of disasters ranging from monitoring whether the performance of your queries is up to par and you do not have any tables with duplicate indexes that might have an impact on performance to monitoring your CPU and disk space usage. With that being said, if you don’t seem to find the one performance advisor that might be the right fit for your database, you can also customize them and design one yourself - just click on the Edit icon on the right side of the performance advisor:

Once there, you will be able to see the available scripts in the so-called “Developer Studio” - new scripts can be created, imported or exported too. To modify a specific performance advisor, navigate to what you want to modify, then click on the file name:

Once you have chosen the file, you can compile your job, compile and run it, schedule it or disable it altogether. If you elect to modify it, though, make sure you know some javascript - you are going to need it!

If we dissect a performance advisor present in ClusterControl, we can see that performance advisors, in general, begin with a description of themselves and a warning threshold. Then we have a function that actually defines what the performance advisor is supposed to do: in this case, the performance advisor is able to check whether the size of the InnoDB buffer pool is small or not.

Some performance advisors are simple, others are more complex. For example, observe the query cache hitratio advisor and you will be able to see that that advisor calculates the ratio of query cache hits over the sum of query cache hits and inserts and also provides recommendations for developers and DBAs to configure the query cache size correctly. If everything is done correctly, the advisor will provide a benefit for users with read-intensive workloads.

Creating advisors is hard - for that you need both good javascript knowledge, some knowledge about ClusterControl and, on top of that, you need to be intimately familiar with the functionality of your database clusters, but once you practice and create your first performance advisor, moving forward with the rest will be a piece of cake!

Summary

Monitoring the performance of your database clusters isn’t the easiest of tasks. In order to do that, you must be intimately familiar with the functionality of your database instances, and know what you need to monitor in order to push your database performance to the max in the first place. However, fear not - ClusterControl’s performance advisors can steer you in the right direction. We hope that this blog post has opened your eyes into the ClusterControl performance advisor world and helped you understand what performance advisors do - if you are still not sure, though, give ClusterControl a try yourself and find out.

Upgrading to PostgreSQL13

$
0
0

In a recent blog about what is new in PostgreSQL 13, we reviewed some of the new features of this version, but now, let’s see how to upgrade to be able to take advantage of all these mentioned functionalities.

Upgrading to PostgreSQL 13

If you want to upgrade your current PostgreSQL version to this new one, you have three main native options to perform this task.

  • Pg_dump/pg_dumpall: It is a logical backup tool that allows you to dump your data and restore it in the new PostgreSQL version. Here you will have a downtime period that will vary according to your data size. You need to stop the system or avoid new data in the primary node, run the pg_dump, move the generated dump to the new database node, and restore it. During this time, you can’t write into your primary PostgreSQL database to avoid data inconsistency.

  • Pg_upgrade: It is a PostgreSQL tool to upgrade your PostgreSQL version in-place. It could be dangerous in a production environment and we don’t recommend this method in that case. Using this method you will have downtime too, but probably it will be considerably less than using the previous pg_dump method.

  • Logical Replication: Since PostgreSQL 10, you can use this replication method which allows you to perform major version upgrades with zero (or almost zero) downtime. In this way, you can add a standby node in the last PostgreSQL version, and when the replication is up-to-date, you can perform a failover process to promote the new PostgreSQL node. 

So, let’s see these methods one by one.

Using pg_dump/pg_dumpall

In case downtime is not a problem for you, this method is an easy way for upgrading.

To create the dump, you can run:

$ pg_dumpall > dump_pg12.out

Or to create a dump of a single database:

$ pg_dump world > dump_world_pg12.out

Then, you can copy this dump to the server with the new PostgreSQL version, and restore it:

$ psql -f dump_pg12.out postgres

Keep in mind that you will need to stop your application or avoid writing in your database during this process, otherwise, you will have data inconsistency or a potential data loss.

Using pg_upgrade

First, you will need to have both the new and the old PostgreSQL versions installed on the server.

$ rpm -qa |grep postgres
postgresql13-contrib-13.3-2PGDG.rhel8.x86_64
postgresql13-server-13.3-2PGDG.rhel8.x86_64
postgresql13-libs-13.3-2PGDG.rhel8.x86_64
postgresql13-13.3-2PGDG.rhel8.x86_64
postgresql12-libs-12.7-2PGDG.rhel8.x86_64
postgresql12-server-12.7-2PGDG.rhel8.x86_64
postgresql12-12.7-2PGDG.rhel8.x86_64
postgresql12-contrib-12.7-2PGDG.rhel8.x86_64

Then, first, you can run pg_upgrade for testing the upgrade by adding the -c flag:

$ /usr/pgsql-13/bin/pg_upgrade -b /usr/pgsql-12/bin -B /usr/pgsql-13/bin -d /var/lib/pgsql/12/data -D /var/lib/pgsql/13/data -c

Performing Consistency Checks on Old Live Server

------------------------------------------------
Checking cluster versions                                   ok
Checking database user is the install user                  ok
Checking database connection settings                       ok
Checking for prepared transactions                          ok
Checking for system-defined composite types in user tables  ok
Checking for reg* data types in user tables                 ok
Checking for contrib/isn with bigint-passing mismatch       ok
Checking for presence of required libraries                 ok
Checking database user is the install user                  ok
Checking for prepared transactions                          ok
Checking for new cluster tablespace directories             ok

*Clusters are compatible*

The flags mean:

  • -b: The old PostgreSQL executable directory

  • -B: The new PostgreSQL executable directory

  • -d: The old database cluster configuration directory

  • -D: The new database cluster configuration directory

  • -c: Check clusters only. It doesn’t change any data

If everything looks fine, you can run the same command without the -c flag and it will upgrade your PostgreSQL server. For this, you need to stop your current version first and run the mentioned command.

$ systemctl stop postgresql-12
$ /usr/pgsql-13/bin/pg_upgrade -b /usr/pgsql-12/bin -B /usr/pgsql-13/bin -d /var/lib/pgsql/12/data -D /var/lib/pgsql/13/data
...

Upgrade Complete

----------------

Optimizer statistics are not transferred by pg_upgrade so, once you start the new server, consider running:

    ./analyze_new_cluster.sh

Running this script will delete the old cluster's data files:

    ./delete_old_cluster.sh

When it is completed, as the message suggests, you can use those scripts for analyzing the new PostgreSQL server and deleting the old one when it is safe.

Using Logical Replication

Logical replication is a method of replicating data objects and their changes, based upon their replication identity. It is based on a publish and subscribe mode, where one or more subscribers subscribe to one or more publications on a publisher node.

So based on this, let’s configure the publisher,in this case the PostgreSQL 12 server, as follows.

Edit the postgresql.conf configuration file:

listen_addresses = '*'
wal_level = logical
max_wal_senders = 8
max_replication_slots = 4

Edit the pg_hba.conf configuration file:

# TYPE  DATABASE        USER            ADDRESS                 METHOD
host     all     rep1     10.10.10.141/32     md5

Use the subscriber IP address there.

Now, you must configure the subscriber, in this case the PostgreSQL 13 server, as follows.

Edit the postgresql.conf configuration file:

listen_addresses = '*'
max_replication_slots = 4
max_logical_replication_workers = 4
max_worker_processes = 8

As this PostgreSQL 13 will be the new primary node soon, you should consider adding the wal_level and archive_mode parameters in this step, to avoid a new restart of the service later.

wal_level = logical
archive_mode = on

These parameters will be useful if you want to add a new replica or for using PITR backups. 

Some of these changes require a server restart, so restart both publisher and subscriber.

Now, in the publisher, you must create the user to be used by the subscriber to access it. The role used for the replication connection must have the REPLICATION attribute and, in order to be able to copy the initial data, it also need the SELECT privilege on the published table:

world=# CREATE ROLE rep1 WITH LOGIN PASSWORD '********' REPLICATION;
CREATE ROLE
world=# GRANT SELECT ON ALL TABLES IN SCHEMA public to rep1;
GRANT

Let’s create the pub1 publication in the publisher node, for all the tables:

world=# CREATE PUBLICATION pub1 FOR ALL TABLES;
CREATE PUBLICATION

As the schema is not replicated, you must take a backup in your PostgreSQL 12 and restore it in your PostgreSQL 13. The backup will only be taken for the schema since the information will be replicated in the initial transfer.

In PostgreSQL 12, run:

$ pg_dumpall -s > schema.sql

In PostgreSQL 13, run:

$ psql -d postgres -f schema.sql

Once you have your schema in PostgreSQL 13, you need to create the subscription, replacing the values of host, dbname, user, and password with those that correspond to your environment.

world=# CREATE SUBSCRIPTION sub1 CONNECTION 'host=10.10.10.140 dbname=world user=rep1 password=********' PUBLICATION pub1; 
NOTICE:  created replication slot "sub1" on publisher
CREATE SUBSCRIPTION

The above will start the replication process, which synchronizes the initial table contents of the tables in the publication and then starts replicating incremental changes to those tables.

To verify the created subscription you can use the pg_stat_subscription catalog. This view will contain one row per subscription for the main worker (with null PID if the worker is not running), and additional rows for workers handling the initial data copy of the subscribed tables.

world=# SELECT * FROM pg_stat_subscription;
-[ RECORD 1 ]---------+------------------------------
subid                 | 16421
subname               | sub1
pid                   | 464
relid                 |
received_lsn          | 0/23A8490
last_msg_send_time    | 2021-07-23 22:42:26.358605+00
last_msg_receipt_time | 2021-07-23 22:42:26.358842+00
latest_end_lsn        | 0/23A8490
latest_end_time       | 2021-07-23 22:42:26.358605+00

To verify when the initial transfer is finished you can check the srsubstate variable on pg_subscription_rel catalog. This catalog contains the state for each replicated relation in each subscription.

world=# SELECT * FROM pg_subscription_rel;
 srsubid | srrelid | srsubstate | srsublsn
---------+---------+------------+-----------
   16421 |   16408 | r          | 0/23B1738
   16421 |   16411 | r          | 0/23B17A8
   16421 |   16405 | r          | 0/23B17E0
   16421 |   16402 | r          | 0/23B17E0
(4 rows)

Column descriptions:

  • srsubid: Reference to subscription.

  • srrelid: Reference to relation.

  • srsubstate: State code: i = initialize, d = data is being copied, s = synchronized, r = ready (normal replication).

  • srsublsn: End LSN for s and r states.

When the initial transfer is finished, you have everything ready to point your application to your new PostgreSQL 13 server.

Conclusion

As you can see, PostgreSQL has different options to upgrade, depending on your requirements and downtime tolerance. 

No matter what kind of technology you are using, keeping your database servers up to date by performing regular upgrades is a necessary but difficult task, as you need to make sure that you won’t have data loss or data inconsistency after upgrading. A detailed and tested plan is the key here, and of course, it must include a rollback option, just in case.

Intro To Key-value Stores

$
0
0

When the internet gained popularity and relational databases could not cope with the tremendous variety of data types in the mid-1990s, non-relational databases or commonly referred to as NoSQL was developed and introduced by Carlo Strozzi. The acronym NoSQL was first used in 1998 when Carlo Strozzi gave a name to his lightweight and open-source relational database that did not use SQL. 

Initially, NoSQL was developed as a response to web data, processing the unstructured data and the need for quicker processing time. NoSQL usually stores data in key-value storage, document storage, wide column storage as well as in graph databases. In this blog post, we will go through in detail one of the categories and perhaps the most popular solution which is a key-value store.

What Is Key-Value Store And How Does It Work?

A key-value store also known as a key-value database can be defined as a non-relational database and simple database that utilize an associative array as their underlying data model. This associative array like JSON can comprise anything from a number or string even to a complicated object that uses a key to keep track of the object. In its simplest form, a key-value store uses a simple key-value method to store data. Take a look at the example below:

For this type of database, to store unique keys together with the pointers to the corresponding data values, a hash table is implemented. Since the key-value store is within the NoSQL family, generally it has no query language, therefore key management is essential for stable operations. Nevertheless, a way to add or remove the key-value pairs is provided and only the key can be queried while this is not possible for values. The way the data could be retrieved and updated is using a simple command like delete, get, and put. In most cases, the key-value store offers better improvement in terms of performance and also speed.

A key-value pair on the other hand is a combination of two pieces of data that are associated with each other. One good example of a key-value pair is a telephone directory where the key is the person while the value is the phone number of that respective person.

The key-value store allows horizontal scaling which is something that other types of databases cannot achieve and is also highly partitionable. To be able to precisely and swiftly locate a value by its key, key-value stores use compact and efficient index structures. As a result, it makes key-value stores the right choice for systems that require finding and retrieving data in continuous time.

Redis for example is a key-value database/store that has been optimized for tracking simple data structures like primitive types, lists, heaps, as well as maps in a persistent database. With this approach (supporting a limited number of value types), it manages to reveal a remarkably simple interface during querying and manipulating the data, not to mention the capability of its throughput. Besides Redis, the following are the lists of some of the common and popular key-value stores/databases, it’s worth noting that not every key-value store/database are the same as they are using different techniques and approaches:


Key-value Store Advantages

When working with a large amount of data, it is essential to have remarkably efficient and swift retrieval techniques or processes to ensure a smooth operation: you might have heard of MongoDB (NoSQL), that is sometimes used for precisely this reason: managing large data sets. If you are wondering why that’s the case, here are four notable advantages of using key-value stores:

  • Performance & Speed

Key-value stores bypass the traditional restriction that requires indexes. Since key-value stores use keys instead of indexes, it gives unmatched performance and delivers high throughput for data-intensive applications.

  • Improved User Experience

Storing data for customer personalization is very typical in key-value stores. Once the data is pulled from the customer together with their behaviours and preferences, they will be used to customize the user experience. 

  • Scalability

There is no doubt that key-value stores are excellent when it comes to processing data consequently makes it infinitely scalable in a horizontal method. Improves capability to accommodate the reads/writes operation.

  • Flexibility

Considering the value can be anything from a number to string or even JSON, it makes key-value stores completely flexible.

The Use Cases For Key-Value Store

There are always questions when it comes to handling a high volume of read/write operations for relational databases while this is not the case for key-value stores. Due to its advantages, especially in terms of scalability, no matter how big the data is, they are easily handled by key-value stores. Moreover, key-value stores manage to handle data lost with their built-in redundancy capability. Considering all of those factors, here are the list of common use cases for key-value stores or when typically it’s being used:

  • In web applications to store user session details and preferences

  • Extensively used in real-time product recommendations and advertisement

  • Used as a data caching to increase application performance

  • As a data cache for the data that is not updated regularly

  • Used as a material for big data research

Limitations of Key-Value Stores

Even though key-value stores look promising, there are still some limitations and disadvantages. These limitations also could possibly lead to a problem in some situations. Here are some of the lists that should be taken into consideration. These are general limitations:

  • Key-value stores are not optimized and require a parser for multiple values. They are only optimized for a single key and value.

  • These kinds of stores cannot filter out the value fields.

  • Key-value stores are not optimized for lookup. Lookup will do the scanning of the whole collection which will affect performance.
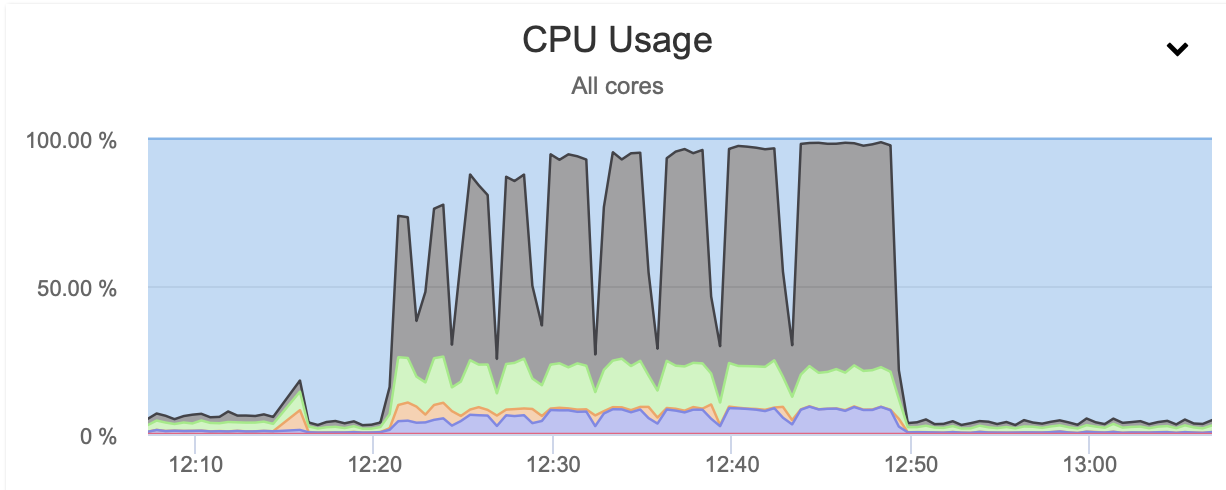
  • Key-value stores are, obviously, not compatible with SQL.

  • Key-value stores do not give us the ability to do a rollback in the event of a failure to save a key.

  • There is no standard query language as opposed to SQL.

Summary

A key-value store is one of the categories in NoSQL other than document storage, wide column storage as well as a graph database. It’s a non-relational and simple database that utilizes an associative array as its underlying data model. There are a lot of advantages as well as some disadvantages of using this type of database. We also went through some of the use cases for key-value stores. 

Hopefully, this blog post gives a better overview of key-value stores for some of you.

ClusterControl - Advanced Backup Management - PostgreSQL

$
0
0

Information is one of the most valuable assets in a company, so you will need a good Disaster Recovery Plan (DRP) to prevent data loss in the event of an accident or hardware failure. Backups are a basic step in all DR plans, but the management and monitoring of them could be a difficult task if you have a complex environment.

ClusterControl has many Advanced Backup Management features (among others important features like Auto Failover, Monitoring, etc.), that allow you not only to take different types of backups, in different ways, but also compress, encrypt, verify, and even more.

In this blog, we will see how you can use ClusterControl to manage your backups in an advanced way for your PostgreSQL database cluster.

Backup Types

First, let’s mention what types of backups you can use to keep your data safe.

  • Logical: The backup is stored in a human-readable format like SQL.

  • Physical: The backup contains binary data.

  • Full/Incremental/Differential: The definition of these three types of backups is implicit in the name. The full backup is a full copy of all your data. Incremental backup only backs up the data that has changed since the previous backup and the differential backup only contains the data that has changed since the last full backup executed. The incremental and differential backups were introduced as a way to decrease the amount of time and disk space usage that it takes to perform a full backup.

  • Point In Time Recovery compatible: PITR Involves restoring the database at any given moment in the past. To be able to do this, you will need to restore a full backup, and then apply all the changes that happened after the backup until right before the failure.

By using ClusterControl, you can take all these types of backups for your PostgreSQL database or even combine them to improve your Backup Strategy.

ClusterControl Backup Management Features

Now, let’s see how ClusterControl can help you to manage all the different types of backups from the same user-friendly UI and system.

We will assume you have your ClusterControl server installed and it is managing your PostgreSQL cluster. Otherwise, you can follow our Official Documentation to install ClusterControl and deploy or import your PostgreSQL cluster using it.

Creating a Backup

For this, go to ClusterControl -> Select your PostgreSQL Cluster -> Backup -> Create Backup.

You can create a new backup or configure a scheduled one. For our example, we will create a single backup instantly.

Here you have one method for each type of backup that we mentioned earlier.


Backup Type

Tool

Definition

Logical

pg_dumpall

It is a utility for writing out all PostgreSQL databases of a cluster into one script file. The script file contains SQL commands that can be used to restore the databases.

Physical

pg_basebackup

It is used to make a binary copy of the database cluster files while making sure the system is put in and out of backup mode automatically. Backups are always taken of the entire database cluster of a running PostgreSQL database cluster. These are taken without affecting other clients to the database.

Full/Incr/Diff

pgbackrest

It is a simple, reliable backup and restore solution that can seamlessly scale up to the largest databases and workloads by utilizing algorithms that are optimized for database-specific requirements. One of the most important features is the support for Full, Incremental, and Differential Backups.

PITR

pg_basebackup + WALs

To create a PITR compatible backup, ClusterControl will use pg_basebackup and the WAL files to be able to restore the database at any given moment in the past.


You must choose one method, the server from which the backup will be taken, and where you want to store the backup. You can also upload your backup to the cloud (AWS, Google Cloud, or Azure) in the same backup job by enabling the corresponding option.

Then, you can specify compression, encryption, and the retention period of your backups.

On the backup section, you can see the progress of the backup, and information like the method, size, location, and more.

Restoring a Backup

Once the backup is finished, you can restore it by using ClusterControl. For this, in your backup section (ClusterControl -> Select PostgreSQL Cluster -> Backup), you can select Restore Backup, or directly Restore on the backup that you want to restore.

You have three options to restore the backup. You can restore it in an existing database node, restore and verify the backup on a standalone host, or create a new cluster from the backup.

If you are trying to restore a PITR compatible backup, you also need to specify the time.

The data will be restored as it was at the time specified. Take into account that the UTC timezone is used and that your PostgreSQL service will be restarted in the destination node.

You can monitor the progress of your restore from the Activity section in your ClusterControl server.

Automatic Backup Verification

A backup is not a backup if it is not restorable. Verifying backups is something that is usually neglected by many. Let’s see how ClusterControl can automate the verification of PostgreSQL backups and avoid surprises in case you need to restore it.

In ClusterControl, select your cluster and go to the Backup section, then, select Create Backup.

The automatic verify backup feature is available for the scheduled backups. So, let’s choose the Schedule Backup option.

When scheduling a backup, in addition to selecting the common options like method or storage, you also need to specify schedule/frequency.

In the next step, you can compress and encrypt your backup, and specify the retention period. Here, you also have the Verify Backup feature.

To use this feature, you need a dedicated host (or VM) that is not part of the cluster.

ClusterControl will install the software and restore the backup in this host. You can keep this node running for testing or reporting, or shut down the node until the next verification job.

After restoring, you can see the verification icon in the ClusterControl Backup section.

Conclusion

Backups are mandatory in any environment as they help you to protect your data. To manage them, it is important to have a good tool with advanced backup features, to make it as simple as possible.

ClusterControl has many features to help you in this task, like backup scheduling, monitoring, backup verification, and even more. It also supports different backup methods and you can combine them to have a good DRP in place.

A Comparison Between ClusterControl and MongoDB OPS Manager

$
0
0

There are various ways to provision MongoDB servers, e.g., manual installation by command line, configuration management tools (eg. ansible, saltstack), or specialized MongoDB deployment tools such as ClusterControl and MongoDB Ops Manager

Manual installation will usually take time to set up, as we need to type in commands manually, starting from installing dependencies, downloading the database software, installing the database software and configuring/tuning the database servers. Following the steps outlined in a how-to is not hard, the harder thing is to ensure the deployment is done the right way if it is a production system - is the configuration adapted for the hardware and workload, are the servers secured, do we understand the tradeoffs between performance and reliability when setting certain configuration parameters. 

Using configuration management software can take even longer, there is a learning curve for the automation software itself before we can use it to automate deployments in a production environment. Of course, there will be trial and error in between the testing.

Using a specialized deployment tool for MongoDB helps companies with minimum resources and knowledge of MongoDB itself to provision the database easily and efficiently. In this blog, we will compare MongoDB Ops Manager to ClusterControl from Severalnines. 

Deployment

MongoDB has various architectures, such as MongoDB Standalone, Replication, ReplicaSets, and Sharded Clusters. Those architectures require different number of servers and components. For example, a ReplicaSet will consist of at least 3 nodes, and there are also various types of Secondary nodes e.g., delayed secondary, hidden secondary.

ClusterControl supports the 3 main topologies of MongoDB, starting from a standalone node, MongoDB ReplicaSet, and Sharded Cluster. It supports MongoDB deployment from two upstream sources, which are Percona and MongoDB. The database versions supported are from 3.6 to 4.2 at the time of writing.

The deployment for MongoDB in ClusterControl requires SSH connectivity between the controller and the database nodes and the user must have sudo privileges. We need to fill the cluster name, ssh user, password, the upstream vendor, and then specify the IP addresses of the database nodes.

MongoDB Ops Manager uses agents for the deployment of MongoDB. It also supports the deployment of standalone, ReplicaSet, and Sharded Cluster. We need to install the agent on the database node first, configure the mms endpoint, mms groupId and the mms api keys. After that, we need to prepare the data directory and configure the ownership of the directory. The last thing we need to do is bring up the agent service:

$ systemctl start mongodb-mms-automation-agent.service

And we can verify that Ops Manager can connect to the agent by clicking the Verify Agent button.

In the screenshot below, we’re setting up a ReplicaSet. 

There are options for configuring parameter settings, e.g., heartbeat timeout, election timeout, write concern majority.

Both ClusterControl and MongoDB Ops Manager have similar capabilities in deploying various MongoDB topologies.

Scalability

There are two options when we talk about scalability; scale-up and scale-out. Scale-up is a process of increasing the specs of the existing server, e.g.into a bigger VM. Scale-out is the process of adding more nodes to the database cluster.

ClusterControl supports the scale-out of the MongoDB cluster. In the Cluster menu, it is enough to use the  Add Node option.

There are two options when adding a node, we can add a brand new node where the software is installed, or import an existing MongoDB server. There is an option of the node type, either it is database server or arbiter. We just need to fill in the hostname and click finish. As simple as that for adding a new node in ClusterControl.

ClusterControl also has capabilities to convert ReplicaSets and Standalone nodes into Sharded Clusters.

MongoDB Ops Manager also has a feature for scaling out an existing database cluster. When we add the new MongoDB node, there are a few options of member types we can choose from :

  • Default - the MongoDB database server node

  • Arbiter - the arbiter is a MongoDB service that does not store the data, acts only for completing the quorum of the cluster.

  • Hidden - the node will not visible from the application perspective.

  • Hidden Delayed - the hidden delayed is the node that is hidden from the application and has delayed replication based on the threshold that we configure.

Both ClusterControl and MongoDB Ops Manager can perform scale-out of the cluster by adding new nodes. The difference is that MongoDB has an option for hidden and delayed secondary.

Monitoring and Alerting 

ClusterControl has various metrics in the dashboard, there are 2 categories of MongoDB metrics which are Replicaset and Server metrics. We can see information about the connection, the WiredTiger cache, concurrent read and writes,  global locking, and some other information. We can also see the performance advisors regarding the database and operating system.

These graphs will give us visibility about the current condition of the MongoDB database. ClusterControl also provides alerts via email, or it can be integrated with external tools. 

We can specify an External Email and choose the events we want to set to deliver. ClusterControl supports alerts to various collaboration channels eg: VictorOps, Telegram, OpsGenie, Slack, or we can create our own webhook in ClusterControl.

ClusterControl also provides performance advisors, which are mini programs that alert on different conditions. ClusterControl allows users to create their own custom advisors in a JavaScript like DSL language using a Developer Studio.

MongoDB Ops Manager also comes with metrics, such as database metrics, node metrics, and replication metrics. We can dig into the data if there is any performance issue in the database, and also we can configure database profiling to capture the queries and read the performance advisors.

The alert in MongoDB has a flexible setting which we can set based on certain conditions and criteria.

We can send the alert to specific roles and email too. On the integration part, MongoDB Ops Manager also has various integration options as below:

Both ClusterControl and MongoDB Ops Manager have the capability to monitor the current MongoDB database service and send the alert through the integration into the various third-party alerting applications.

Backup

Backup and restore is one of the most important tasks when managing a database. Backup is a critical aspect to tackle data loss that might lead to the disruption of business operations.

ClusterControl supports two methods of backup; mongodump and Percona Backup for MongoDB. The mongodump is a logical backup method that will take a backup for your collections, including the data and write it into the file. Percona Backup for MongoDB supports Point in Time Recovery backup for consistent backup across the MongoDB sharded clusters. This gives us the flexibility to restore based on an exact time. Percona Backup for MongoDB requires an agent called PBM Agent to be installed across the nodes and we need to have shared storage configured too.

MongoDB Ops Manager has its own built-in backup for taking the backup from source through agents. It will stream the data into the Oplog Store temporarily by the Backup Daemon. During the streaming of the backup, there is a process for watching the oplog. This is to gather the difference between the changes between the backup state and the current state of the database. The building process of backup starts when Ops Manager receives the first batch of sync and creates a local version of the backed up database which is called head database. The Backup Daemon will start inserting documents from the Oplog Store into the head database and applying oplog will apply tailed oplog entries that have already been watched into the head database. 

Support for Polyglot environments 

It is not uncommon for an application or a platform to be using other databases along with MongoDB, and these other databases also have to be managed - everything from maintaining availability, monitoring, managing backups, and so on. This is probably one of the biggest differences between ClusterControl and MongoDB Ops Manager, as ClusterControl allows its users to also automate MySQL, MariaDB, PostgreSQL, Redis, and Timescale.
 

That’s all for today. There are probably more differences that we have not covered in this post, we welcome you to share your own experiences.

ClusterControl - Advanced Backup Management - MongoDB

$
0
0

Disaster recovery does not complete without a proper backup system. When something bad happens, the data could be restored by using the backup preferably with the latest one. We might want to avoid restoring the data that is not updated. Probably there might be some information that is missing with the old backup. That is the reason why having a good backup practice is crucial for most systems nowadays.

MongoDB has become more popular year over year. There are a lot of companies started to use MongoDB as one of their databases. One of the features and probably the reason why MongoDB is popular is due to its speed and MongoDB is easy to scale. MongoDB is one of the supported databases in ClusterControl. You could deploy, import, scale and even perform the backup with ClusterControl. In this blog post, we will go through the Advanced Backup feature for the MongoDB replica set and sharded cluster.

MongoDB Backup Types

MongoDB supports both logical and physical backup. In addition to that, MongoDB also supports Point In Time Recovery (PITR). Let’s see what is the difference between all 3 types of backup.

Logical backup

mongodump

This utility will create a binary export of the contents of a database. Not only that, mongodump could export data from either mongod or mongos instances, can export data from standalone, replica set, and sharded cluster deployments

Physical backup

NA

Physical backup in MongoDB only could be done at the system level. At this time, there is no physical backup available in ClusterControl. The way physical backup works is by creating a snapshot on LVM or storage appliance.

PITR

Percona Backup for MongoDB

Percona Backup for MongoDB inherited from and replaces mongodb_consistent_backup, which is already deprecated. It is a distributed, low-impact solution for achieving consistent backups for both MongoDB sharded clusters and replica sets. This type of backup is logical but at the same time could act as a PITR backup.


Now that we know what is the difference between the backup type. 

MongoDB Backup Management

ClusterControl allows you to create the backup in realtime as well as schedule it at your desired schedule. One thing worth mentioning, in case you would like to schedule, ClusterControl will use UTC timezone. So you need to choose the right time that suits your timezone so that the schedule will run on the less busy time. 

Let’s go ahead and try to use the backup function in ClusterControl. In addition to that, we also will review one of the advanced features which is to upload the backup to the cloud. Starting with ClusterControl 1.9.0, MongoDB supports cloud upload that allows you to upload the backup to your preferred cloud storage provider.

MongoDB Logical Backup

Let’s started with logical backup. Before the feature upload the backup to the cloud could be used, you need to integrate it with your preferred cloud provider. For our case, we will integrate it with AWS cloud. To do the complete AWS integration, you may follow the following steps:

  • Use your AWS account email address and password to sign in to the AWS Management Console as the AWS account root user.

  • On the IAM Dashboard page, choose your account name in the navigation bar, and then choose My Security Credentials.

  • If you see a warning about accessing the security credentials for your AWS account, choose to Continue to Security Credentials.

  • Expand the Access keys (access key ID and secret access key) section.

  • Choose Create New Access Key. Then choose Download Key File to save the access key ID and secret access key to a file on your computer. After you close the dialog box, you can’t retrieve this secret access key again.

Assuming that you already have the MongoDB cluster ready, we will start our backup process. First, go to MongoDB cluster -> Backup -> Create Backup


On the next page, you could specify either want to enable the encryption or not. For encryption, ClusterControl will use OpenSSL to encrypt the backup using the AES-256 CBC algorithm. Encryption happens on the backup node. If you choose to store the backup on the controller node, the backup files are streamed over in encrypted format through socat or netcat. Encryption is considered as one of the advanced backup features that could be utilized, so in our case, we will enable this option. You also could define the retention period of your backup on this page. For our case, we will use the default setting of 31 days.

On the third page, you need to specify the login for the cloud provider, choose/create the bucket. You also could specify the retention for your cloud backup, the default setting is 180 days.

Once you click on the Create Backup button, the job will instantly be started and will take a while depending on your database size. At the same time, the backup will be uploaded to the cloud storage (AWS). You might notice the “key” and “cloud” icons are highlighted after the backup is completed like following:

Now that you have the backup ready, to restore the backup the step is very simple. All you have to do is by clicking on the “Restore” link and click on “Finish” button on the restore page like the following:

MongoDB PITR Backup

As mentioned earlier, Percona Backup for MongoDB is a PITR backup type. Before you could use this backup type, you need to install the agent (pbm-agent) on all of the MongoDB nodes/instances. Prior to that, you need to mount a shared directory on all nodes as well. Let’s get started!

First, you need to configure the NFS server. To install an NFS server, you need to choose or deploy any virtual machine, for our case we will install the NFS server in the ClusterControl node (Centos):

[root@ccnode ~]# dnf install nfs-utils

Once the NFS utility is installed, you may start the service and enable it at system boot:

[root@ccnode ~]# # systemctl start nfs-server.service

[root@ccnode ~]# # systemctl enable nfs-server.service

[root@ccnode ~]# # systemctl status nfs-server.service

The next step is to configure /etc/exports file so that the directory is accessible by the NFS clients:

[root@ccnode ~]# vi /etc/exports

/mnt/backups                    10.10.80.10(rw,sync,no_root_squash,no_subtree_check)

In the clients node which is our database nodes, we need to install necessary the NFS packages as well:

[root@n4 ~]# dnf install nfs-utils nfs4-acl-tools

Once the packages are installed, we may create the directory and mount it:

[root@n4 ~]# mkdir -p /mnt/backups

[root@n4 ~]# mount -t nfs 10.10.80.10:/mnt/backups /mnt/backups

Make sure to mount on all database nodes in order for us to install the pbm-agent. Considering all nodes already have the NFS mounted directory, we shall proceed to install the agent now. Go to MongoDB cluster -> Backup -> Settings -> Percona Backup

Once you click on the Install Percona Backup button, the following screen will appear. Here, you need to specify the shared directory. Again, please make sure that the directory has been mounted in all of your MongoDB nodes. Once the Backup Directory has been specified, you may click on the Install button and wait for the installation to complete.

The successful installation should be like the following screenshot. Now we could proceed with the backup process:

To create the backup using Percona Backup, the steps is simple. Unfortunately, you could not use the option to encrypt the backup using this method. In order to use the feature to upload to the cloud, you need to enable the option before choosing the backup type else your backup will be not uploaded. You will notice the upload feature will disappear once you choose “percona-backup-mongodb”.

On the second page you could specify the local retention:

As for the last page, you may specify the cloud details and retention like in the previous example. The restore process is the same as the previous example, all you need to do is to click on the “Restore” link and follow the steps on the restore page:

Conclusion

With ClusterControl, you could create and upload your MongoDB backup to the cloud. Uploading to the cloud is one of the new and advanced features for MongoDB that has been introduced starting with ClusterControl 1.9.0 providing the integration to cloud provider has been done successfully. You could also encrypt your backup using ClusterControl if you like to protect your backup.


Proactive MongoDB Monitoring (Developer Studio/Advisors angle)

$
0
0

ClusterControl has many metrics related to the database, replication, and also operating system. You can also monitor the process that runs inside the database through the opscounter in the Overview.

If you enable Agent Based Monitoring in ClusterControl, it will automatically install a prometheus database for time series database and also exporter (both mongo and node exporter) on the monitored node. After all has been setup, the Dashboard will be available for you with Cluster Overview, System Overview and also MongoDB (MongoDB Server and Replication) metrics that you can use to monitor the MongoDB database.

There is also an Ops Monitor in ClusterControl which can be used to monitor sessions inside the database.

Apart from the above mentioned, ClusterControl has capabilities to create custom Advisors through Developer Studio. In this blog, we will review Developer Studio and Advisors related to MongoDB.

Utilize Developer Studio

ClusterControl provides Developer Studio, so you can create custom Advisors related to the topic in MongoDB that you want to have advisory based on the best practices of database performance. Creating a script for custom advisors in MongoDB requires you to have knowledge in the javascript programming language, because all the advisors are written in javascript.You can access the Developer Studio through Manage -> Developer Studio, and you will be able to see the page as shown below:
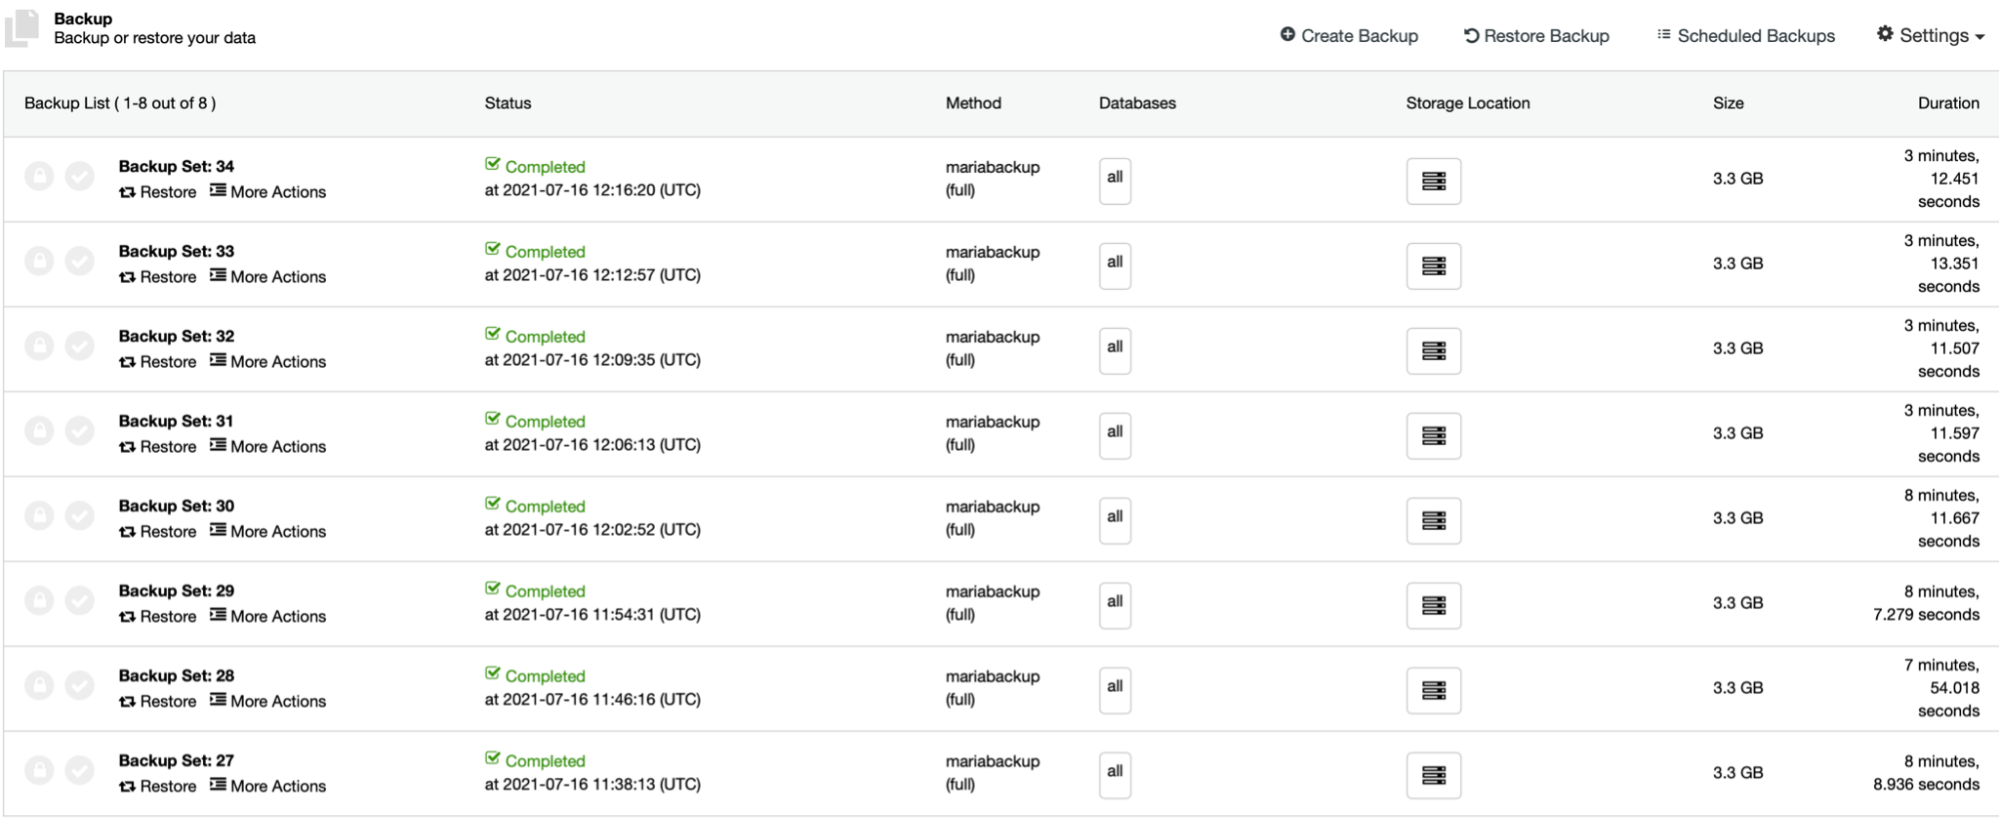
We can create new advisor script by clicking on the New button, after that it will display a dialogue to fill the filename as shown below:

We will create a simple lock.js script that will be stored in the path s9s/mongodb/connections. The script collects information related to the global lock in the MongoDB. The number of high global locks will be a problem in MongoDB, because the lock is still on hold / not released yet. Below is the sample of global lock in javascript:

#include "common/helpers.js"
#include "cmon/io.h"
#include "cmon/alarms.h"

var DESCRIPTION="This advisor collects the number of global locks every minute and"" notifies you if the number of locks exceeds 90%."" This number can indicate a possible concurrency issue if it’s consistently high."" This can happen if a lot of requests are waiting for a lock to be released..";
var WARNING_THRESHOLD=10;
var TITLE="Global lock used";
var ADVICE_WARNINGS="In the past 5 minutes more than 90% of "" there could be concurrently issue in the database.";
var ADVICE_OK="The percentage of global lock is satisfactory." ;

function main(hostAndPort) {
    if (hostAndPort == #N/A)
        hostAndPort = "*";
    var hosts   = cluster::mongoNodes();
    var advisorMap = {};
    var result= [];
    var msg = "";
    var endTime   = CmonDateTime::currentDateTime();
    var startTime = endTime - 10 * 60;

    for (i = 0; i < hosts.size(); i++)
    {
        host        = hosts[i];
        if(hostAndPort != "*"&& !hostMatchesFilter(host,hostAndPort))
            continue;
        if(host.hostStatus() != "CmonHostOnline")
            continue;
        var advice = new CmonAdvice();
        stats = host.mongoStats(startTime, endTime);
        total_global_lock = stats.toArray("globalLock.currentQueue.total");
       

        if (total_global_lock * 100 < WARNING_THRESHOLD)
        {
            advice.setSeverity(Warning);
            msg = ADVICE_WARNING;
        }
        if (advice.severity() <= 0) {
            advice.setSeverity(Ok);
        }
        advice.setHost(host);
        advice.setTitle(TITLE);
        advice.setAdvice(msg);
        advisorMap[i]= advice;
    }
    return advisorMap;
}

You can save the script, compile and run. You can schedule the script in Developer Studio based on the every minute, hour the script will run.

Advisors

The Advisors give us visibility about the state of the script that we had created in the Developer Studio, the script will run and regularly check the current of global lock. If the state is below the threshold that we define, the output becomes OK, but it will appear warning if the current global lock is above the threshold. We can see on the below screenshot that the Global lock used is appear in the Advisors and the state is OK currently.

Conclusion

Developer Studio and Advisors can give you benefit to make custom Advisors based on your requirements and displayed in the ClusterControl dashboard, and ofcourse the alert too.

That’s all for today!

ClusterControl - Advanced Backup Management - mariabackup Part III

$
0
0

So far in the previous two parts of this short blog series we have discussed several options that may impact the time and size of the backup. We have discussed different compression options and a setting related to throttling the network transfer should you stream the data from the node to the controller host. This time we would like to highlight something else - ability to take partial backups using MariaBackup. First, let’s talk what are the partial backups and what are the challenges related to them.

Partial backups

MariaBackup is a backup tool that creates physical backups. What it means is that it will copy the data stored in files on the database node to the target location. It will create a consistent backup of the database, something that allows you to restore your data to a precise point of time - the time when the backup completed. All data in all tables and schemas will be consistent. This is quite important to keep in mind. Consistent backups can be used to provision replicas, running Point-in-Time Restore and so on.

Partial backups on the other hand are, well, partial. Only a subset of the tables is backed up. Obviously, this makes the backup inconsistent. It cannot be used to create a replica or to restore the data to the same point of time. Partial backups still have their own use. They can be used to restore a subset of the data - instead of restoring whole backup you can restore just a single table and then extract the data you need. Sure, you can do the same with logical backups but those are quite slow and not really suitable for any kind of larger deployments.

The downside is that partial backup is not consistent in time. This should be quite obvious as we are collecting just a subset of the data. Another challenge is restore - you cannot restore partial backups directly on the production systems easily. First, because it is not straightforward, second, because it is not consistent. The safest way to restore partial backup would be to restore it on a separate node and then use mysqldump or SELECT INTO OUTFILE to extract required data.

Let’s take a look at the options that ClusterControl provides us with regarding the partial backups.

Partial backups in ClusterControl

First of all, partial backups are not used by default, you have to explicitly enable them. Then a set of options shows up which allows us to pick what we want to backup. We can pick a particular schema or a set of tables. We can take a backup of all tables except some or we can just tell that we want to take a backup of tables A, B and C.

Photo author
Photo description

Of course, when you go to the drop-down, you’ll see all databases and all tables listed to pick from.

We have picked some of the tables and schemas and we are going to run this backup now. Of course, if you want that, you can schedule partial backups in exactly the same way as normal ones.

On the second screen we can configure mariabackup to our liking, just like we explained in our previous blog posts. That’s it, click on the Create Backup button and the process will start.

Restoring partial backup in ClusterControl

Once the backup is ready, it will become visible on the backup list.

We can see it is a partial backup because there is a list of schemas that are included in it.

When we attempt to restore a partial backup in an asynchronous replication cluster we are presented with two options. Restore on node and restore and verify on standalone host. The former is definitely not something we want to do as it would wipe out some of the data we do not have in the backup. The latter option, on the other hand, allows you to deploy a separate node and restore the backup on it.

All that we need to do is to pick a hostname that is reachable by SSH from ClusterControl and ensure that it won’t be stopped after the backup is restored. This will let us restore the partial backup and then access it to extract any kind of data we may want.

We hope that this short blog gives you some insight into how ClusterControl allows you to perform partial backups, what are the use cases and how can you restore them in a safe way.

Proactive MySQL Monitoring (Developer Studio/Advisors Angle)

$
0
0

Monitoring your MySQL database proactively is imperative nowadays. It plays a crucial and significant part for managing and controlling your database especially for your production-grade clusters. Missing specific information that would be beneficial for improving your database or failing to identif the root cause for problems that can be encountered might produce extreme difficulty to fix or recover from its glory days.

Proactive monitoring in your MySQL database allows your team to understand how your database services are performing. Does it function and deliver based on the workload it is expected to carry? Do you have enough resources for the server to be performant based on the workload that it is currently handling? Proactive monitoring applies things that shall prevent disaster or from harming your database which shall notify you in advance. Thus, allowing the DBAs or administrators to perform important tasks to avoid encountering malfunctions, data corruption, security exploits and attacks, or unexpected bounce of traffic in your database cluster. By these being attended immediately, proactive monitoring for MySQL has to be automated and shall operate 24/7 without interruption and it's up to the DBAs, Devops, administrators to decide whether based on priority of tasks and how crucial it is if it requires maintenance or just a typical daily routine work.
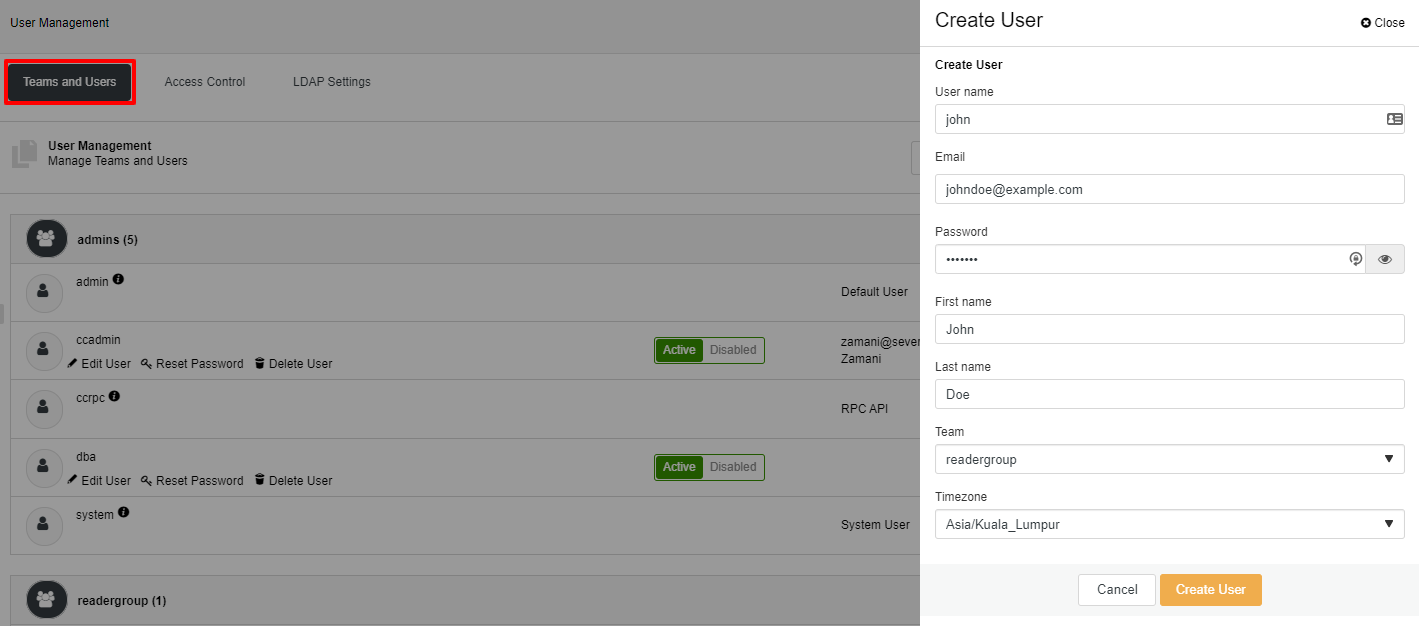
Proactive monitoring with ClusterControl

ClusterControl offers a diverse style for monitoring your MySQL database servers. Its approach is comparable to other enterprise monitoring tools and to enterprise-grade cloud solutions. ClusterControl tends to apply all the best practices for managing and monitoring the databases but with the flexibility to configure in order to achieve the desired setup based in your environment.

When it comes to alarms and notifications, ClusterControl has a mixed approach for which there are built-in alarms, and then there's the Advisors for which we'll discuss more over on this blog.

ClusterControl Alarms for MySQL

Alarms indicate problems that could affect or degrade the cluster as a whole. This interface provides a detailed explanation on the problem, together with the recommended action (if available) to resolve the problem. Each alarm is categorized as:

  • Cluster

  • Cluster recovery

  • Database health

  • Database performance

  • Host

  • Node

  • Network

An alarm can be acknowledged by checking the Ignore? checkbox. When ignored, no notification will be sent via email. An alarm cannot be deleted or dismissed, though you can hide it from the list by clicking on Hide Ignored Alarms button.

See example screenshot below,

Proactivity with ClusterControl

ClusterControl supports auto recovery which reacts whenever a failure detection has occurred. Auto Recovery with ClusterControl is one of the most proactive functionalities that plays a crucial role in the event of disasters.

Enabling the auto recovery is required for this proactive monitoring which reacts in various situations, for example, if the primary MySQL node fails.

In ClusterControl, this will be detected right away as it listens to the connection with the database server, or in this case the primary server. ClusterControl will react ASAP and apply a failover.

The failover is part of the enabled Cluster recovery. Since both buttons Cluster and Node are enabled, then it follows the node recovery as you see below.

Depending on the reachability of the nodes, ClusterControl will try to continuously attempt by connecting through SSH and try to reach the node and attempt to recover by starting using sysvinit or systemd. Obviously, you might think that it applies a failover and ClusterControl tries to start the failed primary. That could mean two database nodes are available, right? Although true, ClusterControl will take the failed primary to a read-only state while being recovered. See below,

Although there are certain options you can set to manage the failover mechanism, you should refer to our documentation for this since it is not the focus of this blog.

Using Advisors for Proactivity with ClusterControl

In ClusterControl, Advisors will be located by going to <Select Your MySQL Cluster> → Performance → Advisors. ClusterControl advisors are set to be applied depending on the cluster it is trying to monitor. For example, a MySQL Replication and MySQL with Galera Cluster running either on Percona or MariaDB can have differences. For example, the MySQL Replication Advisors have the following,

While in a Galera Cluster, it adds the Galera specific advisors as shown below,

Customizing your ClusterControl MySQL Advisors

Advisors are customizable and can be modified in accordance to your needs. In the Advisors' screenshot above, just click Edit and you'll be redirected to the simple IDE we have built-in in ClusterControl.

You can also create your own ClusterControl Advisors. You can refer yourself to learn more about creating by reading Write Your First Advisor or take the 2-part series to create your own using Meltdown/Spectre detection script.

How Are ClusterControl Advisors Being Proactive?

Technically, ClusterControl advisors mostly act as a notifier and literally your advisors. ClusterControl Advisors will notify you if it detects unusual behavior if it reaches over the base thresholds set by default by ClusterControl. Usually, the thresholds applied are generic values. These generic values are based on best practices and on the most common and acceptable workload or environment setup. Most of the advisors' default does not provide alarms or alert mechanisms in the ClusterControl UI. It does notify you via the UI (see sample screenshot of the Binlog Storage Location advisor below).

As mentioned earlier, Advisors can be modified and are editable via our simple editor or IDE. For example in a MySQL Replication cluster, ClusterControl provides a Binlog Storage Location advisor. It detects that binlogs are stored in the data directory where it advises that it must be outside the data directory.

Let's take an example from the list of advisors and select Connections currently used advisor. Let's edit this as shown below,

or alternatively, you can go over to <Select Your MySQL Cluster> → Manage → Developer Studio and select the connections_used_pct.js as shown below. 


By making it more proactive by sending alarms, you can modify it and add the following functions just like below,

function myAlarm(title, message, recommendation)
{
  return Alarm::alarmId(
        Node,
      true,
        title,
        message,
        recommendation
  );
}

Whereas, setting the threshold to 20 then add these lines below just within the if condition statement where threshold is reached above its given threshold value.

                 myAlarmId = myAlarm(TITLE, msg, ADVICE_WARNING);
                // Let's raise an alarm.
                host.raiseAlarm(myAlarmId, Warning);
Here's the complete script with my modifications in bold,
#include "common/mysql_helper.js"
var DESCRIPTION="This advisor calculates the percentage of threads_connected over max_connections,"" if the percentage is higher than 20% you will be notified,"" preventing your database server from becoming unstable.";
var WARNING_THRESHOLD=20;
var TITLE="Connections currently used";
var ADVICE_WARNING="You are using more than " + WARNING_THRESHOLD +
    "% of the max_connections."" Consider regulating load, e.g by using HAProxy. Using up all connections"" may render the database server unusable.";
var ADVICE_OK="The percentage of currently used connections is satisfactory." ;

function myAlarm(title, message, recommendation)
{
  return Alarm::alarmId(
        Node,
      true,
        title,
        message,
        recommendation
  );
}


function main()
{
    var hosts     = cluster::mySqlNodes();
    var advisorMap = {};
    for (idx = 0; idx < hosts.size(); ++idx)
    {
        host        = hosts[idx];
        map         = host.toMap();
        connected     = map["connected"];
        var advice = new CmonAdvice();
        print("");
        print(host);
        print("==========================");
        if (!connected)
        {
            print("Not connected");
            continue;
        }
        var Threads_connected = host.sqlStatusVariable("Threads_connected");
        var Max_connections   = host.sqlSystemVariable("Max_connections");
        if (Threads_connected.isError() || Max_connections.isError())
        {
            justification = "";
            msg = "Not enough data to calculate";
        }
        else
        {
            var used = round(100 * Threads_connected / Max_connections,1);
            if (used > WARNING_THRESHOLD)
            {
                advice.setSeverity(1);
                msg = ADVICE_WARNING;
                justification = used + "% of the connections is currently used,"" which is > " + WARNING_THRESHOLD + "% of max_connections.";
                 myAlarmId = myAlarm(TITLE, msg, ADVICE_WARNING);
                // Let's raise an alarm.
                host.raiseAlarm(myAlarmId, Warning);
            }
            else
            {
                justification = used + "% of the connections is currently used,"" which is < 90% of max_connections.";
                advice.setSeverity(0);
                msg = ADVICE_OK;
            }
        }
        advice.setHost(host);
        advice.setTitle(TITLE);
        advice.setJustification(justification);
        advice.setAdvice(msg);
        advisorMap[idx]= advice;
        print(advice.toString("%E"));
    }
    return advisorMap;
}

You can use sysbench to test it. In my test, I am proactively notified by sending the alarm. This shall also be sent to me via email or can be notified if you have integrated third party notifications. See the screenshot below,

ClusterControl’s Advisors Caveats

Modifying or editing an existing advisor in ClusterControl is applied to all clusters. That means, you need to check in your script if it has a specific condition applicable only for your existing cluster (either MySQL or other supported databases by ClusterControl). This is because the ClusterControl advisors are stored in a single source only via our cmon DB. These are pulled or retrieved by all clusters you have created in ClusterControl.

For example, you can do this in a script:

    var hosts     = cluster::mySqlNodes();

    var advisorMap = {};

    print(hosts[1].clusterId());

This script will print the cluster ID. Once you get the value, assign it to a variable and use that variable to evaluate if it's true that this specific cluster ID is acceptable or not based on your desired task to be done by your advisor. Let say,

function main()
{
    var hosts     = cluster::mySqlNodes();
    var advisorMap = {};
    for (idx = 0; idx < hosts.size(); ++idx)
    {
        host        = hosts[idx];
        map         = host.toMap();
        connected     = map["connected"];
        var advice = new CmonAdvice();
        print("");
        print(host);
        print("==========================");
        if (host.clusterId() == 15)
        {
            print("Not applicable for cluster id == 15");
            continue;
        }
…
….
…..

which means if it's the cluster_id == 15, then just skip or continue to the next loop.

Conclusion

Creating or modifying the ClusterControl Advisors is a good opportunity to leverage the hidden functionality that ClusterControl can provide you. It might appear to be hidden but it's there - it’s just that the feature is used less. It provides simple but a powerful feature called ClusterControl Domain Specific Language (CDSL) which can be used for extremely difficult tasks that ClusterControl lacks. Just make sure you know all of the caveats and also do test everything first before finally applying it to your production environment.

ClusterControl: Intro to the New Query Monitor

$
0
0

ClusterControl 1.9.0 was released on July 16th 2021 with a lot of new features introduced to the system. Those features include Redis Management and Monitoring, a new agent-based Query Monitoring system for MySQL and PostgreSQL, pgBackRest improvements as well as some other improvements listed here. We are quite excited as this is our second major release for 2021 after ClusterControl 1.8.2.

If you are new to ClusterControl, Query Monitor is one of our useful features where you can get information about the workload of your database. Query Monitor provides a summary of query processing across all nodes in the cluster which becomes indispensable when you notice or experience performance degradation. Not all Query Monitoring features are the same for each database type, for example, the Query Monitor for MySQL based is different from the Query Monitor for PostgreSQL.  

Having a top-notch performance is not an excuse especially when you are running mission-critical applications apart from providing the best user experience.

In this blog post, we will discuss what the new Query Monitor has offered and go through some of the steps on how to enable it for both MySQL-based and PostgreSQL-based system. Without further ado, let’s get started! 

Our New MySQL Query Monitor

If you already updated this new version, you will probably notice some of the changes on the interface. The new Query Monitor will have an additional tab called Overview. The Query Overview is a place where you can get a general overview of all queries for your database cluster. For MySQL based database instances, you need to enable the “performance_schema” parameter for all your MySQL instances before the query agent can be installed. You would see the following screenshot if you click on the Query Overview tab:

If you have not enabled the “performance_schema” you will not be able to utilize this dashboard. You could enable the parameter through Cluster -> Manage -> Configurations and edit the /etc/my.cnf file for all hosts. Make sure to update the value to the following:

performance_schema = ON

Once this is done, you need to do a rolling restart of the cluster from the cluster’s action list so that the change takes effect. Without a rolling restart, the query agent cannot be installed.

Of course, you could also do it manually from your database nodes, it depends on your preference. If you choose the manual way, you may SSH to your database instance and edit /etc/my.cnf.If you would like to SSH from the ClusterControl UI, you could easily do it from the node action list like in the screenshot below:

 Now you should notice the following screenshot after the rolling restart is completed and all you need to do is to click on the Install Query Monitor Agent:

It should only take a while before you could see the new Query Overview dashboard like the following screenshot:

In our new Query Overview dashboard, there are a few variables that you could monitor and get the metrics from. Here you could see the throughput, concurrency, average latency, error as well as the list of the queries at the bottom. The explanation for each of them are as follows:
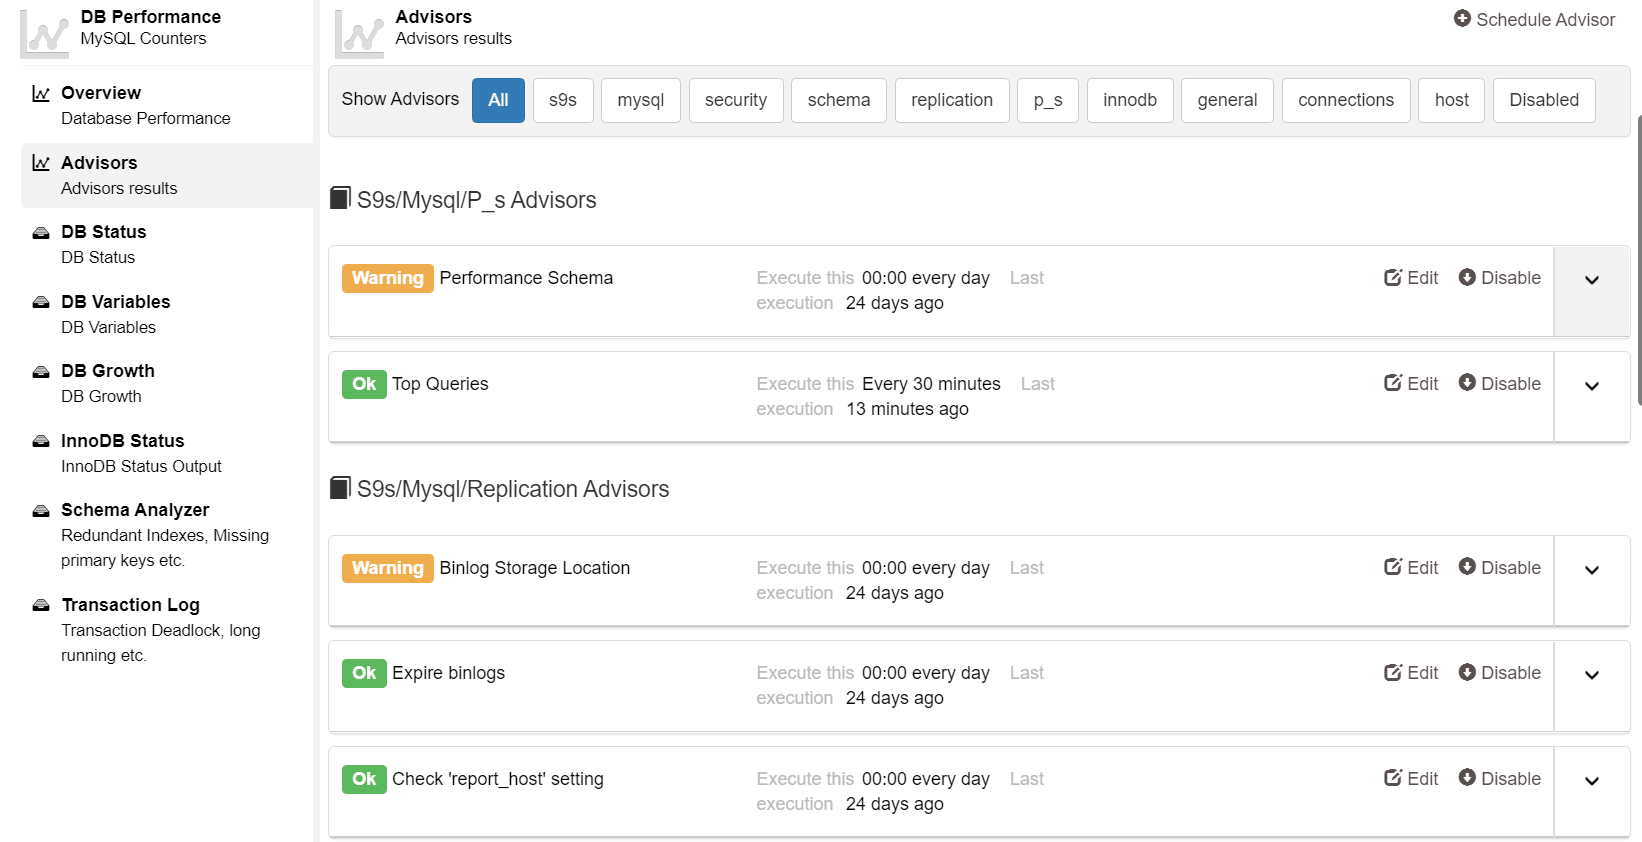
  • Throughput - Query per second (q/s) 

    • The overall capability to process data that is measured in queries per second, transaction per second or the average response time.

  • Concurrency - Lock time (s)

    • The number of concurrent queries, especially the INSERT query. It’s measured in seconds.

  • Average Latency - Average query time (s)

    • The latency distribution of statements running within this MySQL instance.

  • Errors - Errors (sec)

    • The number of query errors per second for the cluster. 

You can select which database instance that you would like to see the metrics as well as the timeframe from 15 minutes up to 4 hours for each of them. With this option, you can easily identify what is happening in that particular instance.

At the bottom of the dashboard, you can notice that there is a list of queries that are currently running for your cluster. Here, you can see the information of the query digest, schema, count, rows and also the execution time.

As opposed to the older version (1.8.2), this is a totally new dashboard and it will be very useful when you want to have an overview of the cluster. With the metrics here, you will be able to take necessary actions if you notice that your cluster performance is not optimal.

New Query Monitor For PostgreSQL

The same process needs to be done for PostgreSQL: once you upgrade the ClusterControl to 1.9.0 you will need to install the query monitor agent before you could get the metrics for the Query Overview. You will see output similar to the one below:

However, for PostgreSQL you don’t have to enable any parameter like you need to for MySQL-based datbaases, you could straight away install the agent from the dashboard. The installation should take a while before you could see the Query Overview dashboard like below.

As you could see, the dashboard is a little bit different from the MySQL dashboard where there are only 2 metrics which are throughput and average latency. Like MySQL based Query Overview dashboard, you could also select the database instance that you want to see the metrics as well as the time range. 

You could also see the list of the queries below of the metrics as shown in the screenshot above. In the query list, you could see the digest, schema, count, rows and execution time of each query.

Final Thoughts

We think the new Query Monitor is quite useful when you want to see what is happening with your queries in a database instance. Imagine you have a few nodes: you can easily switch the database instance from the Query Overview to see the metrics. With this option, you are able to know specifically what is happening on each of your database instances.

For MySQL-based instances, remember to turn on/enable “performance_schema” for each of the database instances before you install the query agent and proceed to seeing the overview.

What are your thoughts on our new Query Monitor? Do you like it and find it useful? Let us know in the comment section below.

ClusterControl Schema Advisors: Why, When, How?

$
0
0

If you’re a database administrator, your database schema is probably one of the primary things you keep a watchful eye on. However, database schema design consists of many different things, and as a database administrator you’re probably busy enough as it is. That’s why there are tools that help you automate your database processes with ease - one of them is ClusterControl.

ClusterControl offers many unique features including backup management, monitoring and alerting, deployment, scaling, upgrades and patches, security and compliance, configuration management, performance management, and more. One of those features are performance advisors: ClusterControl’s performance advisors can be split into a few different categories because they accomplish different tasks: some of them monitor your performance schema, some of them monitor indexes, some of them monitor the replication configuration, etc.: in this blog post, we are going to look into schema advisors available in ClusterControl.

To observe the list of advisors available in ClusterControl, log into the system, head over to Performance -> Advisors:

You will be able to see a bunch of performance advisors. These advisors, as you can see, can be categorized into a couple of different categories: all advisors would show all of the advisors available in ClusterControl, MySQL would show only advisors relevant to MySQL, security would show security-based advisors, replication would show advisors relevant to the replication of your database nodes, innodb would obviously take care of InnoDB, etc.: we are going to dig into the schema advisors available in ClusterControl.

Schema Advisors

Severalnines’ ClusterControl, at the time of writing, has only one schema advisor, but that advisor is extremely important too and shouldn’t be overlooked in any scenario. Take a look, can you guess why?

In this case, schema advisors are checking for tables with duplicate indexes. We should be glad that ClusterControl has found no duplicate indexes inside of our tables - here’s why:

  • We generally use indexes when we want to improve our SELECT query performance keeping in mind that indexes slow down INSERT, DELETE, and UPDATE queries.

  • Database management systems (such as MySQL) generally does not protect us from making mistakes such as adding multiple indexes on the same table:

    CREATE TABLE `demo_table` (
    `id` INT(10) NOT NULL AUTO_INCREMENT PRIMARY KEY,
    `column_2` VARCHAR(10) NOT NULL,
    `column_3` VARCHAR(10) NOT NULL,
    INDEX(id),
    UNIQUE(id)
    );


    In this case, you might think that the ID would be implemented as a primary key, with a B-tree and a unique index on it, however, that’s not the case: MySQL implements all PRIMARY KEY constraints with indexes, and since we have specified an INDEX and a UNIQUE INDEX on it, that would add two more indexes on the same column! See how that might be a problem?

  • Indexes, as already stated, slow down INSERT, DELETE, and UPDATE queries - if you have unnecessary indexes (say, two or more on the same column) and you want to execute one or more of them against your database instances, your queries will be unnecessarily slow.

Editing and Deleting Schema Advisors

With that being said, you probably already have an idea how schema advisors provided by ClusterControl can solve your database issues - however, what’s also worth mentioning is that all of the advisors (including schema advisors) can also be edited or deleted - when editing those, bear in mind that you will probably need some knowledge of javascript and also know your way around a couple of SQL queries:


These kinds of scripts, as you can see above them, can be compiled, disabled or scheduled as well: want to run them at specific times (want to run them at specific hours? Minutes? Days? Months? Weekdays? No problem, ClusterControl has you covered here too!):
 

Isn’t that convenient?

Schema advisors (in this case, a duplicate index advisor), would be very useful when you know that indexes are used by a specific database instance, but not sure how many of them are absolutely necessary - do you have to use that index on the column A? Why is there a PRIMARY KEY? Do you really need a UNIQUE INDEX? Etc.

Make sure to give ClusterControl a try today - it can not only solve your index-related problems, but also help you in regards to backing up your data, monitoring performance, also recovering and even automatically repairing your data! Aside from that, ClusterControl also has a command line client (CLI) that is automatically integrated and synchronized with the GUI allowing you to use the CLI to its fullest extent - deployment, configuration and management while using the GUI to achieve your monitoring and troubleshooting goals.

Viewing all 385 articles
Browse latest View live