Quantcast
Channel: Severalnines - clustercontrol
Viewing all 385 articles
Browse latest View live

Planets9s - Download our new DevOps Guide to Database Backups for MariaDB & MySQL

$
0
0

Welcome to this week’s Planets9s, covering all the latest resources and technologies we create around automation and management of open source database infrastructures.

Download our new DevOps Guide to Database Backups for MariaDB & MySQL

Check out our free whitepaper on database backups, which discusses in detail the two most popular backup utilities available for MySQL and MariaDB, namely mysqldump and Percona XtraBackup. If you’re looking for insight into how to perform database backups efficiently or the impact of Storage Engine on MySQL or MariaDB backup procedures, need some tips & tricks on MySQL / MariaDB backup management … our new DevOps Guide has you covered.

Download the whitepaper

Tips and Tricks: Receive email notifications from ClusterControl

Did you know that apart from receiving notifications when things go wrong, you can also receive digest emails for less critical notifications from ClusterControl? As SysAdmins and DBAs, we need to be notified whenever something critical happens to our database. But would it not be nicer if we were informed upfront, and still had time to perform pre-emptive maintenance and retain high availability?  With this new blog post, find out how to enable and set up your email notifications in ClusterControl according to your needs.

Read the blog

Getting social with Severalnines

As we begin to wrap up 2016 and look towards and plan all the exciting things for next year, we wanted to take a moment to encourage you to follow and engage with us on our social channels. We produce plenty of content and have a lot more planned for 2017. To ensure that you don’t miss out on any of it, we’d love it if you would follow us so we can better keep you up to date and interact more directly with you.

Get social

That’s it for this week! Feel free to share these resources with your colleagues and follow us in our social media channels.

Have a good end of the week,

Jean-Jérôme Schmidt
Planets9s Editor
Severalnines AB


Tips and Tricks - How to shard MySQL with ProxySQL in ClusterControl

$
0
0

Having too large a (write) workload on a master is dangerous. If the master collapses and a failover happens to one of its slave nodes, the slave node could collapse under the write pressure as well. To mitigate this problem you can shard horizontally across more nodes.

Sharding increases the complexity of data storage though, and very often, it requires an overhaul of the application. In some cases, it may be impossible to make changes to an application. Luckily there is a simpler solution: functional sharding. With functional sharding you move a schema or table to another master, and thus alleviating the master from the workload of these schemas or tables.

In this Tips & Tricks post, we will explain how you can functionally shard your existing master, and offload some workload to another master using functional sharding. We will use ClusterControl, MySQL replication and ProxySQL to make this happen, and the total time taken should not be longer than 15 minutes in total. Mission impossible? :-)

The example database

In our example we have a serious issue with the workload on our simple order database, accessed by the so_user. The majority of the writes are happening on two tables: orders and order_status_log. Every change to an order will write to both the order table and the status log table.

CREATE TABLE `orders` (
  `id` int(11) NOT NULL AUTO_INCREMENT,
  `customer_id` int(11) NOT NULL,
  `status` varchar(14) DEFAULT 'created',
  `total_vat` decimal(15,2) DEFAULT '0.00',
  `total` decimal(15,2) DEFAULT '0.00',
  `created` timestamp NOT NULL DEFAULT CURRENT_TIMESTAMP,
  `updated` timestamp NOT NULL DEFAULT CURRENT_TIMESTAMP ON UPDATE CURRENT_TIMESTAMP,
  PRIMARY KEY (`id`)
) ENGINE=InnoDB DEFAULT CHARSET=utf8;
CREATE TABLE `order_status_log` (
  `orderId` int(11) NOT NULL,
  `status` varchar(14) DEFAULT 'created',
  `changeTime` timestamp NOT NULL DEFAULT CURRENT_TIMESTAMP,
  `logline` text,
  PRIMARY KEY (`orderId`, `status`, `changeTime` )
) ENGINE=InnoDB DEFAULT CHARSET=utf8;
CREATE TABLE `customers` (
  `id` int(11) NOT NULL AUTO_INCREMENT,
  `firstname` varchar(15) NOT NULL,
  `surname` varchar(80) NOT NULL,
  `address` varchar(255) NOT NULL,
  `postalcode` varchar(6) NOT NULL,
  `city` varchar(50) NOT NULL,
  `state` varchar(50) NOT NULL,
  `country` varchar(50) NOT NULL,
  PRIMARY KEY (`id`)
) ENGINE=InnoDB DEFAULT CHARSET=utf8;

What we will do is to move the order_status_log table to another master.

As you might have noticed, there is no foreign key defined on the order_status_log table. This simply would not work across functional shards. Joining the order_status_log table with any other table would simply no longer work as it will be physically on a different server than the other tables. And if you write transactional data to multiple tables, the rollback will only work for one of these masters. If you wish to retain these things, you should consider to use homogenous sharding instead where you keep related data grouped together in the same shard.

Installing the Replication setups

First, we will install a replication setup in ClusterControl. The topology in our example is really basic: we deploy one master and one replica:

But you could import your own existing replication topology into ClusterControl as well.

After the setup has been deployed, deploy the second setup:

While waiting for the second setup to be deployed, we will add ProxySQL to the first replication setup:

Adding the second setup to ProxySQL

After ProxySQL has been deployed we can connect with it via command line, and see it’s current configured servers and settings:

MySQL [(none)]> select hostgroup_id, hostname, port, status, comment from mysql_servers;
+--------------+-------------+------+--------+-----------------------+
| hostgroup_id | hostname    | port | status | comment               |
+--------------+-------------+------+--------+-----------------------+
| 20           | 10.10.36.11 | 3306 | ONLINE | read server           |
| 20           | 10.10.36.12 | 3306 | ONLINE | read server           |
| 10           | 10.10.36.11 | 3306 | ONLINE | read and write server |
+--------------+-------------+------+--------+-----------------------+
MySQL [(none)]> select rule_id, active, username, schemaname, match_pattern, destination_hostgroup from mysql_query_rules;
+---------+--------+----------+------------+---------------------------------------------------------+-----------------------+
| rule_id | active | username | schemaname | match_pattern                                           | destination_hostgroup |
+---------+--------+----------+------------+---------------------------------------------------------+-----------------------+
| 100     | 1      | NULL     | NULL       | ^SELECT .* FOR UPDATE                                   | 10                    |
| 200     | 1      | NULL     | NULL       | ^SELECT .*                                              | 20                    |
| 300     | 1      | NULL     | NULL       | .*                                                      | 10                    |
+---------+--------+----------+------------+---------------------------------------------------------+-----------------------+

As you can see, ProxySQL has been configured with the ClusterControl default read/write splitter for our first cluster. Any basic select query will be routed to hostgroup 20 (read pool) while all other queries will be routed to hostgroup 10 (master). What is missing here is the information about the second cluster, so we will add the hosts of the second cluster first:

MySQL [(none)]> INSERT INTO mysql_servers VALUES (30, '10.10.36.13', 3306, 'ONLINE', 1, 0, 100, 10, 0, 0, 'Second repl setup read server'), (30, '10.10.36.14', 3306, 'ONLINE', 1, 0, 100, 10, 0, 0, 'Second repl setup read server');
Query OK, 2 rows affected (0.00 sec) 
MySQL [(none)]> INSERT INTO mysql_servers VALUES (40, '10.10.36.13', 3306, 'ONLINE', 1, 0, 100, 10, 0, 0, 'Second repl setup read and write server');
Query OK, 1 row affected (0.00 sec)

After this we need to load the servers to ProxySQL runtime tables and store the configuration to disk:

MySQL [(none)]> LOAD MYSQL SERVERS TO RUNTIME;
Query OK, 0 rows affected (0.00 sec)
MySQL [(none)]> SAVE MYSQL SERVERS TO DISK;
Query OK, 0 rows affected (0.01 sec)

As ProxySQL is doing the authentication for the clients as well, we need to add the os_user user to ProxySQL to allow the application to connect through ProxySQL:

MySQL [(none)]> INSERT INTO mysql_users (username, password, active, default_hostgroup, default_schema) VALUES ('so_user', 'so_pass', 1, 10, 'simple_orders');
Query OK, 1 row affected (0.00 sec)
MySQL [(none)]> LOAD MYSQL USERS TO RUNTIME;
Query OK, 0 rows affected (0.00 sec)
MySQL [(none)]> SAVE MYSQL USERS TO DISK;
Query OK, 0 rows affected (0.00 sec)

Now we have added the second cluster and user to ProxySQL. Keep in mind that normally in ClusterControl the two clusters are considered two separate entities. ProxySQL will remain part of the first cluster. Even though it is now configured for the second cluster, it will only be displayed under the first cluster,.

Mirroring the data

Keep in mind that mirroring queries in ProxySQL is still a beta feature, and it doesn’t guarantee the mirrored queries will actually be executed. We have found it working fine within the boundaries of this use case. Also there are (better) alternatives to our example here, where you would make use of a restored backup on the new cluster and replicate from the master until you make the switch. We will describe this scenario in a follow up Tips & Tricks blog post.

Now that we have added the second cluster, we need to create the simple_orders database, the order_status_log table and the appropriate users on the master of the second cluster:

mysql> create database simple_orders;
Query OK, 1 row affected (0.01 sec)
mysql> use simple_orders;
Database changed
mysql> CREATE TABLE `order_status_log` (
  `orderId` int(11) NOT NULL,
  `status` varchar(14) DEFAULT 'created',
  `changeTime` timestamp NOT NULL DEFAULT CURRENT_TIMESTAMP,
  `logline` text,
  PRIMARY KEY (`orderId`, `status`, `changeTime` )
) ENGINE=InnoDB DEFAULT CHARSET=utf8;
Query OK, 0 rows affected (0.00 sec)
mysql> create user 'so_user'@'10.10.36.15' identified by 'so_pass';
Query OK, 0 rows affected (0.00 sec)
mysql> grant select, update, delete, insert on simple_orders.* to 'so_user'@'10.10.36.15';
Query OK, 0 rows affected (0.00 sec)

This enables us to start mirroring the queries executed against the first cluster onto the second cluster. This requires an additional query rule to be defined in ProxySQL:

MySQL [(none)]> INSERT INTO mysql_query_rules (rule_id, active, username, schemaname, match_pattern, destination_hostgroup, mirror_hostgroup, apply) VALUES (50, 1, 'so_user', 'simple_orders', '(^INSERT INTO|^REPLACE INTO|^UPDATE|INTO TABLE) order_status_log', 20, 40, 1);
Query OK, 1 row affected (0.00 sec)
MySQL [(none)]> LOAD MYSQL QUERY RULES TO RUNTIME;
Query OK, 1 row affected (0.00 sec)

In this rule ProxySQL will match everything that is writing to the orders_status_log table, and send it in addition to the hostgroup 40. (write server of the second cluster)

Now that we have started mirroring the queries, the backfill of the data from the first cluster can take place. You can use the timestamp from the first entry in the new orders_status_log table to determine the time we started to mirror.

Once the data has been backfilled we can reconfigure ProxySQL to perform all actions on the orders_status_log table on the second cluster. This will be a two step approach: add a new rule to move the read queries to the second cluster’s read servers and except the SELECT … FOR UPDATE queries. Then another one to modify our mirroring query to stop mirroring and only write to the second cluster.

MySQL [(none)]> INSERT INTO mysql_query_rules (rule_id, active, username, schemaname, match_pattern, destination_hostgroup, apply) VALUES (70, 1, 'so_user', 'simple_orders', '^SELECT .* FROM order_status_log', 30, 1), (60, 1, 'so_user', 'simple_orders', '^FROM order_status_log .* FOR UPDATE', 40, 1);
Query OK, 2 rows affected (0.00 sec)
MySQL [(none)]> UPDATE mysql_query_rules SET destination_hostgroup=40, mirror_hostgroup=NULL WHERE rule_id=50;
Query OK, 1 row affected (0.00 sec)

And don’t forget to activate and persist the new query rules:

MySQL [(none)]> LOAD MYSQL QUERY RULES TO RUNTIME;
Query OK, 1 row affected (0.00 sec)
MySQL [(none)]> SAVE MYSQL QUERY RULES TO DISK;
Query OK, 0 rows affected (0.05 sec)

After this final step we should see the workload drop on the first cluster, and increase on the second cluster. Mission possible and accomplished. Happy clustering!

Secure MongoDB and Protect Yourself from the Ransom Hack

$
0
0

In this blogpost we look at the recent concerns around MongoDB ransomware and security issues, and how to mitigate this threat to your own MongoDB instance.

Recently, various security blogs raised concern that a hacker is hijacking MongoDB instances and asking ransom for the data stored. It is not the first time unprotected MongoDB instances have been found vulnerable, and this stirred up the discussion around MongoDB security again.

What is the news about?

About two years ago, the university of Saarland in Germany alerted that they discovered around 40,000 MongoDB servers that were easily accessible on the internet. This meant anyone could open a connection to a MongoDB server via the internet. How did this happen?

Default binding

In the past, the MongoDB daemon bound itself to any interface. This means anyone who has access to any of the interfaces on the host where MongoDB is installed, will be able to connect to MongoDB. If the server is directly connected to a public ip address on one of these interfaces, it may be vulnerable.

Default ports

By default, MongoDB will bind to standard ports: 27017 for MongoDB replicaSets or Shard Routers, 27018 for shards and 27019 for Configservers. By scanning a network for these ports it becomes predictable if a host is running MongoDB.

Authentication

By default, MongoDB configures itself without any form of authentication enabled. This means MongoDB will not prompt for a username and password, and anyone connecting to MongoDB will be able to read and write data. Since MongoDB 2.0 authentication has been part of the product, but never has been part of the default configuration.

Authorization

Part of enabling authorization is the ability to define roles. Without authentication enabled, there will also be no authorization. This means anyone connecting to a MongoDB server without authentication enabled, will have administrative privileges too. Administrative privileges stretches from defining users to configuring MongoDB runtime.

Why is all this an issue now?

In December 2016 a hacker exploited these vulnerabilities for personal enrichment. The hacker steals and removes your data, and leaves the following message in the WARNING collection:

{
     "_id" : ObjectId("5859a0370b8e49f123fcc7da"),
     "mail" : "harak1r1@sigaint.org",
     "note" : "SEND 0.2 BTC TO THIS ADDRESS 13zaxGVjj9MNc2jyvDRhLyYpkCh323MsMq AND CONTACT THIS EMAIL WITH YOUR IP OF YOUR SERVER TO RECOVER YOUR DATABASE !"
}

Demanding 0.2 bitcoins (around $200 at this moment of writing) may not sound like a lot if you really want your data back. However in the meanwhile your website/application is not able to function normally and may be defaced, and this could potentially cost way more than the 0.2 bitcoins.

A MongoDB server is vulnerable when it has a combination of the following:

  • Bound to a public interface
  • Bound to a default port
  • No (or weak) authentication enabled
  • No firewall rules or security groups in place

The default port could be debatable. Any port scanner would also be able to identify MongoDB if it was placed under an obscured port number.

The combination of all four factors means any attacker may be able to connect to the host. Without authentication (and authorization) the attacker can do anything with the MongoDB instance. And even if authentication has been enabled on the MongoDB host, it could still be vulnerable.

Using a network port scanner (e.g. nmap) would reveal the MongoDB build info to the attacker. This means he/she is able to find potential (zero-day) exploits for your specific version, and still manage to compromise your setup. Also weak passwords (e.g. admin/admin) could pose a threat, as the attacker would have an easy point of entry.

How can you protect yourself against this threat?

There are various precautions you can take:

  • Put firewall rules or security groups in place
  • Bind MongoDB only to necessary interfaces and ports
  • Enable authentication, users and roles
  • Backup often
  • Security audits

For new deployments performed from ClusterControl, we enable authentication by default, create a separate administrator user and allow to have MongoDB listen on a different port than the default. The only part ClusterControl can’t setup, is whether the MongoDB instance is available from outside your network.

ClusterControl
Single Console for Your Entire Database Infrastructure
Deploy, manage, monitor, scale your databases on the technology stack of your choice!

Securing MongoDB

The first step to secure your MongoDB server, would be to place firewall rules or security groups in place. These will ensure only the client hosts/applications necessary will be able to connect to MongoDB. Also make sure MongoDB only binds to the interfaces that are really necessary in the mongod.conf:

# network interfaces
net:
      port: 27017
      bindIp : [127.0.0.1,172.16.1.154]

Enabling authentication and setting up users and roles would be the second step. MongoDB has an easy to follow tutorial for enabling authentication and setting up your admin user. Keep in mind that users and passwords are still the weakest link in the chain, and ensure to make those secure!

After securing, you should ensure to always have a backup of your data. Even if the hacker manages to hijack your data, with a backup and big enough oplog you would be able to perform a point-in-time restore. Scheduling (shard consistent) backups can easily be setup in our database clustering, management and automation software called ClusterControl.

Perform security audits often: scan for any open ports from outside your hosting environment. Verify that authentication has been enabled for MongoDB, and ensure the users don’t have weak passwords and/or excessive roles. For ClusterControl we have developed two advisors that will verify all this. ClusterControl advisors are open source, and the advisors can be run for free using ClusterControl community edition.

Will this be enough to protect myself against any threat?

With all these precautions in place, you will be protected against any direct threat from the internet. However keep in mind that any machine compromised in your hosting environment may still become a stepping stone to your now protected MongoDB servers. Be sure to upgrade MongoDB to the latest (patch) releases and be protected against any threat.

How to use the ClusterControl Query Monitor for MySQL, MariaDB and Percona Server

$
0
0

The MySQL database workload is determined by the number of queries that it processes. There are several situations in which MySQL slowness can originate. The first possibility is if there is any queries that are not using proper indexing. When a query cannot make use of an index, the MySQL server has to use more resources and time to process that query. By monitoring queries, you have the ability to pinpoint SQL code that is the root cause of a slowdown.

By default, MySQL provides several built-in tools to monitor queries, namely:

  • Slow Query Log - Captures query that exceeds a defined threshold, or query that does not use indexes.
  • General Query Log - Captures all queries happened in a MySQL server.
  • SHOW FULL PROCESSLIST statement (or through mysqladmin command) - Monitors live queries currently being processed by MySQL server.
  • PERFORMANCE_SCHEMA - Monitors MySQL Server execution at a low level.

There are also open-source tools out there that can achieve similar result like mtop and Percona’s pt-query-digest.

How ClusterControl monitors queries

ClusterControl does not only monitor your hosts and database instances, it also monitors your database queries. It gets the information in two different ways:

  • Queries are retrieved from PERFORMANCE_SCHEMA
  • If PERFORMANCE_SCHEMA is disabled or unavailable, ClusterControl will parse the content of the Slow Query Log

ClusterControl starts reading from the PERFORMANCE_SCHEMA tables immediately when the query monitor is enabled, and the following tables are used by ClusterControl to sample the queries:

  • performance_schema.events_statements_summary_by_digest
  • performance_schema.events_statements_current
  • performance_schema.threads

In older versions of MySQL (5.5), having PERFORMANCE_SCHEMA (P_S) enabled might not be an option since it can cause significant performance degradation. With MySQL 5.6 the overhead is reduced and even more so in 5.7. P_S offers great introspection of the server at an overhead of a few percents (1-3%). If the overhead is a concern then ClusterControl can parse the Slow Query log remotely to sample queries. Note that no agents are required on your database servers. It uses the following flow:

  1. Start slow log (during MySQL runtime).
  2. Run it for a short period of time (a second or couple of seconds).
  3. Stop log.
  4. Parse log.
  5. Truncate log (ClusterControl creates new log file).
  6. Go to 1.

As you can see, ClusterControl does the above trick when pulling and parsing the Slow Query log to overcome the problems with offsets. The drawback of this method is that the continuous sampling might miss some queries during steps 3 to 5. Hence, if continuous query sampling is vital for you and part of your monitoring policy, the best way is to use P_S. If enabled, ClusterControl will automatically use it.

The collected queries are hashed, calculated and digested (normalize, average, count, sort) and then stored in ClusterControl.

Enabling Query Monitoring

As mentioned earlier, ClusterControl monitors MySQL query via two ways:

  • Fetch the queries from PERFORMANCE_SCHEMA
  • Parse the content of MySQL Slow Query

Performance Schema (Recommended)

First of all, if you would like to use Performance Schema, turn it on all MySQL servers (MySQL/MariaDB v5.5.3 and later). Enabling this requires a MySQL restart. Add the following line to your MySQL configuration file:

performance_schema = ON

Then, restart the MySQL server. For ClusterControl users, you can use the configuration management feature at Manage -> Configurations -> Change Parameter and perform a rolling restart at Manage -> Upgrades -> Rolling Restart.

Once enabled, ensure at least events_statements_current is enabled:

mysql> SELECT * FROM performance_schema.setup_consumers WHERE NAME LIKE 'events_statements%';
+--------------------------------+---------+
| NAME                           | ENABLED |
+--------------------------------+---------+
| events_statements_current      | YES     |
| events_statements_history      | NO      |
| events_statements_history_long | NO      |
+--------------------------------+---------+

Otherwise, run the following statement to enable it:

UPDATE performance_schema.setup_consumers SET ENABLED = 'YES' WHERE NAME = 'events_statements_current';

MySQL Slow Query

If Performance Schema is disabled, ClusterControl will then default to the Slow Query log. Hence, you don’t have to do anything since it can be turned on and off dynamically during runtime via SET statement.

The Query Monitoring function must be toggled to on under ClusterControl -> Query Monitor -> Top Queries. ClusterControl will monitor queries on all database nodes under this cluster:

Click on the “Settings” and configure “Long Query Time” and toggle “Log queries not using indexes” to On. If you have defined two parameters (long_query_time and log_queries_not_using_indexes) inside my.cnf and you would like to use those values instead, toggle “MySQL Local Query Override” to On. Otherwise, ClusterControl will obey the former.

Once enabled, you just need to wait a couple of minutes before you can see data under Top Queries and Query Histogram.

How ClusterControl visualizes the queries

Under the Query Monitor tab, you should see the following three items:

  • Top Queries

  • Running Queries

  • Query Histogram

We’ll have a quick look at these here, but remember that you can always find more details in the ClusterControl documentation.

Top Queries

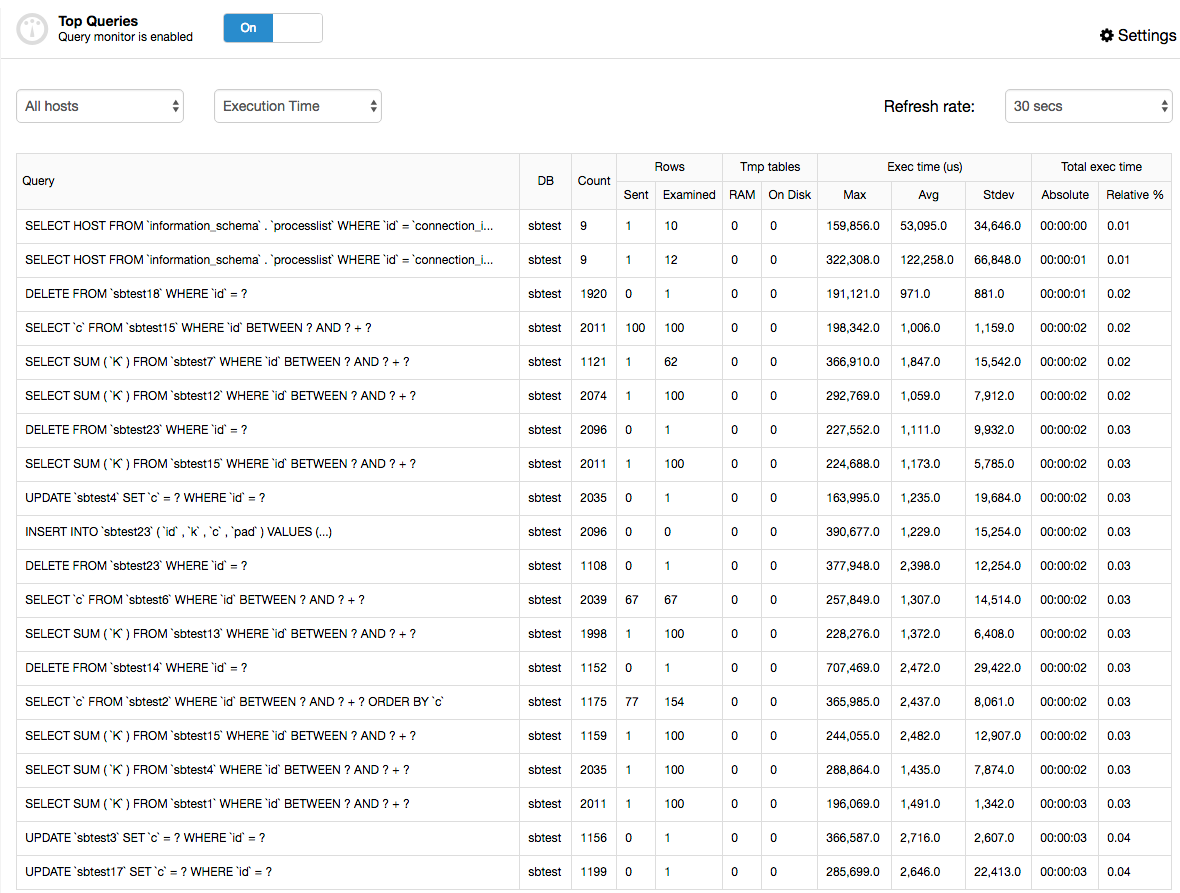
Top Queries is an aggregated list of all your top queries running on all the nodes of your cluster. The list can be ordered by “Occurrence” or “Execution Time”, to show the most common or slowest queries respectively. You don’t have to login to each of the servers to see the top queries. The UI provides an option to filter based on MySQL server.

If you are using the Slow Query log, only queries that exceed the “Long Query Time” will be listed here. If the data is not populated correctly and you believe that there should be something in there, it could be:

  • ClusterControl did not collect enough queries to summarize and populate data. Try to lower the “Long Query Time”.
  • You have configured Slow Query Log configuration options in the my.cnf of MySQL server, and “Override Local Query” is turned off. If you really want to use the value you defined inside my.cnf, probably you have to lower the long_query_time value so ClusterControl can calculate a more accurate result.
  • You have another ClusterControl node pulling the Slow Query log as well (in case you have a standby ClusterControl server). Only allow one ClusterControl server to do this job.

The “Long Query Time” value can be specified to a resolution of microseconds, for example 0.000001 (1 x 10⁻⁶). The following shows a screenshot of what’s under Top Queries:

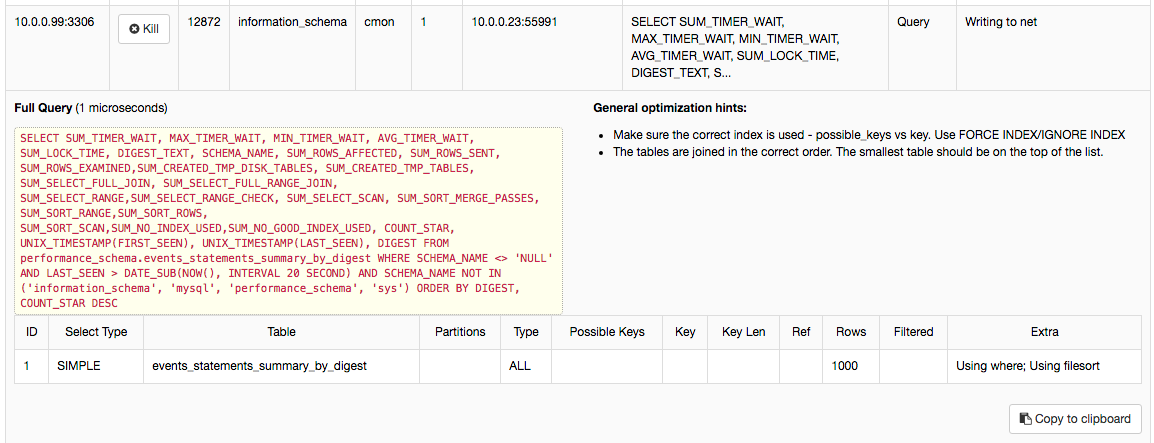
Clicking on each query will show the query plan executed, similar to EXPLAIN command output:

Running Queries

Running Queries provides an aggregated view of current running queries across all nodes in the cluster, similar to SHOW FULL PROCESSLIST command in MySQL. You can stop a running query by selecting to kill the connection that started the query. The process list can be filtered out by host.

Use this feature to monitor live queries currently running on MySQL servers. By clicking on each row that contains “Info”, you can see the extended information containing the full query statement and the query plan:

Query Histogram

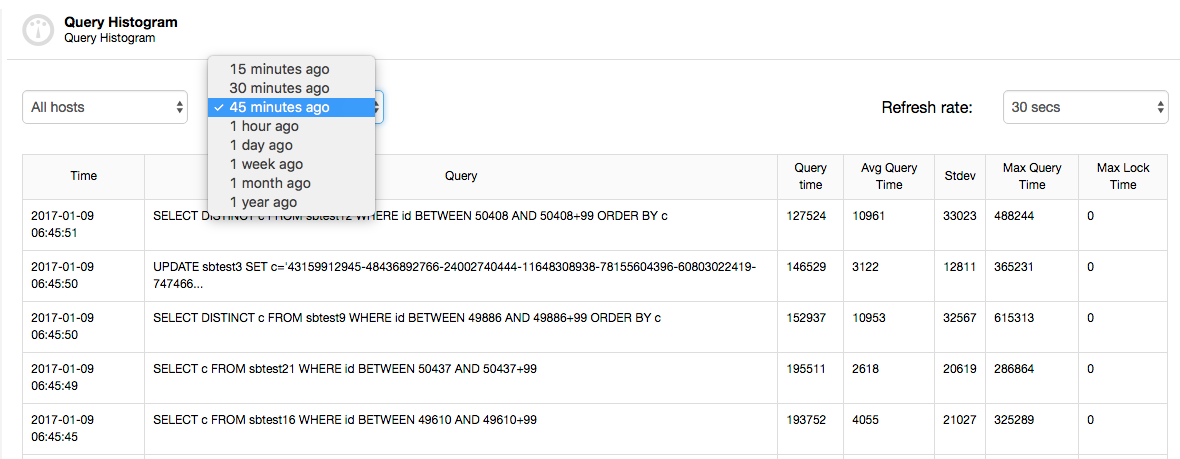
The Query Histogram is actually showing you queries that are outliers. An outlier is a query taking longer time than the normal query of that type. Use this feature to filter out the outliers for a certain time period. This feature is dependent on the Top Queries feature above. If Query Monitoring is enabled and Top Queries are captured and populated, the Query Histogram will summarize these and provide a filter based on timestamp.

That’s all folks! Monitoring queries is as important as monitoring your hosts or MySQL instances, to make sure your database is performing well.

Announcing ClusterControl 1.4 - the MySQL Replication & MongoDB Edition

$
0
0

Today we are pleased to announce the 1.4 release of ClusterControl - the all-inclusive database management system that lets you easily deploy, monitor, manage and scale highly available open source databases in any environment; on-premise or in the cloud.

This release contains key new features for MongoDB and MySQL Replication in particular, along with performance improvements and bug fixes.

Release Highlights

For MySQL

MySQL Replication

  • Enhanced multi-master deployment
  • Flexible topology management & error handling
  • Automated failover

MySQL Replication & Load Balancers

  • Deploy ProxySQL on MySQL Replication setups and monitor performance
  • HAProxy Read-Write split configuration support for MySQL Replication setups

Experimental support for Oracle MySQL Group Replication

  • Deploy Group Replication Clusters

And support for Percona XtraDB Cluster 5.7

Download ClusterControl

For MongoDB

MongoDB & sharded clusters

  • Convert a ReplicaSet to a sharded cluster
  • Add or remove shards
  • Add Mongos/Routers

More MongoDB features

  • Step down or freeze a node
  • New Severalnines database advisors for MongoDB

Download ClusterControl

View release details and resources

ClusterControl
Single Console for Your Entire Database Infrastructure
Find out what else is new in ClusterControl

New MySQL Replication Features

ClusterControl 1.4 brings a number of new features to better support replication users. You are now able to deploy a multi-master replication setup in active - standby mode. One master will actively take writes, while the other one is ready to take over writes should the active master fail. From the UI, you can also easily add slaves under each master and reconfigure the topology by promoting new masters and failing over slaves.

Topology reconfigurations and master failovers are not usually possible in case of replication problems, for instance errant transactions. ClusterControl will check for issues before any failover or switchover happens. The admin can define whitelists and blacklists of which slaves to promote to master (and vice versa). This makes it easier for admins to manage their replication setups and make topology changes when needed. 

Deploy ProxySQL on MySQL Replication clusters and monitor performance

Load balancers are an essential component in database high availability. With this new release, we have extended ClusterControl with the addition of ProxySQL, created for DBAs by René Cannaò, himself a DBA trying to solve issues when working with complex replication topologies. Users can now deploy ProxySQL on MySQL Replication clusters with ClusterControl and monitor its performance.

By default, ClusterControl deploys ProxySQL in read/write split mode - your read-only traffic will be sent to slaves while your writes will be sent to a writable master. ProxySQL will also work together with the new automatic failover mechanism. Once failover happens, ProxySQL will detect the new writable master and route writes to it. It all happens automatically, without any need for the user to take action.

MongoDB & sharded clusters

MongoDB is the rising star of the Open Source databases, and extending our support for this database has brought sharded clusters in addition to replica sets. This meant we had to retrieve more metrics to our monitoring, adding advisors and provide consistent backups for sharding. With this latest release, you can now convert a ReplicaSet cluster to a sharded cluster, add or remove shards from a sharded cluster as well as add Mongos/routers to a sharded cluster.

New Severalnines database advisors for MongoDB

Advisors are mini programs that provide advice on specific database issues and we’ve added three new advisors for MongoDB in this ClusterControl release. The first one calculates the replication window, the second watches over the replication window, and the third checks for un-sharded databases/collections. In addition to this we also added a generic disk advisor. The advisor verifies if any optimizations can be done, like noatime and noop I/O scheduling, on the data disk that is being used for storage.

There are a number of other features and improvements that we have not mentioned here. You can find all details in the ChangeLog.

We encourage you to test this latest release and provide us with your feedback. If you’d like a demo, feel free to request one.

Thank you for your ongoing support, and happy clustering!

PS.: For additional tips & tricks, follow our blog: http://www.severalnines.com/blog/

Join our live webinar on how to scale and shard MongoDB

$
0
0

We’re live next Tuesday, November 15th, with our webinar ‘Become a MongoDB DBA - Scaling and Sharding’!

Join us and learn about the three components necessary for MongoDB sharding. We’ll also share a read scaling considerations checklist as well as tips & tricks for finding the right shard key for MongoDB.

Overall, we’ll discuss how to plan your MongoDB scaling strategy up front and how to prevent ending up with unusable secondary nodes and shards. And we’ll look at how to leverage ClusterControl’s MongoDB scaling and shards management capabilities.

Sign up below!

Date, Time & Registration

Europe/MEA/APAC

Tuesday, November 15th at 09:00 GMT / 10:00 CET (Germany, France, Sweden)
Register Now

North America/LatAm

Tuesday, November 15th at 09:00 Pacific Time (US) / 12:00 Eastern Time (US)
Register Now

Agenda

  • What are the differences in read and write scaling with MongoDB
  • Read scaling considerations with MongoDB
  • MongoDB read preference explained
  • How sharding works in MongoDB
  • Adding new shards and balance data
  • How to scale and shard MongoDB using ClusterControl
  • Live Demo

Speaker

Art van Scheppingen is a Senior Support Engineer at Severalnines. He’s a pragmatic database expert with over 16 years experience in web development. He previously worked at Spil Games as Head of Database Engineering, where he kept a broad vision upon the whole database environment: from MySQL to MongoDB, Vertica to Hadoop and from Sphinx Search to SOLR. He regularly presents his work and projects at various conferences (Percona Live, MongoDB Open House, FOSDEM) and related meetups.

We look forward to “seeing” you there!

This session is based upon the experience we have using MongoDB and implementing it for our database infrastructure management solution, ClusterControl. For more details, read through our ‘Become a MongoDB DBA’ blog series.

We’re keeping the tills ringing at eCommerce platform vidaXL

$
0
0

ClusterControl helps vidaXL compete with the world's largest e-commerce platforms by managing its MongoDB & MySQL databases.

Press Release: everywhere around the world, November 9th 2016 - today we announced vidaXL, an international eCommerce platform where you can “live it up for less”, as our latest customer. ClusterControl was deployed to help manage vidaXL’s polyglot database architecture, which consists of SQL and NoSQL database solutions to handle specific tasks within the enterprise.

vidaXL caters to the product hunters, offering items for inside and outside the home at competitive prices. With a catalogue of currently over 20,000 products to choose from and selling directly in 29 countries, it has a huge task of managing and updating the database its consumers rely on to fulfil their orders. With 200,000 orders monthly, vidaXL is one of the largest international e-retailers.

The eCommerce company is growing and it has an aim of expanding its product catalogue to over 10,000,000 items within the next 12 months. This extremely large selection of goods creates a wealth of new data; images alone in the catalogue create roughly 100 terabytes worth of data, and the products rows between one to two terabytes. The increase of data originally required vidaXL to hire more database administrators (DBAs), but it searched for a cost-effective solution.

ClusterControl was deployed to manage the database systems. As scaling was an issue for vidaXL, particularly the horizontal scaling of its servers, ClusterControl as a single platform replaced the need for a combination of tools and the sometimes unreliable command line control. The ClusterControl deployment took around one week to implement, with no extra support required from Severalnines.

ClusterControl is easily integrated within a polyglot framework, managing different databases with the same efficiency. vidaXL is using several different databases, MongoDB and MySQL for product and customer listings, along with ElasticSearch, for its real-time search capabilities; ClusterControl was plugged in to automate management and give control over scaling of MongoDB and MySQL. The operations team also leveraged it for proactive reporting.

Zeger Knops, Head of Business Technology, vidaXL said, “We’re looking to grow exponentially in the near future with the products we offer and maintain our position as the world’s largest eCommerce operator. This means we cannot suffer any online outages which lead to a loss of revenue. Scaling from thousands to millions of products is a giant leap and that will require us to have a strong infrastructure foundation. Our back-end is reliant on different databases to tackle different tasks. Using several different tools, rather than a one-stop shop, was detrimental to our productivity. Severalnines is that “shop” and we haven’t looked back. It’s an awesome solution like no other.”

Vinay Joosery, Severalnines CEO, added, “As we head towards the busy end of the year for retailers with Cyber Monday just around the corner, a product catalogue of VidaXL’s size requires strong database management skills and technologies. Keeping operations online and supplying people with their required orders is key. We trust that VidaXL will continue to reap the benefits of ClusterControl as it grows.”

About Severalnines

Severalnines provides automation and management software for database clusters. We help companies deploy their databases in any environment, and manage all operational aspects to achieve high-scale availability.

Severalnines' products are used by developers and administrators of all skills levels to provide the full 'deploy, manage, monitor, scale' database cycle, thus freeing them from the complexity and learning curves that are typically associated with highly available database clusters. The company has enabled over 8,000 deployments to date via its popular ClusterControl product. Currently counting BT, Orange, Cisco, CNRS, Technicolor, AVG, Ping Identity and Paytrail as customers. Severalnines is a private company headquartered in Stockholm, Sweden with offices in Singapore and Tokyo, Japan. To see who is using Severalnines today visit, http://www.severalnines.com/company.

We’ve answered Eurofunk’s database SOS call

$
0
0

Eurofunk replaces Oracle with feature-rich Severalnines ClusterControl

Today we’re happy to announce Eurofunk, one of the largest European command centre system specialists, as our latest customer. Severalnines was brought on board to help manage the databases used by European blue light services’ command centres who are responsible for dispatching response teams to emergencies. Eurofunk also provides command centres for well-known car manufacturers.

Eurofunk began operations in 1969 as a sole trader with a focus on consumer electronics and radio technology. It evolved into a crucial component of the emergency services in Europe, responsible for planning, implementing and operating command centres.

To provide efficient blue light services, it is crucial for Eurofunk to have an IT infrastructure which is highly available and fast. Unreliability and slow performance is unforgivable in a sector relying so heavily on speed of execution and directness of action.

Severalnines’ ClusterControl was preferred to Oracle because database speed was improved at a fraction of Oracle’s licensing costs. Eurofunk also experienced database downtime caused by prolonged fail-over times of their Oracle databases. With ClusterControl, it was possible to easily deploy an active/active cluster to reduce downtime scenarios. Galera Cluster for MySQL was chosen as a back-end database replication technology; Severalnines provided the platform to deploy, monitor and manage the back-end cluster and associated database load balancers, along with full enterprise support for the operations team.

Severalnines also helped Eurofunk improve end user experience for dispatchers working in the control centres. Rolling updates to the database layer is possible so emergency services have continuous access to up-to-date information to work with.

Stefan Rehlegger, System Architect, Eurofunk, said, “It’s been hard to find a unified feature-rich database cluster management system in today’s market but we’ve found one that has proved invaluable to our projects. With Severalnines’ help we’ve been able to deploy a centralised system across Europe and we’re planning to expand our usage of ClusterControl to other territories. The deployment via a web interface without any background knowledge of database clustering helps us make services available on a 24h basis more easily. Severalnines also provided great support during systems implementation; it is the database management life-saver for a fast-paced business like ours.”

Vinay Joosery, Severalnines CEO, added, “As an outsider who has watched too many TV shows, working in emergency response looks like the coolest thing to do. In reality the pressure command and control centres are under must be unbearable and to do their work effectively, they need the freshest information on accidents and emergencies. I’m happy to see Severalnines’ technology markedly improve the performance of their systems. Eurofunk keeps people safe and if we can keep their database safe and available, it means they can continue doing the great work they do.”

About Severalnines

Severalnines provides automation and management software for database clusters. We help companies deploy their databases in any environment, and manage all operational aspects to achieve high-scale availability.

Severalnines' products are used by developers and administrators of all skills levels to provide the full 'deploy, manage, monitor, scale' database cycle, thus freeing them from the complexity and learning curves that are typically associated with highly available database clusters. The company has enabled over 8,000 deployments to date via its popular ClusterControl product. Currently counting BT, Orange, Cisco, CNRS, Technicolor, AVG, Ping Identity and Paytrail as customers. Severalnines is a private company headquartered in Stockholm, Sweden with offices in Singapore and Tokyo, Japan. To see who is using Severalnines today visit, http://www.severalnines.com/about-us/company.


Planets9s - Eurofunk replaces Oracle with feature-rich Severalnines ClusterControl

$
0
0

Welcome to this week’s Planets9s, covering all the latest resources and technologies we create around automation and management of open source database infrastructures.

Eurofunk replaces Oracle with feature-rich Severalnines ClusterControl

This week we’re happy to announce Eurofunk, one of the largest European command centre system specialists, as our latest ClusterControl customer. Severalnines was brought on board to help manage the databases used by European blue light services’ command centres who are responsible for dispatching response teams to emergencies. Severalnines’ ClusterControl was preferred to Oracle because database speed was improved at a fraction of Oracle’s licensing costs.

Read the story

Webinar next Tuesday: How to build a stable MySQL Replication environment

If you'd like to learn how to build a stable environment with MySQL replication, this webinar is for you. From OS and DB configuration checklists to schema changes and disaster recovery, you’ll have the information needed. Join us next Tuesday as Krzysztof Książek, Senior Support Engineer at Severalnines, shares his top 9 tips on how to best build a production-ready MySQL Replication environment.

Sign up for the webinar

How to deploy MySQL & MongoDB clusters in the cloud

This blog post describes how you can easily deploy and monitor your favourite open source databases on AWS and DigitalOcean. NinesControl is a service we recently released, which helps you deploy MySQL Galera and MongoDB clusters in the cloud. As a developer, if you want unified and real-time monitoring of your database and server infrastructure with access to 100+ collected key database and host metrics with custom dashboards providing insight to your operational and historic performance … Then NinesControl is for you :-)

Read the blog

That’s it for this week! Feel free to share these resources with your colleagues and follow us in our social media channels.

Have a good end of the week,

Jean-Jérôme Schmidt
Planets9s Editor
Severalnines AB

Tips and Tricks: Receive email notifications from ClusterControl

$
0
0

As sysadmins and DBAs, we need to be notified whenever something critical happens to our database.  But would it not be nicer if we were informed upfront, and still have time to perform pre-emptive maintenance and retain high availability? Being informed about anomalies or anything that may degrade cluster health and performance is key. In this tips and tricks post, we will explain how you can set up email notifications in ClusterControl and stay up to date with your cluster state.

Email notification types in ClusterControl

First we will explain the two types of email notifications that ClusterControl can send. The normal notifications will be sent instantly, once an alert is triggered or an important event occurs. This instant mail type (deliver) is necessary if you wish to immediately receive critical or warning notifications that require swift action.

The other type is called digest, where ClusterControl will accumulate all notifications and then send them each day in a single email on a preset time. Informational and warning notifications, that do not need immediate action can best be sent via the digest email.

Then there is a third option: not to send a notification and ignore the message. This, obviously, should only be configured if you are absolutely certain you don’t wish to receive this type of notification.

Setting up email notifications per user

There are two methods for setting up email notifications in ClusterControl. The below is the first one, where you can set the email notifications on a user level. Go to Settings > Email Notifications.

Here you can select an existing user and load it’s current settings. You can change at what time digest emails are to be sent, and to prevent ClusterControl from sending too many emails, what the limit is for the non-digest emails. Be careful: if you set this too low, you will no longer receive notifications for the remainder of the day! Setting this to -1 sets this to unlimited. Per alarm/event category, the email notifications can be set to the notification type necessary.

Keep in mind that this setting is on a global level, so this accounts for all clusters.

Setting up email notifications per cluster

On the cluster level, the notifications can be set for both users and additional email addresses. This interface can be found via Cluster > Settings > General Settings > Email Notifications.

Here you can select an existing user/email address and load it’s current settings. You can change at what time digest emails are to be sent, and to prevent ClusterControl from sending too many emails, what the limit is for the non-digest emails. Again here, if you set this too low, you will no longer receive notifications for the remainder of the day! Setting this to -1 sets this to unlimited. Per alarm/event category the email notifications can be set to the notification type necessary.

Keep in mind all settings are on a cluster specific level, so this only changes settings for the selected cluster.

Adding and removing email addresses

Apart from defining the email notification settings, you can also add new email addresses by clicking on the plus-button. (+) This can be handy if you wish to send notifications to, for example, a distribution list inside your company.

Removing email addresses can be done, by selecting the email address that needs removal and click the minus-button. (-)

Configuring the mail server

To be able to send email, you need to tell ClusterControl how to send emails. There are two options: via sendmail or via an SMTP server.

When you make use of sendmail, the server where you have installed ClusterControl should have a local command line mail client installed. ClusterControl will send it’s email using the -r option to set the from-address. As sendmail may not deliver your email reliably, the recommended method of sending email would be via SMTP.

If you decide to use an SMTP server instead, you may need to authenticate against this server. Check with your hosting provider if this is required.

Once set in the first cluster, the mail server settings will be carried over to any new cluster created.

Sending a test email

In the Configure Mail Server interface, you can also send a test email. This will create a backend job, that will send an email to all configured recipients for this cluster under Email Notification Settings.

Troubleshooting

If your test email is not arriving and you have set your mail server settings to sendmail, you can check its workings from the ClusterControl host.

CMON log files

You can check your CMON logfiles and see if the email has been sent.

In /var/log/cmon_<clusterid>.log, you should see something similar to this:

2016-12-09 12:44:11 : (INFO) Executing email job.

If you see a log line like this, you may want to increase the daily message limit:

2016-12-09 12:44:47 : (WARNING) Refusing to send more than 10 messages daily to 'mailto://you@yourcompany.com'

As said earlier: if the message limit has been reached, you will no longer receive notifications.

A message about the -r option indicate your mail client does not support the from-header:

2016-12-09 12:44:17 : (WARNING) mail command doesn't support -r SENDER argument, retrying without that.

You can follow this support article to learn how which packages to install.

Sendmail log files

You can also check the local sendmail log files (/var/log/maillog) and see if your email gets delivered. A typical sendmail connection flow looks like the following:

Dec  9 17:36:41 localhost sendmail[24529]: uB9HafLM024529: from=clustercontrol@yourcompany.com, size=326, class=0, nrcpts=1, msgid=<584aeba9.9LBxfOatDgnTC+vm%clustercontrol@yourcompany.com>, relay=root@localhost
Dec  9 17:36:41 localhost postfix/smtpd[24530]: connect from n1[127.0.0.1]
Dec  9 17:36:41 localhost postfix/smtpd[24530]: 2C0AF4094CF9: client=n1[127.0.0.1]
Dec  9 17:36:41 localhost postfix/cleanup[24533]: 2C0AF4094CF9: message-id=<584aeba9.9LBxfOatDgnTC+vm%clustercontrol@yourcompany.com>
Dec  9 17:36:41 localhost sendmail[24529]: uB9HafLM024529: to=you@yourcompany.com, ctladdr=clustercontrol@yourcompany.com (0/0), delay=00:00:00, xdelay=00:00:00, mailer=relay, pri=30326, relay=[127.0.0.1] [127.0.0.1], dsn=2.0.0, stat=Sent (Ok: queued as 2C0AF4094CF9)
Dec  9 17:36:41 localhost postfix/qmgr[1256]: 2C0AF4094CF9: from=<clustercontrol@yourcompany.com>, size=669, nrcpt=1 (queue active)
Dec  9 17:36:41 localhost postfix/smtpd[24530]: disconnect from n1[127.0.0.1]
Dec  9 17:36:41 localhost postfix/smtp[24534]: 2C0AF4094CF9: to=<you@yourcompany.com>, relay=mail.yourcompany.com[94.142.240.10]:25, delay=0.38, delays=0.05/0.02/0.08/0.24, dsn=2.0.0, status=sent (250 OK id=1cFP69-0002Ns-Db)

If these entries are not to be found inside the log file, you can increase the loglevel of Sendmail.

Command line email

A final check would be to run the mail command and see if that arrives:

echo "test message" | mail -r youremail@yourcompany.com -s "test subject" youremail@yourcompany.com

If the message from the command line arrives, but the ClusterControl message does not, it may be related to not having set the from-email address in ClusterControl. ClusterControl will then send the email from the default user on the system. If the hostname is not properly set on the ClusterControl host to a fully qualified domain name, this may result in your email server not accepting any emails by an unqualified domain name, or non-existing user.

We hope these tips help you configure notifications in ClusterControl.

Planets9s - Download our new DevOps Guide to Database Backups for MariaDB & MySQL

$
0
0

Welcome to this week’s Planets9s, covering all the latest resources and technologies we create around automation and management of open source database infrastructures.

Download our new DevOps Guide to Database Backups for MariaDB & MySQL

Check out our free whitepaper on database backups, which discusses in detail the two most popular backup utilities available for MySQL and MariaDB, namely mysqldump and Percona XtraBackup. If you’re looking for insight into how to perform database backups efficiently or the impact of Storage Engine on MySQL or MariaDB backup procedures, need some tips & tricks on MySQL / MariaDB backup management … our new DevOps Guide has you covered.

Download the whitepaper

Tips and Tricks: Receive email notifications from ClusterControl

Did you know that apart from receiving notifications when things go wrong, you can also receive digest emails for less critical notifications from ClusterControl? As SysAdmins and DBAs, we need to be notified whenever something critical happens to our database. But would it not be nicer if we were informed upfront, and still had time to perform pre-emptive maintenance and retain high availability?  With this new blog post, find out how to enable and set up your email notifications in ClusterControl according to your needs.

Read the blog

Getting social with Severalnines

As we begin to wrap up 2016 and look towards and plan all the exciting things for next year, we wanted to take a moment to encourage you to follow and engage with us on our social channels. We produce plenty of content and have a lot more planned for 2017. To ensure that you don’t miss out on any of it, we’d love it if you would follow us so we can better keep you up to date and interact more directly with you.

Get social

That’s it for this week! Feel free to share these resources with your colleagues and follow us in our social media channels.

Have a good end of the week,

Jean-Jérôme Schmidt
Planets9s Editor
Severalnines AB

Tips and Tricks - How to shard MySQL with ProxySQL in ClusterControl

$
0
0

Having too large a (write) workload on a master is dangerous. If the master collapses and a failover happens to one of its slave nodes, the slave node could collapse under the write pressure as well. To mitigate this problem you can shard horizontally across more nodes.

Sharding increases the complexity of data storage though, and very often, it requires an overhaul of the application. In some cases, it may be impossible to make changes to an application. Luckily there is a simpler solution: functional sharding. With functional sharding you move a schema or table to another master, and thus alleviating the master from the workload of these schemas or tables.

In this Tips & Tricks post, we will explain how you can functionally shard your existing master, and offload some workload to another master using functional sharding. We will use ClusterControl, MySQL replication and ProxySQL to make this happen, and the total time taken should not be longer than 15 minutes in total. Mission impossible? :-)

The example database

In our example we have a serious issue with the workload on our simple order database, accessed by the so_user. The majority of the writes are happening on two tables: orders and order_status_log. Every change to an order will write to both the order table and the status log table.

CREATE TABLE `orders` (
  `id` int(11) NOT NULL AUTO_INCREMENT,
  `customer_id` int(11) NOT NULL,
  `status` varchar(14) DEFAULT 'created',
  `total_vat` decimal(15,2) DEFAULT '0.00',
  `total` decimal(15,2) DEFAULT '0.00',
  `created` timestamp NOT NULL DEFAULT CURRENT_TIMESTAMP,
  `updated` timestamp NOT NULL DEFAULT CURRENT_TIMESTAMP ON UPDATE CURRENT_TIMESTAMP,
  PRIMARY KEY (`id`)
) ENGINE=InnoDB DEFAULT CHARSET=utf8;
CREATE TABLE `order_status_log` (
  `orderId` int(11) NOT NULL,
  `status` varchar(14) DEFAULT 'created',
  `changeTime` timestamp NOT NULL DEFAULT CURRENT_TIMESTAMP,
  `logline` text,
  PRIMARY KEY (`orderId`, `status`, `changeTime` )
) ENGINE=InnoDB DEFAULT CHARSET=utf8;
CREATE TABLE `customers` (
  `id` int(11) NOT NULL AUTO_INCREMENT,
  `firstname` varchar(15) NOT NULL,
  `surname` varchar(80) NOT NULL,
  `address` varchar(255) NOT NULL,
  `postalcode` varchar(6) NOT NULL,
  `city` varchar(50) NOT NULL,
  `state` varchar(50) NOT NULL,
  `country` varchar(50) NOT NULL,
  PRIMARY KEY (`id`)
) ENGINE=InnoDB DEFAULT CHARSET=utf8;

What we will do is to move the order_status_log table to another master.

As you might have noticed, there is no foreign key defined on the order_status_log table. This simply would not work across functional shards. Joining the order_status_log table with any other table would simply no longer work as it will be physically on a different server than the other tables. And if you write transactional data to multiple tables, the rollback will only work for one of these masters. If you wish to retain these things, you should consider to use homogenous sharding instead where you keep related data grouped together in the same shard.

Installing the Replication setups

First, we will install a replication setup in ClusterControl. The topology in our example is really basic: we deploy one master and one replica:

But you could import your own existing replication topology into ClusterControl as well.

After the setup has been deployed, deploy the second setup:

While waiting for the second setup to be deployed, we will add ProxySQL to the first replication setup:

Adding the second setup to ProxySQL

After ProxySQL has been deployed we can connect with it via command line, and see it’s current configured servers and settings:

MySQL [(none)]> select hostgroup_id, hostname, port, status, comment from mysql_servers;
+--------------+-------------+------+--------+-----------------------+
| hostgroup_id | hostname    | port | status | comment               |
+--------------+-------------+------+--------+-----------------------+
| 20           | 10.10.36.11 | 3306 | ONLINE | read server           |
| 20           | 10.10.36.12 | 3306 | ONLINE | read server           |
| 10           | 10.10.36.11 | 3306 | ONLINE | read and write server |
+--------------+-------------+------+--------+-----------------------+
MySQL [(none)]> select rule_id, active, username, schemaname, match_pattern, destination_hostgroup from mysql_query_rules;
+---------+--------+----------+------------+---------------------------------------------------------+-----------------------+
| rule_id | active | username | schemaname | match_pattern                                           | destination_hostgroup |
+---------+--------+----------+------------+---------------------------------------------------------+-----------------------+
| 100     | 1      | NULL     | NULL       | ^SELECT .* FOR UPDATE                                   | 10                    |
| 200     | 1      | NULL     | NULL       | ^SELECT .*                                              | 20                    |
| 300     | 1      | NULL     | NULL       | .*                                                      | 10                    |
+---------+--------+----------+------------+---------------------------------------------------------+-----------------------+

As you can see, ProxySQL has been configured with the ClusterControl default read/write splitter for our first cluster. Any basic select query will be routed to hostgroup 20 (read pool) while all other queries will be routed to hostgroup 10 (master). What is missing here is the information about the second cluster, so we will add the hosts of the second cluster first:

MySQL [(none)]> INSERT INTO mysql_servers VALUES (30, '10.10.36.13', 3306, 'ONLINE', 1, 0, 100, 10, 0, 0, 'Second repl setup read server'), (30, '10.10.36.14', 3306, 'ONLINE', 1, 0, 100, 10, 0, 0, 'Second repl setup read server');
Query OK, 2 rows affected (0.00 sec) 
MySQL [(none)]> INSERT INTO mysql_servers VALUES (40, '10.10.36.13', 3306, 'ONLINE', 1, 0, 100, 10, 0, 0, 'Second repl setup read and write server');
Query OK, 1 row affected (0.00 sec)

After this we need to load the servers to ProxySQL runtime tables and store the configuration to disk:

MySQL [(none)]> LOAD MYSQL SERVERS TO RUNTIME;
Query OK, 0 rows affected (0.00 sec)
MySQL [(none)]> SAVE MYSQL SERVERS TO DISK;
Query OK, 0 rows affected (0.01 sec)

As ProxySQL is doing the authentication for the clients as well, we need to add the os_user user to ProxySQL to allow the application to connect through ProxySQL:

MySQL [(none)]> INSERT INTO mysql_users (username, password, active, default_hostgroup, default_schema) VALUES ('so_user', 'so_pass', 1, 10, 'simple_orders');
Query OK, 1 row affected (0.00 sec)
MySQL [(none)]> LOAD MYSQL USERS TO RUNTIME;
Query OK, 0 rows affected (0.00 sec)
MySQL [(none)]> SAVE MYSQL USERS TO DISK;
Query OK, 0 rows affected (0.00 sec)

Now we have added the second cluster and user to ProxySQL. Keep in mind that normally in ClusterControl the two clusters are considered two separate entities. ProxySQL will remain part of the first cluster. Even though it is now configured for the second cluster, it will only be displayed under the first cluster,.

Mirroring the data

Keep in mind that mirroring queries in ProxySQL is still a beta feature, and it doesn’t guarantee the mirrored queries will actually be executed. We have found it working fine within the boundaries of this use case. Also there are (better) alternatives to our example here, where you would make use of a restored backup on the new cluster and replicate from the master until you make the switch. We will describe this scenario in a follow up Tips & Tricks blog post.

Now that we have added the second cluster, we need to create the simple_orders database, the order_status_log table and the appropriate users on the master of the second cluster:

mysql> create database simple_orders;
Query OK, 1 row affected (0.01 sec)
mysql> use simple_orders;
Database changed
mysql> CREATE TABLE `order_status_log` (
  `orderId` int(11) NOT NULL,
  `status` varchar(14) DEFAULT 'created',
  `changeTime` timestamp NOT NULL DEFAULT CURRENT_TIMESTAMP,
  `logline` text,
  PRIMARY KEY (`orderId`, `status`, `changeTime` )
) ENGINE=InnoDB DEFAULT CHARSET=utf8;
Query OK, 0 rows affected (0.00 sec)
mysql> create user 'so_user'@'10.10.36.15' identified by 'so_pass';
Query OK, 0 rows affected (0.00 sec)
mysql> grant select, update, delete, insert on simple_orders.* to 'so_user'@'10.10.36.15';
Query OK, 0 rows affected (0.00 sec)

This enables us to start mirroring the queries executed against the first cluster onto the second cluster. This requires an additional query rule to be defined in ProxySQL:

MySQL [(none)]> INSERT INTO mysql_query_rules (rule_id, active, username, schemaname, match_pattern, destination_hostgroup, mirror_hostgroup, apply) VALUES (50, 1, 'so_user', 'simple_orders', '(^INSERT INTO|^REPLACE INTO|^UPDATE|INTO TABLE) order_status_log', 20, 40, 1);
Query OK, 1 row affected (0.00 sec)
MySQL [(none)]> LOAD MYSQL QUERY RULES TO RUNTIME;
Query OK, 1 row affected (0.00 sec)

In this rule ProxySQL will match everything that is writing to the orders_status_log table, and send it in addition to the hostgroup 40. (write server of the second cluster)

Now that we have started mirroring the queries, the backfill of the data from the first cluster can take place. You can use the timestamp from the first entry in the new orders_status_log table to determine the time we started to mirror.

Once the data has been backfilled we can reconfigure ProxySQL to perform all actions on the orders_status_log table on the second cluster. This will be a two step approach: add a new rule to move the read queries to the second cluster’s read servers and except the SELECT … FOR UPDATE queries. Then another one to modify our mirroring query to stop mirroring and only write to the second cluster.

MySQL [(none)]> INSERT INTO mysql_query_rules (rule_id, active, username, schemaname, match_pattern, destination_hostgroup, apply) VALUES (70, 1, 'so_user', 'simple_orders', '^SELECT .* FROM order_status_log', 30, 1), (60, 1, 'so_user', 'simple_orders', '^FROM order_status_log .* FOR UPDATE', 40, 1);
Query OK, 2 rows affected (0.00 sec)
MySQL [(none)]> UPDATE mysql_query_rules SET destination_hostgroup=40, mirror_hostgroup=NULL WHERE rule_id=50;
Query OK, 1 row affected (0.00 sec)

And don’t forget to activate and persist the new query rules:

MySQL [(none)]> LOAD MYSQL QUERY RULES TO RUNTIME;
Query OK, 1 row affected (0.00 sec)
MySQL [(none)]> SAVE MYSQL QUERY RULES TO DISK;
Query OK, 0 rows affected (0.05 sec)

After this final step we should see the workload drop on the first cluster, and increase on the second cluster. Mission possible and accomplished. Happy clustering!

Secure MongoDB and Protect Yourself from the Ransom Hack

$
0
0

In this blogpost we look at the recent concerns around MongoDB ransomware and security issues, and how to mitigate this threat to your own MongoDB instance.

Recently, various security blogs raised concern that a hacker is hijacking MongoDB instances and asking ransom for the data stored. It is not the first time unprotected MongoDB instances have been found vulnerable, and this stirred up the discussion around MongoDB security again.

What is the news about?

About two years ago, the university of Saarland in Germany alerted that they discovered around 40,000 MongoDB servers that were easily accessible on the internet. This meant anyone could open a connection to a MongoDB server via the internet. How did this happen?

Default binding

In the past, the MongoDB daemon bound itself to any interface. This means anyone who has access to any of the interfaces on the host where MongoDB is installed, will be able to connect to MongoDB. If the server is directly connected to a public ip address on one of these interfaces, it may be vulnerable.

Default ports

By default, MongoDB will bind to standard ports: 27017 for MongoDB replicaSets or Shard Routers, 27018 for shards and 27019 for Configservers. By scanning a network for these ports it becomes predictable if a host is running MongoDB.

Authentication

By default, MongoDB configures itself without any form of authentication enabled. This means MongoDB will not prompt for a username and password, and anyone connecting to MongoDB will be able to read and write data. Since MongoDB 2.0 authentication has been part of the product, but never has been part of the default configuration.

Authorization

Part of enabling authorization is the ability to define roles. Without authentication enabled, there will also be no authorization. This means anyone connecting to a MongoDB server without authentication enabled, will have administrative privileges too. Administrative privileges stretches from defining users to configuring MongoDB runtime.

Why is all this an issue now?

In December 2016 a hacker exploited these vulnerabilities for personal enrichment. The hacker steals and removes your data, and leaves the following message in the WARNING collection:

{"_id" : ObjectId("5859a0370b8e49f123fcc7da"),"mail" : "harak1r1@sigaint.org","note" : "SEND 0.2 BTC TO THIS ADDRESS 13zaxGVjj9MNc2jyvDRhLyYpkCh323MsMq AND CONTACT THIS EMAIL WITH YOUR IP OF YOUR SERVER TO RECOVER YOUR DATABASE !"
}

Demanding 0.2 bitcoins (around $200 at this moment of writing) may not sound like a lot if you really want your data back. However in the meanwhile your website/application is not able to function normally and may be defaced, and this could potentially cost way more than the 0.2 bitcoins.

A MongoDB server is vulnerable when it has a combination of the following:

  • Bound to a public interface
  • Bound to a default port
  • No (or weak) authentication enabled
  • No firewall rules or security groups in place

The default port could be debatable. Any port scanner would also be able to identify MongoDB if it was placed under an obscured port number.

The combination of all four factors means any attacker may be able to connect to the host. Without authentication (and authorization) the attacker can do anything with the MongoDB instance. And even if authentication has been enabled on the MongoDB host, it could still be vulnerable.

Using a network port scanner (e.g. nmap) would reveal the MongoDB build info to the attacker. This means he/she is able to find potential (zero-day) exploits for your specific version, and still manage to compromise your setup. Also weak passwords (e.g. admin/admin) could pose a threat, as the attacker would have an easy point of entry.

How can you protect yourself against this threat?

There are various precautions you can take:

  • Put firewall rules or security groups in place
  • Bind MongoDB only to necessary interfaces and ports
  • Enable authentication, users and roles
  • Backup often
  • Security audits

For new deployments performed from ClusterControl, we enable authentication by default, create a separate administrator user and allow to have MongoDB listen on a different port than the default. The only part ClusterControl can’t setup, is whether the MongoDB instance is available from outside your network.

ClusterControl
Single Console for Your Entire Database Infrastructure
Deploy, manage, monitor, scale your databases on the technology stack of your choice!

Securing MongoDB

The first step to secure your MongoDB server, would be to place firewall rules or security groups in place. These will ensure only the client hosts/applications necessary will be able to connect to MongoDB. Also make sure MongoDB only binds to the interfaces that are really necessary in the mongod.conf:

# network interfaces
net:
      port: 27017
      bindIp : [127.0.0.1,172.16.1.154]

Enabling authentication and setting up users and roles would be the second step. MongoDB has an easy to follow tutorial for enabling authentication and setting up your admin user. Keep in mind that users and passwords are still the weakest link in the chain, and ensure to make those secure!

After securing, you should ensure to always have a backup of your data. Even if the hacker manages to hijack your data, with a backup and big enough oplog you would be able to perform a point-in-time restore. Scheduling (shard consistent) backups can easily be setup in our database clustering, management and automation software called ClusterControl.

Perform security audits often: scan for any open ports from outside your hosting environment. Verify that authentication has been enabled for MongoDB, and ensure the users don’t have weak passwords and/or excessive roles. For ClusterControl we have developed two advisors that will verify all this. ClusterControl advisors are open source, and the advisors can be run for free using ClusterControl community edition.

Will this be enough to protect myself against any threat?

With all these precautions in place, you will be protected against any direct threat from the internet. However keep in mind that any machine compromised in your hosting environment may still become a stepping stone to your now protected MongoDB servers. Be sure to upgrade MongoDB to the latest (patch) releases and be protected against any threat.

How to use the ClusterControl Query Monitor for MySQL, MariaDB and Percona Server

$
0
0

The MySQL database workload is determined by the number of queries that it processes. There are several situations in which MySQL slowness can originate. The first possibility is if there is any queries that are not using proper indexing. When a query cannot make use of an index, the MySQL server has to use more resources and time to process that query. By monitoring queries, you have the ability to pinpoint SQL code that is the root cause of a slowdown.

By default, MySQL provides several built-in tools to monitor queries, namely:

  • Slow Query Log - Captures query that exceeds a defined threshold, or query that does not use indexes.
  • General Query Log - Captures all queries happened in a MySQL server.
  • SHOW FULL PROCESSLIST statement (or through mysqladmin command) - Monitors live queries currently being processed by MySQL server.
  • PERFORMANCE_SCHEMA - Monitors MySQL Server execution at a low level.

There are also open-source tools out there that can achieve similar result like mtop and Percona’s pt-query-digest.

How ClusterControl monitors queries

ClusterControl does not only monitor your hosts and database instances, it also monitors your database queries. It gets the information in two different ways:

  • Queries are retrieved from PERFORMANCE_SCHEMA
  • If PERFORMANCE_SCHEMA is disabled or unavailable, ClusterControl will parse the content of the Slow Query Log

ClusterControl starts reading from the PERFORMANCE_SCHEMA tables immediately when the query monitor is enabled, and the following tables are used by ClusterControl to sample the queries:

  • performance_schema.events_statements_summary_by_digest
  • performance_schema.events_statements_current
  • performance_schema.threads

In older versions of MySQL (5.5), having PERFORMANCE_SCHEMA (P_S) enabled might not be an option since it can cause significant performance degradation. With MySQL 5.6 the overhead is reduced and even more so in 5.7. P_S offers great introspection of the server at an overhead of a few percents (1-3%). If the overhead is a concern then ClusterControl can parse the Slow Query log remotely to sample queries. Note that no agents are required on your database servers. It uses the following flow:

  1. Start slow log (during MySQL runtime).
  2. Run it for a short period of time (a second or couple of seconds).
  3. Stop log.
  4. Parse log.
  5. Truncate log (ClusterControl creates new log file).
  6. Go to 1.

As you can see, ClusterControl does the above trick when pulling and parsing the Slow Query log to overcome the problems with offsets. The drawback of this method is that the continuous sampling might miss some queries during steps 3 to 5. Hence, if continuous query sampling is vital for you and part of your monitoring policy, the best way is to use P_S. If enabled, ClusterControl will automatically use it.

The collected queries are hashed, calculated and digested (normalize, average, count, sort) and then stored in ClusterControl.

Enabling Query Monitoring

As mentioned earlier, ClusterControl monitors MySQL query via two ways:

  • Fetch the queries from PERFORMANCE_SCHEMA
  • Parse the content of MySQL Slow Query

Performance Schema (Recommended)

First of all, if you would like to use Performance Schema, turn it on all MySQL servers (MySQL/MariaDB v5.5.3 and later). Enabling this requires a MySQL restart. Add the following line to your MySQL configuration file:

performance_schema = ON

Then, restart the MySQL server. For ClusterControl users, you can use the configuration management feature at Manage -> Configurations -> Change Parameter and perform a rolling restart at Manage -> Upgrades -> Rolling Restart.

Once enabled, ensure at least events_statements_current is enabled:

mysql> SELECT * FROM performance_schema.setup_consumers WHERE NAME LIKE 'events_statements%';
+--------------------------------+---------+
| NAME                           | ENABLED |
+--------------------------------+---------+
| events_statements_current      | YES     |
| events_statements_history      | NO      |
| events_statements_history_long | NO      |
+--------------------------------+---------+

Otherwise, run the following statement to enable it:

UPDATE performance_schema.setup_consumers SET ENABLED = 'YES' WHERE NAME = 'events_statements_current';

MySQL Slow Query

If Performance Schema is disabled, ClusterControl will then default to the Slow Query log. Hence, you don’t have to do anything since it can be turned on and off dynamically during runtime via SET statement.

The Query Monitoring function must be toggled to on under ClusterControl -> Query Monitor -> Top Queries. ClusterControl will monitor queries on all database nodes under this cluster:

Click on the “Settings” and configure “Long Query Time” and toggle “Log queries not using indexes” to On. If you have defined two parameters (long_query_time and log_queries_not_using_indexes) inside my.cnf and you would like to use those values instead, toggle “MySQL Local Query Override” to On. Otherwise, ClusterControl will obey the former.

Once enabled, you just need to wait a couple of minutes before you can see data under Top Queries and Query Histogram.

How ClusterControl visualizes the queries

Under the Query Monitor tab, you should see the following three items:

  • Top Queries

  • Running Queries

  • Query Histogram

We’ll have a quick look at these here, but remember that you can always find more details in the ClusterControl documentation.

Top Queries

Top Queries is an aggregated list of all your top queries running on all the nodes of your cluster. The list can be ordered by “Occurrence” or “Execution Time”, to show the most common or slowest queries respectively. You don’t have to login to each of the servers to see the top queries. The UI provides an option to filter based on MySQL server.

If you are using the Slow Query log, only queries that exceed the “Long Query Time” will be listed here. If the data is not populated correctly and you believe that there should be something in there, it could be:

  • ClusterControl did not collect enough queries to summarize and populate data. Try to lower the “Long Query Time”.
  • You have configured Slow Query Log configuration options in the my.cnf of MySQL server, and “Override Local Query” is turned off. If you really want to use the value you defined inside my.cnf, probably you have to lower the long_query_time value so ClusterControl can calculate a more accurate result.
  • You have another ClusterControl node pulling the Slow Query log as well (in case you have a standby ClusterControl server). Only allow one ClusterControl server to do this job.

The “Long Query Time” value can be specified to a resolution of microseconds, for example 0.000001 (1 x 10⁻⁶). The following shows a screenshot of what’s under Top Queries:

Clicking on each query will show the query plan executed, similar to EXPLAIN command output:

Running Queries

Running Queries provides an aggregated view of current running queries across all nodes in the cluster, similar to SHOW FULL PROCESSLIST command in MySQL. You can stop a running query by selecting to kill the connection that started the query. The process list can be filtered out by host.

Use this feature to monitor live queries currently running on MySQL servers. By clicking on each row that contains “Info”, you can see the extended information containing the full query statement and the query plan:

Query Histogram

The Query Histogram is actually showing you queries that are outliers. An outlier is a query taking longer time than the normal query of that type. Use this feature to filter out the outliers for a certain time period. This feature is dependent on the Top Queries feature above. If Query Monitoring is enabled and Top Queries are captured and populated, the Query Histogram will summarize these and provide a filter based on timestamp.

That’s all folks! Monitoring queries is as important as monitoring your hosts or MySQL instances, to make sure your database is performing well.

Announcing ClusterControl 1.4 - the MySQL Replication & MongoDB Edition

$
0
0

Today we are pleased to announce the 1.4 release of ClusterControl - the all-inclusive database management system that lets you easily deploy, monitor, manage and scale highly available open source databases in any environment; on-premise or in the cloud.

This release contains key new features for MongoDB and MySQL Replication in particular, along with performance improvements and bug fixes.

Release Highlights

For MySQL

MySQL Replication

  • Enhanced multi-master deployment
  • Flexible topology management & error handling
  • Automated failover

MySQL Replication & Load Balancers

  • Deploy ProxySQL on MySQL Replication setups and monitor performance
  • HAProxy Read-Write split configuration support for MySQL Replication setups

Experimental support for Oracle MySQL Group Replication

  • Deploy Group Replication Clusters

And support for Percona XtraDB Cluster 5.7

Download ClusterControl

For MongoDB

MongoDB & sharded clusters

  • Convert a ReplicaSet to a sharded cluster
  • Add or remove shards
  • Add Mongos/Routers

More MongoDB features

  • Step down or freeze a node
  • New Severalnines database advisors for MongoDB

Download ClusterControl

View release details and resources

ClusterControl
Single Console for Your Entire Database Infrastructure
Find out what else is new in ClusterControl

New MySQL Replication Features

ClusterControl 1.4 brings a number of new features to better support replication users. You are now able to deploy a multi-master replication setup in active - standby mode. One master will actively take writes, while the other one is ready to take over writes should the active master fail. From the UI, you can also easily add slaves under each master and reconfigure the topology by promoting new masters and failing over slaves.

Topology reconfigurations and master failovers are not usually possible in case of replication problems, for instance errant transactions. ClusterControl will check for issues before any failover or switchover happens. The admin can define whitelists and blacklists of which slaves to promote to master (and vice versa). This makes it easier for admins to manage their replication setups and make topology changes when needed. 

Deploy ProxySQL on MySQL Replication clusters and monitor performance

Load balancers are an essential component in database high availability. With this new release, we have extended ClusterControl with the addition of ProxySQL, created for DBAs by René Cannaò, himself a DBA trying to solve issues when working with complex replication topologies. Users can now deploy ProxySQL on MySQL Replication clusters with ClusterControl and monitor its performance.

By default, ClusterControl deploys ProxySQL in read/write split mode - your read-only traffic will be sent to slaves while your writes will be sent to a writable master. ProxySQL will also work together with the new automatic failover mechanism. Once failover happens, ProxySQL will detect the new writable master and route writes to it. It all happens automatically, without any need for the user to take action.

MongoDB & sharded clusters

MongoDB is the rising star of the Open Source databases, and extending our support for this database has brought sharded clusters in addition to replica sets. This meant we had to retrieve more metrics to our monitoring, adding advisors and provide consistent backups for sharding. With this latest release, you can now convert a ReplicaSet cluster to a sharded cluster, add or remove shards from a sharded cluster as well as add Mongos/routers to a sharded cluster.

New Severalnines database advisors for MongoDB

Advisors are mini programs that provide advice on specific database issues and we’ve added three new advisors for MongoDB in this ClusterControl release. The first one calculates the replication window, the second watches over the replication window, and the third checks for un-sharded databases/collections. In addition to this we also added a generic disk advisor. The advisor verifies if any optimizations can be done, like noatime and noop I/O scheduling, on the data disk that is being used for storage.

There are a number of other features and improvements that we have not mentioned here. You can find all details in the ChangeLog.

We encourage you to test this latest release and provide us with your feedback. If you’d like a demo, feel free to request one.

Thank you for your ongoing support, and happy clustering!

PS.: For additional tips & tricks, follow our blog: http://www.severalnines.com/blog/


Watch the evolution of ClusterControl for MySQL & MongoDB

$
0
0

ClusterControl reduces complexity of managing your database infrastructure on premise or in the cloud, while adding support for new technologies; enabling you to truly automate mixed environments for next-level applications.

Since the launch of ClusterControl in 2012, we’ve experienced growth in new industries with customers who are benefiting from the advancements ClusterControl has to offer.

In addition to reaching new highs in ClusterControl demand, this past year we’ve doubled the size of our team allowing us to continue to provide even more improvements to ClusterControl.

Watch this short video to see where ClusterControl stands today.

New MongoDB features in ClusterControl 1.4

$
0
0

Our latest release of ClusterControl turns some of the most troublesome MongoDB tasks into a mere 15 second job. New features have been added to give you more control over your cluster and perform topology changes:

  • Convert a MongoDB replicaSet to a sharded MongoDB Cluster
  • Add and remove shards
  • Add shard routers to a sharded MongoDB cluster
  • Step down or freeze a node
  • New MongoDB advisors

We will describe these added features in depth below.

Convert a MongoDB replicaSet to a sharded MongoDB cluster

As most MongoDB users will start off with a replicaSet to store their database, this is the most frequently used type of cluster. If you happen to run into scaling issues you can scale this replicaSet by either adding more secondaries or scaling out by sharding. You can convert an existing replicaSet into a sharded cluster, however this is a long process where you could easily make errors. In ClusterControl we have automated this process, where we automatically add the Configservers, shard routers and enable sharding.

To convert a replicaSet into a sharded cluster, you can simply trigger it via the actions drop down:

This will open up a two step dialogue on how to convert this into a shard. The first step is to define where to deploy the Configserver and shard routers to:

The second step is where to store the data and which config files should be used for the Configserver and shard router.

After the shard migration job has finished, the cluster overview now displays shards instead of replicaSet instances:

After converting to a sharded cluster, new shards can be added.

Add or remove shards from a sharded MongoDB cluster

Adding shards

As a MongoDB shard is technically a replicaSet, adding a new shard involves the deployment of a new replicaSet as well. Within ClusterControl we first deploy a new replicaSet and then add it to the sharded cluster.

From the ClusterControl UI, you can easily add new shards with a two step wizard, opened from the actions drop down:

Here you can define the topology of the new shard.

Once the new shard has been added to the cluster, the MongoDB shard router will start to assign new chunks to it, and the balancer will automatically balance all chunks over all the shards.

Removing shards

Removing shards is a bit harder than to add a shard, as this involves moving the data to the other shards before removing the shard itself. For all data that has been sharded over all shards, this will be a job performed by the MongoDB balancer.

However any non-sharded database/collection, that was assigned this shard as its primary shard, needs to be moved to another shard and made its new primary shard. For this process, MongoDB needs to know where to move these non-sharded databases/collections to.

In ClusterControl you can simply remove them via the actions drop down:

This will allow you to select the shard that you wish to remove, and the shard you wish to migrate any primary databases to:

The job that removes the shard will then perform similar actions as described earlier: it will move any primary databases to the designated shard, enable the balancer and then wait for it to move all data from the shard.

Once all the data has been removed, it will remove the shard from the UI.

Adding additional MongoDB shard routers

Once you start to scale out your application using a MongoDB sharded cluster, you may find you are in need of additional shard routers.

Adding additional MongoDB shard routers is a very simple process with ClusterControl, just open the Add Node dialogue from the actions drop down:

This will add a new shard router to the cluster. Don’t forget to set the proper default port (27017) on the router.

Step down server

In case you wish to perform maintenance on the primary node in a replicaSet, it is better to have it first “step down” in a graceful manner before taking it offline. Stepping down a primary basically means the host stops being a primary and becomes a secondary and is not eligible to become a primary for a set number of seconds. The nodes in the MongoDB replicaSet with voting power, will elect a new primary with the stepped down primary excluded for the set number of seconds.

In ClusterControl we have added the step down functionality as an action on the Nodes page. To step down, simply select this as an action from the drop down:

After setting the number of seconds for stepdown and confirming, the primary will step down and a new primary will be elected.

Freeze a node

This functionality is similar to the step down command: this makes a certain node ineligible to become a primary for a set number of seconds. This means you could prevent one or more secondary nodes to become a primary when stepping down the primary, and force a certain node to become the new primary this way.

In ClusterControl we have added the freeze node functionality as an action on the Nodes page. To freeze a node, simply select this as an action from the drop down:

After setting the number of seconds and confirming, the node will not be eligible as primary for the set number of seconds.

New MongoDB advisors

Advisors are mini programs that provide advice on specific database issues. We’ve added  three new advisors for MongoDB. The first one calculates the replication window, the second watches over the replication window, and the third checks for un-sharded databases/collections.

MongoDB Replication Lag advisor

Replication lag is very important to keep an eye on, if you are scaling out reads via adding more secondaries. MongoDB will only use these secondaries if they don’t lag too far behind. If the secondary has replication lag, you risk serving out stale data that already has been overwritten on the primary.

To check the replication lag, it suffices to connect to the primary and retrieve this data using the replSetGetStatus command. In contrary to MySQL, the primary keeps track of the replication status of its secondaries.

We have implemented this check into an advisor in ClusterControl, to ensure your replication lag will always be watched over.

MongoDB Replication Window advisor

Just like the replication lag, the replication window is an equally important metric to look at. The lag advisor already informs us of the number of seconds a secondary node is behind the primary/master. As the oplog is limited in size, having slave lag imposes the following risks:

  1. If a node lags too far behind, it may not be able to catch up anymore as the transactions necessary to catch up are no longer in the oplog of the primary.
  2. A lagging secondary node is less favoured in a MongoDB election for a new primary. If all secondaries are lagging behind in replication, you will have a problem and one with the least lag will be made primary.
  3. Secondaries lagging behind are less favoured by the MongoDB driver when scaling out reads with MongoDB, it also adds a higher workload on the remaining secondaries.

If we would have a secondary node lagging behind by a few minutes (or hours), it would be useful to have an advisor that informs us how much time we have left before our next transaction will be dropped from the oplog. The time difference between the first and last entry in the oplog is called the Replication Window. This metric can be created by fetching the first and last items from the oplog, and calculating the difference of their timestamps.

In the MongoDB shell, there is already a function available that calculates the replication window for you. However this function is built into the command line shell, so any outside connection not using the command line shell will not have this built-in function. Therefore we have made an advisor that will watch over the replication window and alerts you if you exceed a pre-set threshold.

MongoDB un-sharded databases and collections advisor

Non-sharded databases and collections will be assigned to a default primary shard by the MongoDB shard router. This means the database or collection is limited to the size of this primary shard, and if written to in large volumes, could use up all remaining disk space of a shard. Once this happens the shard will obviously no longer function. Therefore it is important to watch over all existing databases and collections, and scan the config database to validate that they have been enabled for sharding.

To prevent this from happening, we have created an un-sharded database and collection advisor. This advisor will scan every database and collection, and warn you if it has not been sharded.

ClusterControl improved the MongoDB maintainability

We have made a big step by adding all the improvements to ClusterControl for MongoDB replicaSets and sharded clusters. This improves the usability for MongoDB greatly, and allows DBAs, sysops and devops to maintain their clusters even better!

Automatic failover of MySQL Replication - New in ClusterControl 1.4

$
0
0

MySQL replication setups are inevitably related to failovers. Unlike multi-master clusters like Galera, there is one single writer in a whole setup - the master. If the master fails, one of the slaves will have to take its role through the process of failover. Such process is tricky and potentially, it may cause data loss. It may happen, for example, if a slave is not up to date while it is promoted. The master may also die before it is able to transfer all binlog events to at least one of its slaves.

Different people have different takes on how to perform failover. It depends on personal preferences but also on requirements of the business. There are two main options - automated failover or manual failover.

Automated failover comes in very handy if you want your environment to run 24x7, and to recover quickly from any failures. Unfortunately, this may come at a cost - in more complex failure scenarios, automated failover may not work correctly or, even worse, it may result in your data being messed up and partially missing (although one might argue that a human can also make disastrous mistakes leading to similar consequences). Those who prefer to keep close control over their database may choose to skip automated failover and use a manual process instead. Such process takes more time, but it allows an experienced DBA to assess the state of a system and take corrective actions based on what happened.

ClusterControl already supports automated failover for master-master clusters like Galera and NDB Cluster. Now with 1.4, it also does this for MySQL replication. In this blog post, we’ll take you through the failover process, discussing how ClusterControl does it, and what can be configured by the user.

Configuring Automatic Failover

Failover in ClusterControl can be configured to be automatic or not. If you prefer to take care of failover manually, you can disable automated cluster recovery. By default, cluster recovery is enabled and automated failover is used. Once you make changes in the UI, make sure you also make them in the cmon configuration and set enable_cluster_autorecovery to ‘0’. Otherwise your settings will be overwritten when the cmon process is restarted.

Failover is initiated by ClusterControl when it detects that there is no host with read_only flag disabled. It can happen because master (which has read_only set to 0) is not available or it can be triggered by a user or some external software that changed this flag on the master. If you do manual changes to the database nodes or have software that may fiddle with the read_only settings, then you should disable automatic failover.

Also, note that failover is attempted only once. Should a failover attempt fail, then no more attempts will be made until the controller is restarted.

At the beginning of the failover procedure, ClusterControl builds a list of slaves which can be promoted to master. Most of the time, it will contain all slaves in the topology but the user has some additional control over it. There are two variables you can set in the cmon configuration:

replicaton_failover_whitelist

and

replicaton_failover_blacklist

First of them, when used, contains a list of IP’s or hostnames of slaves which should be used as potential master candidates. If this variable is set, only those hosts will be considered.

Second variable may contain list of hosts which will never be considered a master candidate. You can use it to list slaves that are used for backups or analytical queries. If the hardware varies between slaves, you may want to put here the slaves which use slower hardware.

Replication_failover_whitelist takes precedence, meaning the replication_failover_blacklist is ignored if replication_failover_whitelist is set.

Once the list of slaves which may be promoted to master is ready, ClusterControl starts to compare their state, looking for the most up to date slave. Here, the handling of MariaDB and MySQL-based setups differs. For MariaDB setups, ClusterControl picks a slave which has the lowest replication lag of all slaves available. For MySQL setups, ClusterControl picks such a slave as well but then it checks for additional, missing transactions which could have been executed on some of the remaining slaves. If such a transaction is found, ClusterControl slaves the master candidate off that host in order to retrieve all missing transactions.

In case you’d like to skip this process and just use the most advanced slave, you can set the following setting in the cmon configuration:

replication_skip_apply_missing_txs=1

Such process may result in a serious problem though - if an errant transaction is found, replication may be broken. What is an errant transaction? In short, it is a transaction that has been executed on a slave but it’s not coming from the master. It could have been, for example, executed locally. The problem is caused by the fact that, while using GTID, if a host, which has such errant transaction, becomes a master, all slaves will ask for this missing transaction in order to be in sync with their new master. If the errant transaction happened way in the past, it may not longer be available in binary logs. In that case, replication will break because slaves won’t be able to retrieve the missing data. If you would like to learn more about errant transactions, we have a blog post covering this topic.

Of course, we don’t want to see replication breaking, therefore ClusterControl, by default, checks for any errant transactions before it promotes a master candidate to become a master. If such problem is detected, the master switch is aborted and ClusterControl lets the user fix the problem manually. The blog post we mentioned above explains how you can manually fix issues with errant transactions.

If you want to be 100% certain that ClusterControl will promote a new master even if some issues are detected, you can do that using the replication_stop_on_error=0 setting in cmon configuration. Of course, as we discussed, it may lead to problems with replication - slaves may start asking for a binary log event which is not available anymore. To handle such cases we added experimental support for slave rebuilding. If you set replication_auto_rebuild_slave=1 in the cmon configuration and if your slave is marked as down with the following error in MySQL:

Got fatal error 1236 from master when reading data from binary log: 'The slave is connecting using CHANGE MASTER TO MASTER_AUTO_POSITION = 1, but the master has purged binary logs containing GTIDs that the slave requires.'

ClusterControl will attempt to rebuild the slave using data from the master. Such a setting may not always be appropriate as the rebuilding process will induce an increased load on the master. It may also be that your dataset is very large and a regular rebuild is not an option - that’s why this behavior is disabled by default.

Once we ensure that no errant transactions exist and we are good to go, there is still one more issue we need to handle somehow - it may happen that all slaves are lagging behind the master.

As you probably know, replication in MySQL works in a rather simple way. The master stores writes in binary logs. The slave’s I/O thread connects to the master and pulls any binary log events it is missing. It then stores them in the form of relay logs. The SQL thread parses them and applies events. Slave lag is a condition in which SQL thread (or threads) cannot cope with the number of events, and is unable to apply them as soon as they are pulled from the master by the I/O thread. Such situation may happen no matter what type of replication you are using. Even if you use semi-sync replication, it can only guarantee that all events from the master are stored on one of slaves in the relay log. It doesn’t say anything about applying those events to a slave.

The problem here is that, if a slave is promoted to master, relay logs will be wiped out. If a slave is lagging and hasn’t applied all transactions, it will lose data - events that are not yet applied from relay logs will be lost forever.

There is no one-size-fits-all way of solving this situation. ClusterControl gives users control over how it should be done, maintaining safe defaults. It is done in cmon configuration using the following setting:

Replication_failover_wait_to_apply_timeout

By default it takes a value of ‘-1’, which means that failover won’t happen if a master candidate is lagging. ClusterControl will wait indefinitely for it to apply all missing transactions from its relay logs. This is safe, but, if for some reason, the most up-to-date slave is lagging badly, failover may takes hours to complete. On the other side of the spectrum is setting it to ‘0’ - it means that failover happens immediately, no matter if the master candidate is lagging or not. You can also go the middle way and set it to some value. This will set a time in seconds, during which ClusterControl will wait for a master candidate to apply missing transactions from its relay logs. Failover happens after the defined time or when the master candidate will catch up on replication - whichever happens first. This may be a good choice if your application has specific requirements regarding downtime and you have to elect a new master within a short time window.

When using MySQL replication along with proxies like ProxySQL, ClusterControl can help you build an environment in which the failover process is barely noticeable by the application. Below we’ll show how the failover process may look like in a typical replication setup - one master with two slaves. We will use ProxySQL to detect topology changes and route traffic to the correct hosts.

First, we’ll start our “application” - sysbench:

root@ip-172-30-4-48:~# while true ; do sysbench --test=/root/sysbench/sysbench/tests/db/oltp.lua --num-threads=2 --max-requests=0 --max-time=0 --mysql-host=172.30.4.48 --mysql-user=sbtest --mysql-password=sbtest --mysql-port=6033 --oltp-tables-count=32 --report-interval=1 --oltp-skip-trx=on --oltp-table-size=100000 run ; done

It will connect to ProxySQL (port 6033) and use it to distribute traffic between master and slaves. We simulate default behavior of autocommit=1 in MySQL by disabling transactions for Sysbench.

Once we induce some lag, we kill our master:

root@ip-172-30-4-112:~# killall -9 mysqld mysqld_safe

ClusterControl starts failover.

ID:79574 [13:18:34]: Failover to a new Master.

At first, it verifies state of replication on all nodes in the cluster. Among other things, ClusterControl looks for the most up to date slave in the topology and picks it as master candidate.

ID:79575 [13:18:34]: Checking 172.30.4.99:3306
ID:79576 [13:18:34]: ioerrno=2003 io running 0 on 172.30.4.99:3306
ID:79577 [13:18:34]: Checking 172.30.4.4:3306
ID:79578 [13:18:34]: ioerrno=2003 io running 0 on 172.30.4.4:3306
ID:79579 [13:18:34]: Checking 172.30.4.112:3306
ID:79580 [13:18:34]: 172.30.4.112:3306: is not connected. Checking if this is the failed master.
ID:79581 [13:18:34]: 172.30.4.99:3306: Checking if slave can be used as a candidate.
ID:79582 [13:18:34]: Adding 172.30.4.99:3306 to slave list
ID:79583 [13:18:34]: 172.30.4.4:3306: Checking if slave can be used as a candidate.
ID:79584 [13:18:34]: Adding 172.30.4.4:3306 to slave list
ID:79585 [13:18:34]: 172.30.4.4:3306: Slave lag is 4 seconds.
ID:79586 [13:18:34]: 172.30.4.99:3306: Slave lag is 20 seconds >= 4 seconds, not a possible candidate.
ID:79587 [13:18:34]: 172.30.4.4:3306 elected as the new Master.

As a next step, required grants are added.

ID:79588 [13:18:34]: 172.30.4.4:3306: Creating user 'rpl_user'@'172.30.4.99.
ID:79589 [13:18:34]: 172.30.4.4:3306: Granting REPLICATION SLAVE 'rpl_user'@'172.30.4.99'.
ID:79590 [13:18:34]: 172.30.4.99:3306: Creating user 'rpl_user'@'172.30.4.4.
ID:79591 [13:18:34]: 172.30.4.99:3306: Granting REPLICATION SLAVE 'rpl_user'@'172.30.4.4'.
ID:79592 [13:18:34]: 172.30.4.99:3306: Setting read_only=ON
ID:79593 [13:18:34]: 172.30.4.4:3306: Setting read_only=ON

Then, it’s time to ensure no errant transactions are found, which could prevent the whole failover process from happening.

ID:79594 [13:18:34]: Checking for errant transactions.
ID:79595 [13:18:34]: 172.30.4.99:3306: Skipping, same as slave 172.30.4.99:3306
ID:79596 [13:18:34]: 172.30.4.99:3306: Comparing to 172.30.4.4:3306, master_uuid = 'e4864640-baff-11e6-8eae-1212bbde1380'
ID:79597 [13:18:34]: 172.30.4.4:3306: Checking for errant transactions.
ID:79598 [13:18:34]: 172.30.4.112:3306: Skipping, same as master 172.30.4.112:3306
ID:79599 [13:18:35]: 172.30.4.4:3306: Comparing to 172.30.4.99:3306, master_uuid = 'e4864640-baff-11e6-8eae-1212bbde1380'
ID:79600 [13:18:35]: 172.30.4.99:3306: Checking for errant transactions.
ID:79601 [13:18:35]: 172.30.4.4:3306: Skipping, same as slave 172.30.4.4:3306
ID:79602 [13:18:35]: 172.30.4.112:3306: Skipping, same as master 172.30.4.112:3306
ID:79603 [13:18:35]: No errant transactions found.

During the last preparation step, missing transactions are being applied on the master candidate - we want it to fully catch up on the replication before we proceed with failover. In our case, to ensure that failover will happen even if slave is badly lagging, we enforced 600 second limit - slave will try to replay any missing transactions from its relay logs but if it will take more than 600 seconds, we will force a failover.

ID:79604 [13:18:35]: 172.30.4.4:3306: preparing candidate.
ID:79605 [13:18:35]: 172.30.4.4:3306: Checking if there the candidate has relay log to apply.
ID:79606 [13:18:35]: 172.30.4.4:3306: waiting up to 600 seconds before timing out.
ID:79608 [13:18:37]: 172.30.4.4:3306: Applied 391 transactions
ID:79609 [13:18:37]: 172.30.4.4:3306: Executing 'SELECT WAIT_UNTIL_SQL_THREAD_AFTER_GTIDS('e4864640-baff-11e6-8eae-1212bbde1380:16340-23420', 5)' (waited 5 out of maximally 600 seconds).
ID:79610 [13:18:37]: 172.30.4.4:3306: Applied 0 transactions
ID:79611 [13:18:37]: 172.30.4.99:3306: No missing transactions found.
ID:79612 [13:18:37]: 172.30.4.4:3306: Up to date with temporary master 172.30.4.99:3306
ID:79613 [13:18:37]: 172.30.4.4:3306: Completed preparations of candidate.

Finally, failover happens. From the application’s standpoint, the impact was minimal - the process took less than 5 seconds, during which the application had to wait for queries to execute. Of course, it depends on multiple factors - the main one is replication lag as the failover process, by default, requires the slave to be up-to-date. Catching up can take quite some time if the slave is lagging behind heavily.

At the end, we have a new replication topology. A new master has been elected and the second slave has been reslaved. The old master, on the other hand, is stopped. This is intentional as we want the user to be able to investigate the state of the old master before performing any further changes (e.g., slaving it off a new master or rebuilding it).

We hope this mechanism will be useful in maintaining high availability of replication setups. If you have any feedback on it, let us know as we’d love to hear from you.

ClusterControl
Single Console for Your Entire Database Infrastructure
Find out what else is new in ClusterControl

How to automate & manage MySQL (Replication) & MongoDB with ClusterControl - live webinar

$
0
0

Join us next Tuesday, February 7th 2017, as Johan Andersson, CTO at Severalnines, unveils the new ClusterControl 1.4 in a live demo webinar.

ClusterControl reduces complexity of managing your database infrastructure while adding support for new technologies; enabling you to truly automate multiple environments for next-level applications. This latest release further builds out the functionality of ClusterControl to allow you to manage and secure your 24/7, mission critical infrastructures.

In this live webinar, Johan will demonstrate how ClusterControl increases your efficiency by giving you a single interface to deploy and operate your databases, instead of searching for and cobbling together a combination of open source tools, utilities and scripts that need constant updates and maintenance. Watch as ClusterControl demystifies the complexity associated with database high availability, load balancing, recovery and your other everyday struggles.

To put it simply: learn how to be a database hero with ClusterControl!

Date, Time & Registation

Europe/MEA/APAC

Tuesday, February 7th at 09:00 GMT (UK) / 10:00 CET (Germany, France, Sweden)

Register Now

North America/LatAm

Tuesday, February 7th at 9:00 Pacific Time (US) / 12:00 Eastern Time (US)

Register Now

Agenda

  • ClusterControl (1.4) Overview
  • ‘Always on Databases’ with enhanced MySQL Replication functions
  • ‘Safer NoSQL’ with MongoDB and larger sharded cluster deployments
  • ‘Enabling the DBA’ with ProxySQL, HAProxy and MaxScale
  • Backing up your open source databases
  • Live Demo
  • Q&A

Speaker

Johan Andersson, CTO, Severalnines

Johan's technical background and interest are in high performance computing as demonstrated by the work he did on main-memory clustered databases at Ericsson as well as his research on parallel Java Virtual Machines at Trinity College Dublin in Ireland. Prior to co-founding Severalnines, Johan was Principal Consultant and lead of the MySQL Clustering & High Availability consulting group at MySQL / Sun Microsystems / Oracle, where he designed and implemented large-scale MySQL systems for key customers. Johan is a regular speaker at MySQL User Conferences as well as other high profile community gatherings with popular talks and tutorials around architecting and tuning MySQL Clusters.

We look forward to “seeing” you there and to insightful discussions!

If you have any questions or would like a personalised live demo, please do contact us.

Video: An Overview of the Features & Functions of ClusterControl

$
0
0

The video below demonstrates the top features and functions included in ClusterControl.  

ClusterControl is an all-inclusive database management system that lets you easily deploy, monitor, manage and scale highly available open source databases on-premise or in the cloud.

Included in this presentation are…

  • Deploying MySQL, MongoDB & PostgreSQL nodes and clusters
  • Overview of the monitoring dashboard
  • Individual node or cluster monitoring
  • Query monitor system
  • Creating and restoring immediate and scheduled backups
  • Configuration management
  • Developer Studio introduction
  • Reviewing log files
  • Scaling database clusters

Viewing all 385 articles
Browse latest View live