Quantcast
Channel: Severalnines - clustercontrol
Viewing all 385 articles
Browse latest View live

Become a ClusterControl DBA: Making your DB components HA via Load Balancers

$
0
0

Choosing your HA topology

There are various ways to retain high availability with databases. You can use Virtual IPs (VRRP) to manage host availability, you can use resource managers like Zookeeper and Etcd to (re)configure your applications or use load balancers/proxies to distribute the workload over all available hosts.

The Virtual IPs need either an application to manage them (MHA, Orchestrator), some scripting (KeepaliveD, Pacemaker/Corosync) or an engineer to manually fail over and the decision making in the process can become complex. The Virtual IP failover is a straightforward and simple process by removing the IP address from one host, assigning it to another and use arping to send a gratuitous ARP response. In theory a Virtual IP can be moved in a second but it will take a few seconds before the failover management application is sure the host has failed and acts accordingly. In reality this should be somewhere between 10 and 30 seconds. Another limitation of Virtual IPs is that some cloud providers do not allow you to manage your own Virtual IPs or assign them at all. E.g., Google does not allow you to do that on their compute nodes.

Resource managers like Zookeeper and Etcd can monitor your databases and (re)configure your applications once a host fails or a slave gets promoted to master. In general this is a good idea but implementing your checks with Zookeeper and Etcd is a complex task.

A load balancer or proxy will sit in between the application and the database host and work transparently as if the client would connect to the database host directly. Just like with the Virtual IP and resource managers, the load balancers and proxies also need to monitor the hosts and redirect the traffic if one host is down. ClusterControl supports two proxies: HAProxy and MaxScale and both are supported for MySQL master-slave replication and Galera cluster. HAProxy and MaxScale both have their own use cases, we will describe them in this post as well.

Why do you need a load balancer?

In theory you don’t need a load balancer but in practice you will prefer one. We’ll explain why. 

If you have virtual IPs setup, all you have to do is point your application to the correct (virtual) IP address and everything should be fine connection wise. But suppose you have scaled out the number of read replicas, you might want to provide virtual IPs for each of those read replicas as well because of maintenance or availability reasons. This might become a very large pool of virtual IPs that you have to manage. If one of those read replicas had a failure, you need to re-assign the virtual IP to another host or else your application will connect to either a host that is down or in worst case, a lagging server with stale data. Keeping the replication state to the application managing the virtual IPs is therefore necessary.

Also for Galera there is a similar challenge: you can in theory add as many hosts as you’d like to your application config and pick one at random. The same problem arises when this host is down: you might end up connecting to an unavailable host. Also using all hosts for both reads and writes might also cause rollbacks due to the optimistic locking in Galera. If two connections try to write to the same row at the same time, one of them will receive a roll back. In case your workload has such concurrent updates, it is advised to only use one node in Galera to write to. Therefore you want a manager that keeps track of the internal state of your database cluster.

Both HAProxy and MaxScale will offer you the functionality to monitor the database hosts and keep state of your cluster and its topology. For replication setups, in case a slave replica is down, both HAProxy and MaxScale can redistribute the connections to another host. But if a replication master is down, HAProxy will deny the connection and MaxScale will give back a proper error to the client. For Galera setups, both load balancers can elect a master node from the Galera cluster and only send the write operations to that specific node.

On the surface HAProxy and MaxScale may seem to be similar solutions, but they differ a lot in features and the way they distribute connections and queries. Both HAProxy and MaxScale can distribute connections using round-robin. You can utilize the round-robin also to split reads by designating a specific port for sending reads to the slaves and another port to send writes to the master. Your application will have to decide whether to use the read or write port. Since MaxScale is an intelligent proxy, it is database aware and is also able to analyze your queries. MaxScale is able to do read/write splitting on a single port by detecting whether you are performing a read or write operation and connecting to the designated slaves or master in your cluster. MaxScale includes additional functionality like binlog routing, audit logging and query rewriting but we will have to cover these in a separate article.

That should be enough background information on this topic, so let’s see how you can deploy both load balancers for MySQL replication and Galera topologies.

Deploying HAProxy

Using ClusterControl to deploy HAProxy on a Galera cluster is easy: go to the relevant cluster and select “Add Load Balancer”:

severalnines-blogpost-add-galera-haproxy.png

And you will be able to deploy an HAProxy instance by adding the host address and selecting the server instances you wish to include in the configuration:

severalnines-blogpost-add-galera-haproxy-2.png

By default the HAProxy instance will be configured to send connections to the server instances receiving the least number of connections, but you can change that policy to either round robin or source. 

Under advanced settings you can set timeouts, maximum amount of connections and even secure the proxy by whitelisting an IP range for the connections.

Under the nodes tab of that cluster, the HAProxy node will appear:

severalnines-blogpost-add-galera-haproxy-3.png

Now your Galera cluster is also available via the newly deployed HAProxy node on port 3307. Don’t forget to GRANT your application access from the HAProxy IP, as now the traffic will be incoming from the proxy instead of the application hosts.  Also, remember to point your application connection to the HAProxy node.

Now suppose the one server instance would go down, HAProxy will notice this within a few seconds and stop sending traffic to this instance:

severalnines-blogpost-add-galera-haproxy-node-down.png

The two other nodes are still fine and will keep receiving traffic. This retains the cluster highly available without the client even noticing the difference.

Deploying a secondary HAProxy node

Now that we have moved the responsibility of retaining high availability over the database connections from the client to HAProxy, what if the proxy node dies? The answer is to create another HAProxy instance and use a virtual IP controlled by Keepalived as shown in this diagram:

The benefit compared to using virtual IPs on the database nodes is that the logic for MySQL is at the proxy level and the failover for the proxies is simple.

So let’s deploy a secondary HAProxy node:

severalnines-blogpost-add-galera-second-haproxy-1.png

After we have deployed a secondary HAProxy node, we need to add Keepalived:

severalnines-blogpost-add-keepalived.png

And after Keepalived has been added, your nodes overview will look like this:

severalnines-blogpost-keepalived.png

So now instead of pointing your application connections to the HAProxy node directly you have to point them to the virtual IP instead.

In the example here, we used separate hosts to run HAProxy on, but you could easily add them to existing server instances as well. HAProxy does not bring much overhead, although you should keep in mind that in case of a server failure, you will lose both the database node and the proxy.

Deploying MaxScale

Deploying MaxScale to your cluster is done in a similar way to HAProxy: ‘Add Load Balancer’ in the cluster list.

severalnines-blogpost-add-maxscale.png

ClusterControl will deploy MaxScale with both the round-robin router and the read/write splitter. The CLI port will be used to enable you to administrate MaxScale from ClusterControl.

After MaxScale has been deployed, it will be available under the Nodes tab:

severalnines-blogpost-maxscale-admin2.png

Opening the MaxScale node overview will present you the interface that grants you access to the CLI interface, so there is no reason to log into MaxScale on the node anymore. 

For MaxScale, the grants are slightly different: as you are proxying, you need to allow connections from the proxy - just like with HAProxy. But since MaxScale is also performing local authentication and authorization, you need to grant access to your application hosts as well.

Deploying Garbd

Galera implements a quorum-based algorithm to select a primary component through which it enforces consistency. The primary component needs to have a majority of votes (50% + 1 node), so in a 2 node system, there would be no majority resulting in split brain. Fortunately, it is possible to add a garbd (Galera Arbitrator Daemon), which is a lightweight stateless daemon that can act as the odd node. The added benefit by adding the Galera Arbitrator is that you can now do with only two nodes in your cluster.

If ClusterControl detects that your Galera cluster consists of an even number of nodes, you will be given the warning/advice by ClusterControl to extend the cluster to an odd number of nodes:

severalnines-blogpost-even-nodes-galera.png

Choose wisely the host to deploy garbd on, as it will receive all replicated data. Make sure the network can handle the traffic and is secure enough. You could choose one of the HAProxy or MaxScale hosts to deploy garbd on, like in the example below:

severalnines-blogpost-add-garbd.png

Alternatively you could install garbd on the ClusterControl host.

After installing garbd, you will see it appear next to your two Galera nodes:

severalnines-blogpost-garbd-cluster-list.png

Final thoughts

We showed you how to make your MySQL master-slave and Galera cluster setups more robust and retain high availability using HAProxy and MaxScale. Also garbd is a nice daemon that can save the extra third node in your Galera cluster. 

This finalizes the deployment side of ClusterControl. In our next blog, we will show you how to integrate ClusterControl within your organization by using groups and assigning certain roles to users.

Blog category:


ClusterControl Tips & Tricks: Manage and Monitor your Existing MySQL NDB Cluster

$
0
0

Of the different types of clustered MySQL environments, NDB Cluster is among the ones that involves more effort and resource to administer. And unless you are a command line freak, you would want to use a tool that gives you a full view of what is going on in your cluster. 

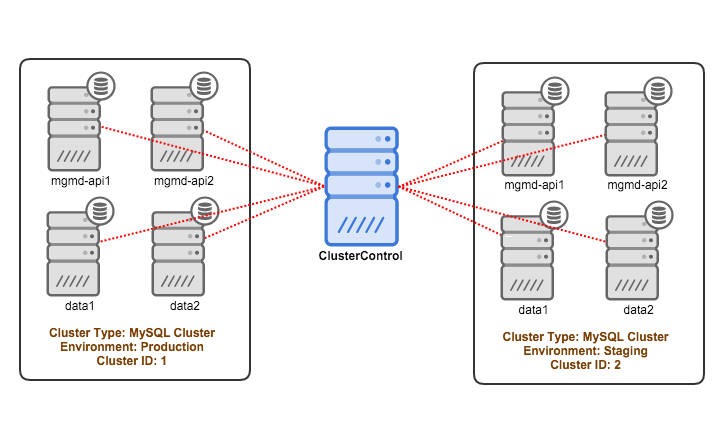
It is possible to install ClusterControl and monitor your existing MySQL Cluster (NDB). In this blog post, we are going to show you on how to add two existing MySQL Clusters (production and staging) into ClusterControl. 

  • ClusterControl: 192.168.55.170
  • Cluster #1:
    • Management/API node: mgmd-api1 - 192.168.55.71
    • Management/API node: mgmd-api2 - 192.168.55.72
    • Data node: data1 - 192.168.55.73
    • Data node: data2 - 192.168.55.74
  • Cluster #2:
    • Management/API node: mgmd-api1 - 192.168.55.81
    • Management/API node: mgmd-api2 - 192.168.55.82
    • Data node: data1 - 192.168.55.83
    • Data node: data2 - 192.168.55.84

Adding the first cluster

Based on the above architecture diagram, here is what you should do to add the first cluster into ClusterControl:

1. Install the latest ClusterControl. Once done, register the default admin user/password and log into the ClusterControl dashboard:

2. As root or sudo user, setup passwordless SSH to all nodes (including ClusterControl node):

$ whoami
root
$ ssh-keygen -t rsa
$ ssh-copy-id 192.168.55.71
$ ssh-copy-id 192.168.55.72
$ ssh-copy-id 192.168.55.73
$ ssh-copy-id 192.168.55.74

Also ensure that the controller can connect to the management servers (ndb_mgmd) on port 1186, and on port 3306 (or the port used by the mysql servers).

3. Since this is the first cluster, we are going to assign it cluster ID number 1. Create a CMON configuration file at /etc/cmon.d/cmon_1.cnf and paste the following lines:

cluster_id=1
name=default_cluster_1
mode=controller
type=mysqlcluster
skip_name_resolve=1
mysql_port=3306
mysql_hostname=192.168.55.170
mysql_password=cmon
mysql_basedir=/usr/
hostname=192.168.55.170
osuser=root
os=redhat
logfile=/var/log/cmon_1.log
pidfile=/var/run/
ssh_identity=''
ssh_opts=-q
ssh_port=22
monitored_mountpoints=/var/lib/mysql/,/data/mysqlcluster/
monitored_mysql_root_password=rootpassword
ndb_connectstring=192.168.55.71:1186,192.168.55.72:1186
mysql_server_addresses=192.168.55.71,192.168.55.72
datanode_addresses=192.168.55.73,192.168.55.74
mgmnode_addresses=192.168.55.71,192.168.55.72
db_stats_collection_interval=30
host_stats_collection_interval=60
mysql_bindir=/usr/bin/
enable_cluster_autorecovery=0
enable_node_autorecovery=0
db_configdir=/etc/mysql

In the above example, the target MySQL Cluster:

  • is running on CentOS 6.5 (os=redhat). 
  • SSH user is root (osuser=root)
  • Using the default SSH key for user root (ssh_identity=’’)
  • Consists of 2 MySQL API nodes (mysql_server_addresses=192.168.55.71,192.168.55.72)
  • Consists of 2 management nodes (mysql_server_addresses=192.168.55.71,192.168.55.72)
  • Consists of 2 MySQL data nodes (mysql_server_addresses=192.168.55.71,192.168.55.72)
  • ndb_mgmd on management node is running on port 1186 (ndb_connectstring=192.168.55.71:1186,192.168.55.72:1186)
  • MySQL base directory is under /usr/. You can check with SHOW VARIABLES LIKE 'basedir'
  • MySQL binaries are installed under /usr/bin
  • MySQL data directory is located at /var/lib/mysql while NDB datadir is at /data/mysqlcluster/ and we want ClusterControl to monitor that. (monitored_mountpoints=/var/lib/mysql/,/data/mysqlcluster/)
  • Configuration files (my.cnf/config.ini) of the cluster is stored in db_configdir=/etc/mysql

Details on configuration options are explained in the documentation page.

4. Restart CMON service to apply the changes:

$ service cmon restart

Monitor the log file for this cluster at /var/log/cmon_1.log and you should see something like this:

$ tail -f /var/log/cmon.log
Nov 18 16:22:52 : (INFO) Checking tables for duplicate indexes.
Nov 18 16:22:52 : (INFO) Checking indexes for selectivity.
Nov 18 16:22:52 : (INFO) Gathering Database Stats Completed
Nov 18 16:22:53 : (INFO) Query Monitor: Changed periodicity from -1 to 1
Nov 18 16:22:53 : (INFO) Query Monitor: Setting Query Sampling, Long_query_time: '0.5'
Nov 18 16:22:53 : (INFO) Query Monitor: Setting log_queries_not_using_indexes: 'OFF'
Nov 18 16:22:53 : (INFO) Query Monitor: Setting Query Sampling, Long_query_time: '0.5'
Nov 18 16:22:53 : (INFO) Query Monitor: Setting log_queries_not_using_indexes: 'OFF'
Nov 18 16:22:57 : (INFO) CmonCommandHandler: started, polling for commands.
Nov 18 16:22:57 : (INFO) Aborting DEQUEUED, RUNNING and DEFINED jobs
Nov 18 16:23:02 : (INFO) MonitorThread: Cluster STARTED   - all nodes are started  - running

Then go to ClusterControl > Settings > Cluster Registrations > Synchronize Clusters to immediately load the cluster in the dashboard. You should now see the first cluster is added into ClusterControl as cluster ID 1, similar to the following screenshot:

Adding more clusters

Once imported, you will have to add the subsequent MySQL cluster as cluster ID 2 or higher. To achieve this, run following steps on ClusterControl node:

1. Copy CMON configuration file from cluster ID 1 as a template for cluster ID 2:

$ cp /etc/cmon.d/cmon_1.cnf /etc/cmon.d/cmon_2.cnf

Update the following lines inside /etc/cmon.d/cmon_2.cnf to reflect the second cluster:

cluster_id=2
name=default_cluster_2
logfile=/var/log/cmon_2.log
mysql_server_addresses=[SQL nodes IP address or hostname in comma separated list]
datanode_addresses=[data nodes IP address or hostname in comma separated list]
mgmnode_addresses=[management nodes IP address or hostname in comma separated list]
ndb_connectstring=[NDB connection string of the cluster]

Details on configuration options are explained in the documentation page.

2. Setup passwordless SSH to the all MySQL Cluster nodes in second cluster using the following commands:

$ ssh-copy-id 192.168.55.81
$ ssh-copy-id 192.168.55.82
$ ssh-copy-id 192.168.55.83
$ ssh-copy-id 192.168.55.84

3. Restart CMON service to apply the changes:

$ service cmon restart

At this point, ClusterControl should start provisioning all nodes defined in the CMON configuration files (both /etc/cmon.d/cmon_1.cnf and /etc/cmon.d/cmon_2.cnf). Monitor the output of CMON controller for cluster ID 2 at /var/log/cmon_2.log. 

Then go to ClusterControl > Settings > Cluster Registrations > Synchronize Clusters to load the cluster in the dashboard. You should see it listed under the Database Cluster List:

You can now manage, monitor and scale your MySQL Clusters from the ClusterControl app. Happy clustering!

Blog category:

Become a ClusterControl DBA: Safeguarding your Data

$
0
0

In the past four posts of the blog series, we covered deployment of clustering/replication (MySQL/Galera, MySQL Replication, MongoDB & PostgreSQL), management & monitoring of your existing databases and clusters, performance monitoring and health and in the last post, how to make your setup highly available through HAProxy and MaxScale.

So now that you have your databases up and running and highly available, how do you ensure that you have backups of your data?

You can use backups for multiple things: disaster recovery, to provide production data to test against development or even to provision a slave node. This last case is already covered by ClusterControl. When you add a new (replica) node to your replication setup, ClusterControl will make a backup/snapshot of the master node and use it to build the replica. After the backup has been extracted, prepared and the database is up and running, ClusterControl will automatically set up replication.

Creating an instant backup

In essence creating a backup is the same for Galera, MySQL replication, Postgres and MongoDB. You can find the backup section under ClusterControl > Backup and by default it should open the scheduling overview. From here you can also press the “Backup” button to make an instant backup.

severalnines-blogpost-schedule-backup.png

As all these various databases have different backup tools, there is obviously some difference in the options you can choose. For instance with MySQL you get choose between mysqldump and xtrabackup. If in doubt which one to choose (for MySQL), check out this blog about the differences and use cases for mysqldump and xtrabackup.

On this very same screen, you can also create a backup schedule that allows you to run the backup at a set interval, for instance, during off-peak hours.

severalnines-blogpost-current-schedule.png

Backing up MySQL and Galera

As mentioned in the previous paragraph, you can make MySQL backups using either mysqldump or xtrabackup. Using mysqldump you can make backups of individual schemas or a selected set of schemas while xtrabackup will always make a full backup of your database.

In the Backup Wizard, you can choose which host you want to run the backup on, the location where you want to store the backup files, and its directory and specific schemas.

severalnines-blogpost-instant-backup.png

If the node you are backing up is receiving (production) traffic, and you are afraid the extra disk writes will become intrusive, it is advised to send the backups to the ClusterControl host. This will cause the backup to stream the files over the network to the ClusterControl host and you have to make sure there is enough space available on this node.

If you would choose xtrabackup as the method for the backup, it would open up extra options: desync, compression and xtrabackup parallel threads/gzip. The desync option is only applicable to desync a node from a Galera cluster. 

severalnines-blogpost-backup-xtrabackup.png

After scheduling an instant backup you can keep track of the progress of the backup job in the Settings > Cluster Jobs. After it has finished, you should be able to see the backup file in the configured location.

severalnines-blogpost-cluster-jobs-backup.png

Backing up PostgreSQL

Similar to the instant backups of MySQL, you can run a backup on your Postgres database. With Postgres backups the are less options to fill in as there is one backup method: pg_dump.

severalnines-blogpost-backup-postgresql.png

Backing up MongoDB

Similar to PostgreSQL there is only one backup method: mongodump. In contrary to PostgreSQL the node that we take the backup from can be desynced in the case of MongoDB.

severalnines-blogpost-mongodb-backup.png

Scheduling backups

Now that we have played around with creating instant backups, we now can extend that by scheduling the backups.
The scheduling is very easy to do: you can select on which days the backup has to be made and at what time it needs to run.

For xtrabackup there is an additional feature: incremental backups. An incremental backup will only backup the data that changed since the last backup. Of course, the incremental backups are useless if there would not be full backup as a starting point. Between two full backups, you can have as many incremental backups as you like. But restoring them will take longer. 

Once scheduled the job(s) should become visible under the “Current Backup Schedule” and you can edit them by double clicking on them. Like with the instant backups, these jobs will schedule the creation of a backup and you can keep track of the progress via the Cluster Jobs overview if necessary.

Backup reports

You can find the Backup Reports under ClusterControl > Backup and this will give you a cluster level overview of all backups made. Also from this interface you can directly restore a backup to a host in the master-slave setup or an entire Galera cluster. 

severalnines-blogpost-backup-reports.png

The nice feature from ClusterControl is that it is able to restore a node/cluster using the full+incremental backups as it will keep track of the last (full) backup made and start the incremental backup from there. Then it will group a full backup together with all incremental backups till the next full backup. This allows you to restore starting from the full backup and applying the incremental backups on top of it.

Offsite backup in Amazon S3 or Glacier

Since we have now a lot of backups stored on either the database hosts or the ClusterControl host, we also want to ensure they don’t get lost in case we face a total infrastructure outage. (e.g. DC on fire or flooded) Therefore ClusterControl allows you to copy your backups offsite to Amazon S3 or Glacier. 

To enable offsite backups with Amazon, you need to add your AWS credentials and keypair in the Service Providers dialogue (Settings > Service Providers).

several-nines-blogpost-aws-credentials.png

Once setup you are now able to copy your backups offsite:

severalnines-blogpost-upload-backups-aws-s3-glacier.png

This process will take some time as the backup will be sent encrypted and the Glacier service is, in contrary to S3, not a fast storage solution.

After copying your backup to Amazon S3 or Glacier you can get them back easily by selecting the backup in the S3/Glacier tab and click on retrieve. You can also remove existing backups from Amazon S3 and Glacier here.

An alternative to Amazon S3 or Glacier would be to send your backups to another data center (if available). You can do this with a sync tool like BitTorrent Sync. We wrote a blog article on how to set up BitTorrent Sync for backups within ClusterControl.

Final thoughts

We showed you how to get your data backed up and how to store them safely off site. Recovery is always a different thing. ClusterControl can recover automatically your databases from the backups made in the past that are stored on premises or copied back from S3 or Glacier. Recovering from backups that have been moved to any other offsite storage will involve manual intervention though.
 
Obviously there is more to securing your data, especially on the side of securing your connections. We will cover this in the next blog post!

Blog category:

Press Release: Severalnines aims for the stars with EGO boost

$
0
0

Swedish database technology ensures intergalactic research data protected “to infinity and beyond” for scientists

Stockholm, Sweden and anywhere else in the world -Severalnines, the provider of database infrastructure management software, today announced its latest customer, the European Gravitational Observatory (EGO). Severalnines’ ClusterControl platform is used to manage and monitor the operations of some of EGO’s open source databases and help scientists to track, analyse and share data gathered from research on gravitational waves.  

EGO is one of the world’s leading research structures devoted to the study of gravitational waves. EGO hosts the Virgo experiment, a project involving about 300 scientists spread across 19 laboratories in France, Italy, Poland, the Netherlands and Hungary. The observatory also collaborates with a wider network of scientists based in the United States and Asia. Gravitational waves were predicted one century ago by Einstein's theory of General Relativity but they have never been observed directly, although there is indirect evidence of their existence. The direct detection of gravitational waves, the main goal of  experiments such as Virgo, will solve one of the long-standing puzzles of Einstein's theory and provide a new powerful tool to observe the Universe.

Research on gravitational waves creates at least 6 Terabytes of new data every day. The data gathered is used for scientific research into gravitational waves and to help the development of the cutting-edge technologies used by Virgo, which span various fields, from mechanics to optics and electronics.  

The scale of data created on a daily basis provides challenges for EGO’s IT team which has to ensure research data is not lost either when at rest or in transfer. The IT team needed a robust technology which could work with various open and proprietary IT environments, and around-the-clock access to database performance and management expertise.

After a review process, Severalnines was selected by EGO in January 2015 after the team read a series of strong online reviews on how Severalnines’ ClusterControl platform manages MySQL database clusters. EGO tested ClusterControl on its Scientific Linux platform, based on the popular Red Hat system, during the trial period. The ease of installation during testing was another reason why EGO’s IT team decided to work with Severalnines beyond the trial period.

cluster_control_logo-300x111.png

With ClusterControl, EGO can manage and monitor all database clusters on a single dashboard and reduce time spent on backing-up research data. Severalnines helped EGO to focus on new business initiatives such as improving the sharing and presentation of research data on various graphical formats.

Giuseppe Di Biase, Systems Administrator at EGO, said: “Data is so important to the work EGO carries out on a daily basis. Without it, important scientific discoveries based on gravitational waves may be missed. The Severalnines team offered excellent, personalised support and gave us practical advice on how to enhance our systems. I still learn something new every time I talk to Severalnines, they have made my job easier .”

Vinay Joosery, Severalnines CEO said: “ We are very proud at Severalnines to support the leading edge of science with the most advanced database management software. The scale of EGO’s operation is tremendous and it relies on stable and robust technology, we look forward to taking this relationship to another world.”

About Severalnines

Severalnines provides automation and management software for database clusters. We help companies deploy their databases in any environment, and manage all operational aspects to achieve high-scale availability.

Severalnines' products are used by developers and administrators of all skills levels to provide the full 'deploy, manage, monitor, scale' database cycle, thus freeing them from the complexity and learning curves that are typically associated with highly available database clusters. The company has enabled over 7,000 deployments to date via its popular online database configurator. Currently counting BT, Orange, Cisco, CNRS, Technicolor, AVG, Ping Identity and Paytrail as customers.  Severalnines is a private company headquartered in Stockholm, Sweden with offices in Singapore and Tokyo, Japan. To see who is using Severalnines today visit, http://www.severalnines.com/company

About the European Gravitational Observatory

The European Gravitational Observatory (EGO) is a French-Italian private Consortium founded by a joint agreement between the French Centre National de la Recherche Scientifique (CNRS) and the Italian Istituto Nazionale di Fisica Nucleare (INFN). Both these research institutions equally finance the running of the Consortium since its foundation in December 2000.

In 2009 EGO was pleased to welcome the Dutch Institute for Subatomic Physics (Nikhef) as Observer within its Council. Today about 60 people work at the headquarters of EGO in Cascina, a small town about 10 kilometers from Pisa, in the Italian region of Tuscany. The main purpose of EGO is to ensure the construction of Advanced Virgo and to guarantee its operations, maintenance, and upgrade, as well as the exploitation of scientific data. EGO is integrated to the Virgo Collaboration by providing a large and crucial support to the experiment and is fully responsible for the site of the Virgo interferometer. Another key goal of EGO is to promote the studies on gravitational physics in Europe and to be on the frontline of the gravitational wave research.

Fore more information, contact Jean-Jérôme Schmidt: jj@severalnines.com

Blog category:

Severalnines breaks records on MySQL, PostgreSQL and MongoDB

$
0
0

Sweden’s self-funded database provider powers past 2014 revenues and grows team

Stockholm, Sweden and anywhere else in the world - 01 DECEMBER 2015 - Severalnines, a database automation pioneer which helps businesses deploy and manage open source databases in any environment, closes 2015 on a high with new customer wins and new hires.
 
Momentum highlights:

  • Over 100% sales growth achieved early in first half of 2015
  • 150+ enterprise customers, 8,000+ community users
  • New enterprise accounts wins such as the European Broadcast Union, European Gravitational Observatory, BT Expedite and French national scientific research centre, CNRS
  • Hired Gerry Treacy, former MongoDB executive, as Vice President of Sales
  • Added support for PostgreSQL to ClusterControl alongside MySQL and MongoDB

Severalnines’ flagship ClusterControl platform helps deploy, monitor, manage and scale SQL and NoSQL open source databases. Automation and control of database infrastructure across mixed environments, usually the case in large enterprises, makes Severalnines the ideal polyglot persistence solution to support modern business mixed IT environments. The reason for ClusterControl’s popularity is the way it provides full operational visibility and control for open source databases.

Severalnines is entirely self-funded, having taken no external capital, allowing its product team to focus solely on solving pressing customer and community user needs. 

Gerry Photo.jpgTo further its expansion in 2016 and beyond, Severalnines hired Gerry Treacy as Vice President of Sales to drive revenues worldwide. Treacy brings veteran sales expertise on SQL and NoSQL technologies from his time at MySQL, Oracle and MongoDB, where he held senior international management roles in Corporate Sales.


Commenting on the ongoing growth of the company, Severalnines CEO, Vinay Joosery, said: “It is a promising sign Severalnines had a strong 2015 when the global technology sector is going through a phase of readjustment. Enterprises are increasingly choosing to operate mixed environments and we backed a hunch that the market was ready for our polyglot persistence technology. As a result, we’ve been laser-focused on building the best operational tools to run high availability open source databases. Users are responding positively to that.”vinay_new.png

 
Explaining the company’s commercial success, he noted: “In the current age of virtualised environments across public/private clouds, we are reminded time and time again that servers are not immune to failures. But building resilient infrastructure is no small feat - from design, configuration and management through to data integrity and security - there is plenty to do. With ClusterControl, we’ve effectively lowered the barrier to entry for sysadmins and devops engineers to build and run highly available database infrastructures on top of open source. Distributed database systems are now a reality for all enterprises, not just for web giants.”
 
To join Severalnines’ growing customer base please click here.
 
 
About Severalnines

Severalnines provides automation and management software for database clusters. We help companies deploy their databases in any environment, and manage all operational aspects to achieve high-scale availability.

Severalnines' products are used by developers and administrators of all skills levels to provide the full 'deploy, manage, monitor, scale' database cycle, thus freeing them from the complexity and learning curves that are typically associated with highly available database clusters. The company has enabled over 8,000 deployments to date via its popular online database configurator. Currently counting BT, Orange, Cisco, CNRS, Technicolour, AVG, Ping Identity and Paytrail as customers.  Severalnines is a private company headquartered in Stockholm, Sweden with offices in Singapore and Tokyo, Japan. To see who is using Severalnines today visit, http://www.severalnines.com/company

Press contact

Severalnines
Jean-Jérôme Schmidt
jj@severalnines.com

Blog category:

Become a ClusterControl DBA: Managing your Database Configurations

$
0
0

In the past five posts of the blog series, we covered deployment of clustering/replication (MySQL / Galera, MySQL Replication, MongoDB & PostgreSQL), management & monitoring of your existing databases and clusters, performance monitoring and health, how to make your setup highly available through HAProxy and MaxScale and in the last post, how to prepare yourself for disasters by scheduling backups.

With ClusterControl 1.2.11, we made major enhancements to the database configuration manager. The new version allows changing of parameters on multiple database hosts at the same time and, if possible, changing their values at runtime.

We featured the new MySQL Configuration Management in a Tips & Tricks blog post, but this blog post will go more in depth and cover Configuration Management within ClusterControl for MySQL, PostgreSQL and MongoDB.

Cluster Control Configuration management

The configuration management interface can be found under Manage > Configurations. From here, you can view or change the configurations of your database nodes and other tools that ClusterControl manages. ClusterControl will import the latest configuration from all nodes and overwrite previous copies made. Currently there is no historical data kept.

If you’d rather like to manually edit the config files directly on the nodes, you can re-import the altered configuration by pressing the Import button.

And last but not least: you can create or edit configuration templates. These templates are used whenever you deploy new nodes in your cluster. Of course any changes made to the templates will not retroactively applied to the already deployed nodes that were created using these templates.

MySQL Configuration Management

As previously mentioned, the MySQL configuration management got a complete overhaul in ClusterControl 1.2.11. The interface is now more intuitive. When changing the parameters ClusterControl checks whether the parameter actually exists. This ensures your configuration will not deny startup of MySQL due to parameters that don’t exist.

From Manage -> Configurations, you will find an overview of all config files used within the selected cluster, including MaxScale nodes.

We use a tree structure to easily view hosts and their respective configuration files. At the bottom of the tree, you will find the configuration templates available for this cluster.

Changing parameters

Suppose we need to change a simple parameter like the maximum number of allowed connections (max_connections), we can simply change this parameter at runtime.

First select the hosts to apply this change to.

Then select the section you want to change. In most cases, you will want to change the MYSQLD section. If you would like to change the default character set for MySQL, you will have to change that in both MYSQLD and client sections.

If necessary you can also create a new section by simply typing the new section name. This will create a new section in the my.cnf.

Once we change a parameter and set its new value by pressing “proceed”, ClusterControl will check if the parameter exists for this version of MySQL. This is to prevent any non-existent parameters to block the initialization of MySQL on the next restart.

When we press “proceed” for the max_connections change, we will receive a confirmation that it has been applied to the configuration and set at runtime using SET GLOBAL. A restart is not required as max_connections is a parameter we can change at runtime.

Now suppose we want to change the bufferpool size, this would require a restart of MySQL before it takes effect:

And as expected the value has been changed in the configuration file, but a restart is required. You can do this by logging into the host manually and restarting the MySQL process. Another way to do this from ClusterControl is by using the Nodes dashboard.

Restarting nodes in a Galera cluster

You can perform a restart per node by selecting “Shutdown Node” and pressing the “Execute” button.

This will stop MySQL on the host but depending on your workload and bufferpool size this could take a while as MySQL will start flushing the dirty pages from the InnoDB bufferpool to disk. These are the pages that have been modified in memory but not on disk.

Once the host has stopped MySQL the “Start Node” button should become available:

Make sure you leave the “initial” checkbox unchecked in the confirmation:

When you select “initial start” on a Galera node, ClusterControl will empty the MySQL data directory and force a full copy this way. This is, obviously, unncessary for a configuration change.

Restarting nodes in a MySQL master-slave topologies

For MySQL master-slave topologies you can’t just restart node by node. Unless downtime of the master is acceptable, you will have to apply the configuration changes to the slaves first and then promote a slave to become the new master.

You can go through the slaves one by one and execute a “Shutdown node” on them and once MySQL has stopped execute the “Start node” again. Again make sure you leave the “initial” checkbox unchecked in the confirmation:

Just like the “Start Node” with Galera clusters, “initial start” will delete the MySQL data directory and copy the data from the master.

After applying the changes to all slaves, promote a slave to become the new master:

After the slave has become the new master, you can shutdown and start the old master node to apply the change.

Importing configurations

Now that we have applied the change directly on the database, as well as the configuration file, it will take until the next configuration import to see the change reflected in the configuration stored in ClusterControl. If you are less patient, you can schedule an immediate configuration import by pressing the “Import” button.

PostgreSQL Configuration Management

For PostgeSQL, the Configuration Management works a bit different from the MySQL Configuration Management. In general, you have the same functionality here: change the configuration, import configurations for all nodes and define/alter templates.

The difference here is that you can immediately change the whole configuration file and write this configuration back to the database node.

If the changes made requires a restart, a “Restart” button will appear that allows you to restart the node to apply the changes.

MongoDB Configuration Management

The MongoDB Configuration Management works similar to the PostgreSQL Configuration Management: you can change the configuration, import configurations for all nodes and alter templates.

Changing the configuration is, just like PostgreSQL, altering the whole configuration:

The biggest difference for MongoDB is that there are four configuration templates predefined:

The reason for this is that we support different types of MongoDB clusters, and this gets reflected in the cluster configurations.

Final thoughts

In this blog post we learned about how to manage, alter and template your configurations in ClusterControl. Changing the templates can save you a lot of time when you have deployed only one node in your topology. As the template will be used for new nodes, this will save you from altering all configurations afterwards. However for MySQL based nodes changing the configuration on all nodes has become trivial due to the new Configuration Management interface.

As a reminder, we recently covered in the same series deployment of clustering/replication (MySQL / Galera, MySQL Replication, MongoDB & PostgreSQL), management & monitoring of your existing databases and clusters, performance monitoring and health, how to make your setup highly available through HAProxy and MaxScale and in the last post, how to prepare yourself for disasters by scheduling backups.

Blog category:

Webinar: Polyglot Persistence for the MongoDB, PostgreSQL & MySQL DBA - Tuesday December 22nd

$
0
0

Join us for our new webinar on Tuesday, December 22nd, which is also our last webinar in 2015!

Polyglot Persistence for the MongoDB, PostgreSQL & MySQL DBA

The introduction of DevOps in organisations has changed the development process, and perhaps introduced some challenges. Developers, in addition to their own preferred programming languages, also have their own preference for backend storage.The former is often referred to as polyglot languages and the latter as polyglot persistence.

Having multiple storage backends means your organization will become more agile on the development side and allows choice to the developers but it also imposes additional knowledge on the operations side. Extending your infrastructure from only MySQL, to deploying other storage backends like MongoDB and PostgreSQL, implies you have to also monitor, manage and scale them. As every storage backend excels at different use cases, this also means you have to reinvent the wheel for every one of them.

DATE, TIME & REGISTRATION

Europe/MEA/APAC
Tuesday, December 22nd at 09:00 GMT / 10:00
CET (Germany, France, Sweden)
Register Now

North America/LatAm
Tuesday, December 22nd at 09:00 Pacific Time (US) / 12:00 Eastern Time (US)
Register Now

AGENDA

This webinar will cover the four major operational challenges for MySQL, MongoDB & PostgreSQL:

  • Deployment
  • Management
  • Monitoring
  • Scaling
  • And how to deal with them

SPEAKER

Art van Scheppingen is a Senior Support Engineer at Severalnines. He’s a pragmatic MySQL and Database expert with over 15 years experience in web development. He previously worked at Spil Games as Head of Database Engineering, where he kept a broad vision upon the whole database environment: from MySQL to Couchbase, Vertica to Hadoop and from Sphinx Search to SOLR. He regularly presents his work and projects at various conferences (Percona Live, FOSDEM) and related meetups.

This webinar is based upon the experience Art had while writing our How to become a ClusterControl DBA blog series and implementing multiple storage backends to ClusterControl. To view all the blogs of the ‘Become a ClusterControl DBA’ series visit: http://severalnines.com/blog-categories/clustercontrol

Blog category:

ClusterControl Tips & Tricks: Monitoring multiple MySQL instances on one machine

$
0
0

Requires ClusterControl 1.2.11 or later. Applies to MySQL based instances/clusters.

On some occasions, you might want to run multiple instances of MySQL on a single machine. You might want to give different users access to their own mysqld servers that they manage themselves, or you might want to test a new MySQL release while keeping an existing production setup undisturbed.

It is possible to use a different MySQL server binary per instance, or use the same binary for multiple instances (or a combination of the two approaches). For example, you might run a server from MySQL 5.1 and one from MySQL 5.5, to see how the different versions handle a certain workload. Or you might run multiple instances of the latest MySQL version, each managing a different set of databases.

Whether or not you use distinct server binaries, each instance that you run must be configured with unique values for several operating parameters. This eliminates the potential for conflict between instances. You can use MySQL Sandbox to create multiple MySQL instances. Or you can use mysqld_multi available in MySQL to start, or stop any number of separate mysqld processes running on different TCP/IP ports and UNIX sockets.

In this blog post, we’ll show you how to monitor multiple MySQL instances on one host using ClusterControl.

ClusterControl Limitation

At the time of writing, ClusterControl does not support monitoring of multiple instances on one host per cluster/server group. It assumes the following best practices:

  • Only one MySQL instance per host (physical server or virtual machine).
  • MySQL data redundancy should be configured on N+1 server.
  • All MySQL instances are running with uniform configuration across cluster/server group, e.g., listening port, error log, datadir, basedir, socket are identical.

With regards to the points mentioned above, ClusterControl assumes that in a cluster/server group:

  • MySQL instances are configured uniformly across a cluster; same port, same location of logs, base/data directory and other critical configurations.
  • It monitors, manages and deploys only one MySQL instance per host.
  • MySQL client must be installed on the host and available on the executable path for the corresponding OS user.
  • The MySQL is bound to an IP address reachable by ClusterControl node.
  • It keeps monitoring the host statistics e.g CPU/RAM/disk/network for each MySQL instance individually. In an environment with multiple instances per host, you should expect redundant host statistics since it monitors the same host multiple times.

With the above assumptions, the following ClusterControl features do not work for a host with multiple instances:

  • Backup - Percona Xtrabackup does not support multiple instances per host and mysqldump executed by ClusterControl only connects to the default socket.
  • Process management - ClusterControl uses the standard ‘pgrep -f mysqld_safe’ to check if MySQL is running on that host. With multiple MySQL instances, this is a false positive approach. As such, automatic recovery for node/cluster won’t work.
  • Configuration management - ClusterControl provisions the standard MySQL configuration directory. It usually resides under /etc/ and /etc/mysql.

Workaround

Monitoring multiple MySQL instances on a machine is still possible with ClusterControl with a simple workaround. Each MySQL instance must be treated as a single entity per server group.

In this example, we have 3 MySQL instances on a single host created with MySQL Sandbox:

We created our MySQL instances using the following commands:

$ su - sandbox
$ make_multiple_sandbox mysql-5.6.26-linux-glibc2.5-x86_64.tar.gz

By default, MySQL Sandbox creates mysql instances that listen to 127.0.0.1. It is necessary to configure each node appropriately to make them listen to all available IP addresses. Here is the summary of our MySQL instances in the host:

[sandbox@test multi_msb_mysql-5_6_26]$ cat default_connection.json
{
"node1":
    {
        "host":     "127.0.0.1",
        "port":     "15227",
        "socket":   "/tmp/mysql_sandbox15227.sock",
        "username": "msandbox@127.%",
        "password": "msandbox"
    }
,
"node2":
    {
        "host":     "127.0.0.1",
        "port":     "15228",
        "socket":   "/tmp/mysql_sandbox15228.sock",
        "username": "msandbox@127.%",
        "password": "msandbox"
    }
,
"node3":
    {
        "host":     "127.0.0.1",
        "port":     "15229",
        "socket":   "/tmp/mysql_sandbox15229.sock",
        "username": "msandbox@127.%",
        "password": "msandbox"
    }
}

From ClusterControl, we need to perform ‘Add Existing Server/Cluster’ for each instance as we need to isolate them in a different group to make it work. For node1, enter the following information in ClusterControl> Add Existing Server/Cluster:

You can monitor the progress by clicking on the spinning arrow icon in the top menu. You will see node1 in the UI once ClusterControl finishes the job:

Repeat the same steps to add another two nodes with port 15228 and 15229. You should see something like the below once they are added:

There you go. We just added our existing MySQL instances into ClusterControl for monitoring. Happy monitoring!

PS.: To get started with ClusterControl, click here!

Blog category:


Press Release: Severalnines adds silver lining to database management for CloudStats.me

$
0
0

UK server monitoring platform provider moves from MySQL to MariaDB with ClusterControl

Stockholm, Sweden and anywhere else in the world - 08 December 2015 – Severalnines, the provider of open source database management tools, today announced its latest customer, CloudStats.me. CloudStats.me is a cloud-based server monitoring platform capable of monitoring Linux, Windows, OS X servers and personal computers, web sites and IP addresses. Users of CloudStats.me range from system administrators to website owners and web hosting providers, such as WooServers, HudsonValleyHost and other SMEs.

CloudStats.me is a UK company which currently monitors more than 1300 servers and 1000 websites and its server monitoring platform is growing rapidly at 500-1000 new users per week, adding approximately 1.5 servers to each new user account.

The rapid growth of the CloudStats user base and the number of services being monitored created a very high load on its database. Such high load has led the MySQL-based CloudStats database to being unable of handling large amounts of incoming data collected by the CloudStats system, causing false alerts and further inconveniences to some of its users. CloudStats needed a new database distribution mechanism that would replace the current MySQL database configuration to avoid further customer churn.

The MariaDB MySQL Galera Cluster, which allows users to create a MySQL cluster with a “Master-Master” replication, was chosen as the replacement. The database is automatically distributed and replicated across multiple servers, and additional servers can be added to scale workloads, which makes it extremely easy to scale a database cluster and add additional resources to it if necessary.

For the CloudStats.me team it was apparent, however, that the database cluster management required a number of specialist technical skills. This could create a burden on the development team as they would need to devote extra time to setup, configure and manage clusters. Instead of hiring additional database system administrators, it was much more efficient to use one platform that could quickly install, configure and manage a MariaDB Galera Cluster. Furthermore, such a platform would need to support easy cluster expansion, database availability, scalability and security.

After some online investigtion, the CloudStats.me team found Severalnines’ ClusterControl. The initial setup of the ClusterControl platform only took a couple of hours and went live straight out of the box. The whole installation process was fully automated, so the team could have clusters up and running in very little time. Severalnines also offered valuable advice on design of the new database architecture.

Today, CloudStats.me sees the following benefits from using Severalnines ClusterControl:

  • Complete control of its MariaDB cluster with an ability to scale at any time.
  • Significant cost savings were achieved as ClusterControl helped reduce database administration costs by 90%.
  • There is additional bandwidth to save costs on technical issues with support included as part of the ClusterControl subscription.

Vinay Joosery, Severalnines Founder and CEO said: “As we have seen recently, 2015 is truly the year of the cloud as the leading vendors are beating their expected sales targets. There is an appetite to ensure servers can be rapidly deployed and optimised for performance. It is therefore no surprise to see the success of companies like CloudStats.me. We are delighted to provide CloudStats.me with a scalable infrastructure and the ability to increase or decrease workload based on its customers’ needs.”

Alex Krasnov, CEO CloudStats said: “Our cloud and server performance management business is witnessing a ‘hockey stick’ growth trajectory. This means it was particularly important to plan our infrastructure in such a way that it would support further growth and allow us to add more features into the CloudStats control panel. The support we have had from Severalnines has made our lives much easier because it provided the database expertise, which we needed to ensure our system has a maximum uptime. We plan to deploy more clusters and continue to integrate ClusterControl with our server monitoring platform.”

For more information on how CloudStats uses ClusterControl panel based on WooServers MariaDB cluster-optimized dedicated servers, click here.

About Severalnines

Severalnines provides automation and management software for database clusters. We help companies deploy their databases in any environment, and manage all operational aspects to achieve high-scale availability.

Severalnines' products are used by developers and administrators of all skills levels to provide the full 'deploy, manage, monitor, scale' database cycle, thus freeing them from the complexity and learning curves that are typically associated with highly available database clusters. The company has enabled over 8,000 deployments to date via its popular online database configurator. Currently counting BT, Orange, Cisco, CNRS, Technicolour, AVG, Ping Identity and Paytrail as customers. Severalnines is a private company headquartered in Stockholm, Sweden with offices in Singapore and Tokyo, Japan. To see who is using Severalnines today visit, http://www.severalnines.com/company

About CloudStats.me

CloudStats.me is a server and website monitoring and backup solution that works from the cloud. With CloudStats it is easy to monitor and backup any type of Server, Droplet or Instance working on Linux or Windows operating system. Being platform agnostic CloudStats.me will allow you to monitor and backup your whole IT infrastructure from one single place. For instance, if you have several droplets on Digital Ocean, a few instances on Amazon EC2, one dedicated server and one virtual server at a 3rd party company - CloudStats will gather statistics from all of them and will notify you of any problems with your services.

CloudStats.me is a Microsoft partner and has a full support of Microsoft Azure, including monitoring and backups of any services to Azure cloud storage.

Among CloudStats clients are both private system administrators as well as hosting providers, such as WooServers.com, HudsonValleyHost, VirtusHost, Host4Geeks, etc.

Press contact

Severalnines
Jean-Jérôme Schmidt
jj@severalnines.com

Blog category:

Latest Updates on Severalnines Tools: Docker, Puppet, Chef, Vagrant and more

$
0
0

ClusterControl integrates with a number of popular third-party tools for deployment and monitoring - from Docker images to Puppet modules, Chef cookbooks, Vagrant images, and Nagios/Zabbix/Syslog/PagerDuty plugins. In this blog, we’ll have a quick look at the latest available resources.

Docker

From v1.2.11, ClusterControl does not have to be deployed on the same OS as the database server’s operating system. Previously, ClusterControl on a Redhat system could only monitor database nodes running on a Redhat system, the same goes for Debian/Ubuntu. This is no longer the case.

We have rebuilt our Docker container image under a single operating system, CentOS 6 with latest minor version. The deployment instruction is now way simpler as you can see in the Docker Hub page. The remaining containers are removed from the list. Deploying ClusterControl on Docker is now as simple as:

$ docker pull severalnines/clustercontrol
$ docker run -d --name clustercontrol -p 5000:80 severalnines/clustercontrol

Next, setup SSH keys from ClusterControl to all target containers/nodes and start adding your existing DB infrastructure into ClusterControl. For details, check out the Docker Registry page.

Puppet Module & Chef Cookbooks

Previously, the Puppet module and Chef Cookbooks for ClusterControl were built with “add existing database cluster” in mind. The idea was that you already had a running database cluster deployed using Puppet/Chef, and wanted to manage it using ClusterControl.

We’ve now updated the cookbooks so that you install ClusterControl first and then use it to deploy your databases and clusters.

Note that, once you have deployed ClusterControl, it is also possible from the UI to manage an existing database setup.

We have also streamlined the installation method of these tools to follow our installer script, install-cc (as shown in the Getting Started page). The module/cookbooks will setup /etc/cmon.cnf with minimal configuration, and subsequent cluster configuration files will reside under /etc/cmon.d/ directory. This new version also introduces support for PostgreSQL instances.

Example Puppet host definition for ClusterControl node is now as simple as below:

node "clustercontrol.local" {
   class { 'clustercontrol':
           is_controller => true,
           api_token => 'b7e515255db703c659677a66c4a17952515dbaf5'
   }
}

Same goes to Chef Cookbooks, the simplest databag for ClusterControl node is now:

{
   "id" : "config",
   "clustercontrol_api_token" : "92ee6e2368df29ae52fba0e2aad2b28240e6908b"
}

For more details, please refer to Puppet Forge or Chef Supermarket.

Vagrant

Our Vagrantfile deploys 4 instances on VirtualBox platform, three for DB nodes plus one for ClusterControl. It installs the latest released ClusterControl version on Centos/Redhat or Debian/Ubuntu based distributions.

Compared to our previous version of Vagrantfile as described in this blog post, we are no longer depending on the custom Vagrant boxes that we have built. The new Vagrantfile will perform the following actions when firing up new instances:

  1. Download a base image from HashiCorp.
  2. Fire up 4 virtual machines from the downloaded base image.
  3. Add port forwarding for ClusterControl UI.
  4. Install ClusterControl latest version on 10.10.10.10.
  5. Set up SSH key on all virtual machines (ClusterControl + DB nodes).

The default memory allocated for each instance is 768MB. The default MySQL root user password on the ClusterControl host is 'root123'. The default IP address for each virtual machine would be:

  • 10.10.10.10 - ClusterControl
  • 10.10.10.11 - DB #1
  • 10.10.10.12 - DB #2
  • 10.10.10.13 - DB #3

You can then use the available DB nodes to create a database cluster or single DB instances.

CentOS

Launches a VirtualBox’s instance for ClusterControl and three instances for DB Nodes, running on CentOS 7.1 base image:

$ git clone https://github.com/severalnines/vagrant
$ vagrant box add bento/centos-7.1
$ cd clustercontrol/centos
$ vagrant up

Ubuntu

Launches a VirtualBox’s instance for ClusterControl and three instances for DB Nodes, running on Ubuntu 14.04 base image:

$ git clone https://github.com/severalnines/vagrant
$ vagrant box add ubuntu/trusty64
$ cd clustercontrol/ubuntu
$ vagrant up

Once the virtual machines are up, setup password-less SSH access from the ClusterControl node to all DB nodes:

$ vagrant ssh vm1

Copy over the root's public ssh key (default password for the vagrant user is 'vagrant'):

[vagrant@n1 ~]$ for h in 10.10.10.11 10.10.10.12 10.10.10.13; do sudo cat /root/.ssh/id_rsa.pub | ssh $h "sudo mkdir -p /root/.ssh && sudo tee -a /root/.ssh/authorized_keys && sudo chmod 700 /root/.ssh && sudo chmod 600 /root/.ssh/authorized_keys"; done;

Open your web browser to http://localhost:8080/clustercontrol and create a ClusterControl default admin user. You can now create your databases and clusters on the available DB nodes by clicking on 'Create Database Cluster' or ‘Create Database Node’. Specify root as SSH user and /root/.ssh/id_rsa as the SSH key in the dialog and you are good to go.

Database Advisors - s9s-advisor-bundle

Advisors in ClusterControl are powerful constructs; they provide specific advice on how to address issues in areas such as performance, security, log management, configuration, storage space, etc. They can be anything from simple configuration advice, warning on thresholds or more complex rules for predictions or cluster-wide automation tasks based on the state of your servers or databases. In general, advisors perform more detailed analysis, and produce more comprehensive recommendations than alerts.

With ClusterControl, we ship a set of basic advisors that are open source. These include rules and alerts on security settings, system checks (NUMA, Disk, CPU), queries, innodb, connections, performance schema, Galera configuration, NDB memory usage, and so on. The advisors can be downloaded from Github. Through ClusterControl Developer Studio, you can create new ones. It is also easy to import the bundles written by our partners or users, or export your own for others to try out.

To build a bundle, navigate to the directory and run create_bundle.sh script:

$ cd /home/user
$ ./create_bundle.sh dirname

This will create a file: dirname.tar.gz. To import into Developer Studio, go to ClusterControl > Manage > Developer Studio > Import. You will be prompted if you want to overwrite the existing files.

For more information, check out the Github repository here. Full documentation on ClusterControl DSL is available at documentation page.

clustercheck-iptables

Are you using a TCP load balancer in front of Galera cluster, and it has limited healthcheck capabilities? This healthcheck script allows your favorite TCP load balancer like F5, nginx, balance, pen and others to correctly distribute database connections to the different nodes in a Galera cluster.
The idea is simple; If the Galera node is healthy, it is reachable on the mirror port (a redirection port to the real port) on the DB nodes. The TCP load balancer will then just need to forward the incoming MySQL connections to any available mirror port on the backend.

The simplest way to get it running on each DB node:

$ git clone https://github.com/ashraf-s9s/clustercheck-iptables
$ cp clustercheck-iptables/mysqlchk_iptables /usr/local/sbin/
$ mysqlchk_iptables -d --user=check --password=checkpassword

Details on this are explained in this Github repository page and this blog post. We also recorded an asciinema screencast on how the script works in action.

ClusterControl Plugins

We have made a number of improvements on the ClusterControl plugins. These now support the new CMON RPC interface, which was made available from ClusterControl v1.2.10. All of the plugins are compatible with 1.2.11 as well.

The following ClusterControl plugins are available under s9s-admin repository:

  • nagios - pull database cluster status and alarms from ClusterControl
  • pagerduty - push ClusterControl alarms to Pagerduty
  • syslog - push ClusterControl alarms to syslog
  • zabbix - pull database cluster status, backup status and alarms from ClusterControl

Note that Nagios and Zabbix plugins are only tested on the latest version of the respective products.

You can find a list of active tools on Severalnines’ Tools page. We highly recommend users to keep up-to-date with the latest release of ClusterControl to get the best out of these tools/plugins.

Blog category:

Press Release: Percona and Severalnines Expand Partnership to Include MongoDB

$
0
0

Severalnines ClusterControl Helps Organizations
Deploy, Monitor, Manage and Scale Percona Server for MongoDB

Severalnines, the provider of open source database management tools, and Percona, the company that delivers enterprise-class MySQL® and MongoDB® solutions and services, this week announced they are expanding their partnership to offer ClusterControl for Percona Server for MongoDB, enabling subscribers of Percona Support for MongoDB to access the advanced deployment, monitoring, management, and scaling solutions available from Severalnines. The combination of Percona Server for MongoDB and Severalnines ClusterControl enables organizations to cost-effectively deploy, monitor, manage and scale a NoSQL database infrastructure.

Percona has offered Severalnines ClusterControl for XtraDB Cluster and other MySQL clustering solutions since early 2014. Percona also provides support for Severalnines ClusterControl Enterprise Edition when purchased from Severalnines or Percona and used with a cluster deployment covered by a Percona Support subscription that includes coverage for Percona Server for MongoDB, Percona XtraDB Cluster, or MySQL Cluster.

Highlights

  • ClusterControl for Percona Server for MongoDB:
    • Supports on-premise and Amazon Web Services deployments, providing the broadest flexibility to deploy, monitor, manage and scale Percona Server for MongoDB.
    • Can also be used to manage and monitor existing MongoDB servers.
    • Enables a single pane of glass to be used for all MySQL and MongoDB servers.
  • Deployment and management options include single MongoDB instances, replica sets, and sharded clusters.
  • Percona Support has worked directly with Severalnines to ensure full compatibility of ClusterControl with MongoDB and will provide assistance with the configuration and administration of ClusterControl for Percona Server for MongoDB.
  • For more information about ClusterControl for Percona Server for MongoDB, visit http://severalnines.com/product/mongodb

Quotes

Vinay Joosery, Co-founder and CEO of Severalnines
“Percona continues to demonstrate industry leadership by bringing together the technologies, expertise and resources companies need to cost-effectively build out their core information infrastructures. The combination of Percona Server for MongoDB and ClusterControl by Severalnines creates an extremely affordable path to deploying, monitoring, managing and scaling a NoSQL database to support their most demanding information initiatives.”

Peter Zaitsev, Co-founder and CEO of Percona
“We are very pleased to expand our relationship with Severalnines to bring enhanced management, scalability, and industry-leading expertise to Percona Server for MongoDB deployments. With ClusterControl by Severalnines, organizations can now truly afford to monitor, manage and scale the highly available database infrastructures they need to stay competitive in an information-driven economy.”

About Percona

With more than 3,000 customers worldwide, Percona is the only company that delivers enterprise-class solutions for both MySQL and MongoDB across traditional and cloud-based platforms. The company provides Software, Support, Consulting, and Managed Services to some of the largest and most well-known brands on the Internet such as Cisco Systems, Time Warner Cable, Alcatel-Lucent, Groupon, and the BBC, as well as to many smaller companies looking to maximize application performance while streamlining database efficiencies. Well established as thought leaders, Percona experts author content for the Percona Data Performance Blog. The popular Percona Live conferences draw attendees and acclaimed speakers from around the world. For more information, visit www.percona.com.

About Severalnines

Severalnines provides automation and management software for database clusters. We help companies deploy their databases in any environment, and manage all operational aspects to achieve high-scale availability.

Severalnines' products are used by developers and administrators of all skills levels to provide the full 'deploy, manage, monitor, scale' database cycle, thus freeing them from the complexity and learning curves that are typically associated with highly available database clusters. The company has enabled over 8,000 deployments to date via its popular online database configurator. Currently counting BT, Orange, Cisco, CNRS, Technicolour, AVG, Ping Identity and Paytrail as customers. Severalnines is a private company headquartered in Stockholm, Sweden with offices in Singapore and Tokyo, Japan. To see who is using Severalnines today visit, http://www.severalnines.com/company.


Percona®, XtraBackup®, TokuDB® and Fractal Tree® are registered trademarks of Percona LLC or its subsidiaries. All other registered and unregistered trademarks are the sole property of their respective owners.

Blog category:

s9s Tools and Resources: Momentum Highlights for MySQL, PostgreSQL, MongoDB and more!

$
0
0

Check Out Our Latest Technical Resources for MySQL, MariaDB, PostgreSQL and MongoDB

This is our last s9s Tools & Resources communication in 2015 and as we prepare to kick off 2016, we’d like to take this opportunity to thank you for your support in the year gone by and to wish you a successful start to the new year!

This is a summary of all the resources we recently published. Please do check it out and let us know if you have any comments or feedback.

Momentum Highlights

Severalnines breaks records on MongoDB, MySQL & PostgreSQL

  • Over 100% sales growth achieved early in first half of 2015
  • 150+ enterprise customers, 8,000+ community users - thank you for joining us!
  • New enterprise accounts wins such as the European Broadcast Union, European Gravitational Observatory, BT Expedite and French national scientific research centre, CNRS
  • Hired Gerry Treacy, former MongoDB executive, as Vice President of Sales
  • Added support for PostgreSQL to ClusterControl alongside MySQL and MongoDB

Read the full momentum release here

Technical Webinar Replay

Polyglot Persistence for the MongoDB, MySQL & PostgreSQL DBA

During our last webinar of the year, Art van Scheppingen discussed the four major operational challenges for MySQL, MongoDB & PostgreSQL and demonstrated, using ClusterControl, how Polyglot Persistence for datastores can be managed from one single control centre.

View the replay and read the slides here

Customer Case Studies

From small businesses to Fortune 500 companies, customers have chosen Severalnines to deploy and manage MySQL, MongoDB and PostgreSQL.  

View our Customer page to discover companies like yours who have found success with ClusterControl.

Partnership Announcement

Percona & Severalnines expand partnership to include MongoDB

Peter Zaitsev, Co-founder and CEO of Percona, had this to say about this new announcement with our long-term partner: “We are very pleased to expand our relationship with Severalnines to bring enhanced management, scalability, and industry-leading expertise to Percona Server for MongoDB deployments. With ClusterControl by Severalnines, organizations can now truly afford to monitor, manage and scale the highly available database infrastructures they need to stay competitive in an information-driven economy.”

Read the full announcement here

ClusterControl Blogs

Our series of blogs focussing on how to use ClusterControl continues. Do check them out!

View all ClusterControl blogs here

The MySQL DBA Blog Series

We’re on the 18th installment of our popular ‘Become a MySQL DBA’ series and you can view all of these blogs here. Here are the latest ones in the series:

View all the ‘Become a MySQL DBA’ blogs here

Additional Technical Blogs & Resources

Events

The Percona Live Data Performance Conference (for MySQL and MongoDB users and more) is coming up in just a few months and we’ve been busy with talk submissions for the conference. Two of our talks have already been selected and you can find the ful list of the talks we submitted here. We hope to see you in Santa Clara!

We trust these resources are useful. If you have any questions on them or on related topics, please do contact us!

All our best wishes for the new year,
Your Severalnines Team

Blog category:

ClusterControl Developer Studio: write your first database advisor

$
0
0

Did you ever wonder what triggers the advice in ClusterControl that your disk is filling up? Or the advice to create primary keys on InnoDB tables if they don’t exist? These advisors are mini scripts written in the ClusterControl Domain Specific Language (DSL) that is a Javascript-like language. These scripts can be written, compiled, saved, executed and scheduled in ClusterControl. That is what the ClusterControl Developer Studio blog series will be about.

Today we will cover the Developer Studio basics and show you how to create your very first advisor where we will pick two status variables and give advice about their outcome.

The advisors

Advisors are mini scripts that are executed by ClusterControl, either on-demand or after a schedule. They can be anything from simple configuration advice, warning on thresholds or more complex rules for predictions or cluster-wide automation tasks based on the state of your servers or databases. In general, advisors perform more detailed analysis, and produce more comprehensive recommendations than alerts.

The advisors are stored inside the ClusterControl database and you can add new or alter/modify existing advisors. We also have an advisor Github repository where you can share your advisors with us and other ClusterControl users.

The language used for the advisors is the so called ClusterControl DSL and is an easy to comprehend language. The semantics of the language can be best compared to Javascript with a couple of differences, where the most important differences are:

  • Semicolons are mandatory
  • Various numeric data types like integers and unsigned long long integers.
  • Arrays are two dimensional and single dimensional arrays are lists.

You can find the full list of differences in the ClusterControl DSL reference.

The Developer Studio interface

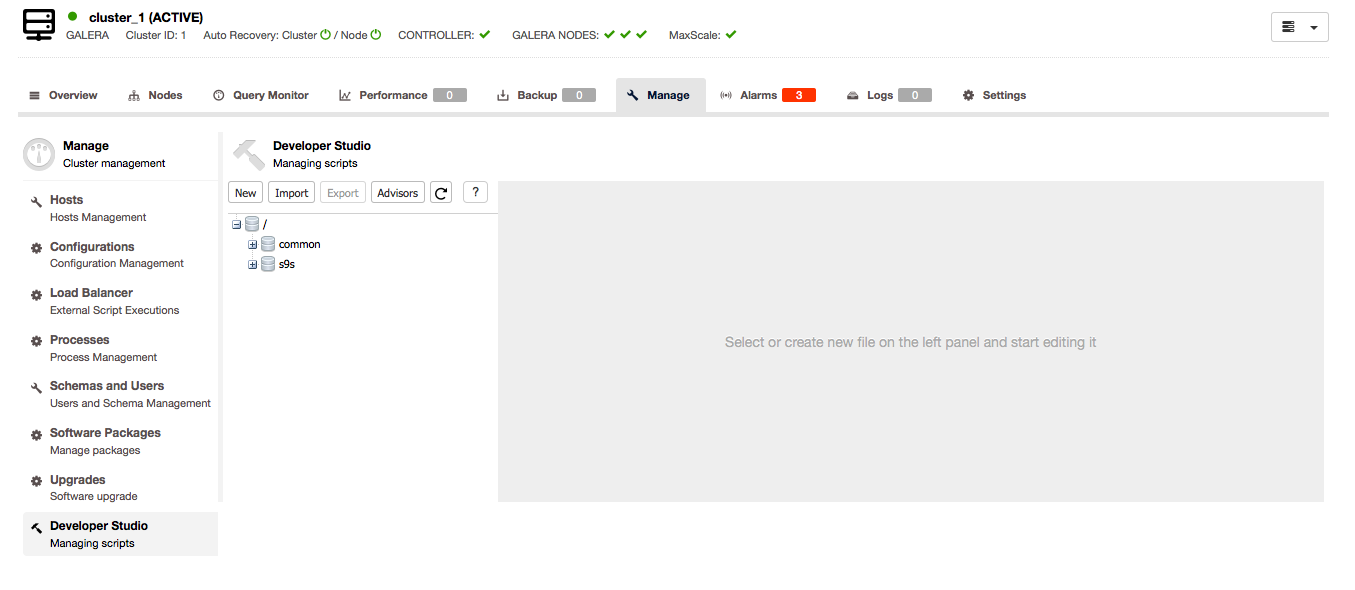
The Developer Studio interface can be found under Cluster > Manage > Developer Studio. This will open an interface like this:

Advisors

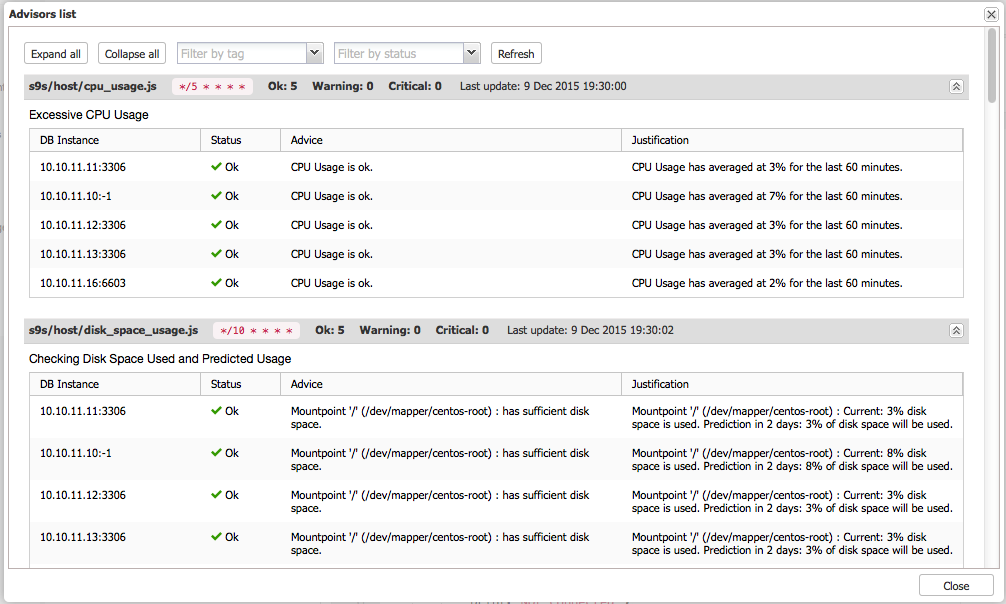
The advisors button will generate an overview of all advisors with their output since the last time they ran:

You can also see the schedule of the advisor in crontab format and the date/time since the last update. Some advisors are scheduled to run only once a day so their advice may no longer reflect the reality, for instance if you already resolved the issue you were warned about. You can manually re-run the advisor by selecting the advisor and run it. Go to the “compile and run” section to read how to do this.

Importing advisors

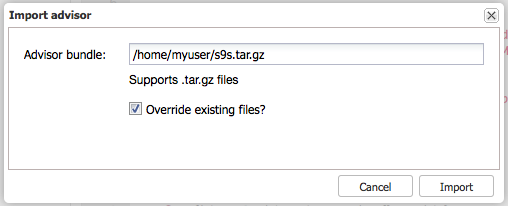
The Import button will allow you to import a tarball with new advisors in them. The tarball has to be created relative to the main path of the advisors, so if you wish to upload a new version of the MySQL query cache size script (s9s/mysql/query_cache/qc_size.js) you will have to make the tarball starting from the s9s directory.

By default the import will create all (sub)folders of the import but not overwrite any of the existing advisors. If you wish to overwrite them you have to select the “Overwrite existing files” checkbox.

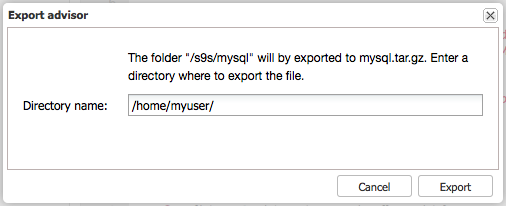
Exporting advisors

You can export the advisors or a part of them by selecting a node in the tree and pressing the Export button. This will create a tarball with the files in the full path of the structure presented. Suppose we wish to make a backup of the s9s/mysql advisors prior to making a change, we simply select the s9s/mysql node in the tree and press Export:

Note: make sure the s9s directory is present in /home/myuser/.

This will create a tarball called /home/myuser/s9s/mysql.tar.gz with an internal directory structure s9s/mysql/*

Creating a new advisor

Since we have covered exports and imports, we can now start experimenting. So let’s create a new advisor! Click on the New button to get the following dialogue:

In this dialogue, you can create your new advisor with either an empty file or pre fill it with the Galera or MySQL specific template. Both templates will add the necessary includes (common/mysql_helper.js) and the basics to retrieve the Galera or MySQL nodes and loop over them.

Creating a new advisor with the Galera template looks like this:

#include "common/mysql_helper.js"

Here you can see that the mysql_helper.js gets included to provide the basis for connecting and querying MySQL nodes.

var WARNING_THRESHOLD=0;
…
if(threshold > WARNING_THRESHOLD)

The warning threshold is currently set to 0, meaning if the measured threshold is greater than the warning threshold, the advisor should warn the user. Note that the variable threshold is not set/used in the template yet as it is a kickstart for your own advisor.

var hosts     = cluster::Hosts();
var hosts     = cluster::mySqlNodes();
var hosts     = cluster::galeraNodes();

The statements above will fetch the hosts in the cluster and you can use this to loop over them. The difference between them is that the first statement includes all non-MySQL hosts (also the CMON host), the second all MySQL hosts and the last one only the Galera hosts. So if your Galera cluster has MySQL asynchronous read slaves attached, those hosts will not be included.

Other than that these objects will all behave the same and feature the ability to read their variables, status and query against them.

Advisor buttons

Now that we have created a new advisor there are six new button available for this advisor:

Save will save your latest modifications to the advisor (stored in the CMON database), Move will move the advisor to a new path and Remove will obviously remove the advisor.

More interesting is the second row of buttons. Compiling the advisor will compile the code of the advisor. If the code compiles fine, you will see this message in the Messages dialogue below the code of the advisor:

While if the compilation failed, the compiler will give you a hint where it failed:

In this case the compiler indicates a syntax error was found on line 24.

The compile and run button will not only compile the script but also execute it and its output will be shown in the Messages, Graph or Raw dialogue. If we compile and run the table cache script from the auto_tuners, we will get output similar to this:

Last button is the schedule button. This allows you to schedule (or unschedule) your advisors and add tags to it. We will cover this at the end of this post when we have created our very own advisor and want to schedule it.

My first advisor

Now that we have covered the basics of the ClusterControl Developer Studio, we can now finally start to create a new advisor. As an example we will create a advisor to look at the temporary table ratio. Create a new advisor as following:

The theory behind the advisor we are going to create is simple: we will compare the number of temporary tables created on disk against the total number of temporary tables created:

tmp_disk_table_ratio = Created_tmp_disk_tables / (Created_tmp_tables + Created_tmp_disk_tables) * 100;

First we need to set some basics in the head of the script, like the thresholds and the warning and ok messages. All changes and additions have been marked in bold:

var WARNING_THRESHOLD=20;
var TITLE="Temporary tables on disk ratio";
var ADVICE_WARNING="More than 20% of temporary tables are written to disk. It is advised to review your queries, for example, via the Query Monitor.";
var ADVICE_OK="Temporary tables on disk are not excessive." ;

We set the threshold here to 20 percent which is considered to be pretty bad already. But more on that topic once we have finalised our advisor.

Next we need to get these status variables from MySQL. Before we jump to conclusions and execute some “SHOW GLOBAL STATUS LIKE ‘Created_tmp_%’” query, there is already a function to retrieve the status variable of a MySQL instance:

statusVar = readStatusVariable(host, <statusvariablename>);

We can use this function in our advisor to fetch the Created_tmp_disk_tables and Created_tmp_tables.

for (idx = 0; idx < hosts.size(); ++idx)
{
   host        = hosts[idx];
   map         = host.toMap();
   connected     = map["connected"];
   var advice = new CmonAdvice();
   var tmp_tables = readStatusVariable(host, ‘Created_tmp_tables’);
   var tmp_disk_tables = readStatusVariable(host, ‘Created_tmp_disk_tables’);

And now we can calculate the temporary disk tables ratio:

var tmp_disk_table_ratio = tmp_disk_tables / (tmp_tables + tmp_disk_tables) * 100;

And alert if this ratio is greater than the threshold we set in the beginning:

if(checkPrecond(host))
{
   if(tmp_disk_table_ratio > WARNING_THRESHOLD) {
      advice.setJustification("Temporary tables written to disk is excessive");
      msg = ADVICE_WARNING;
   }
   else {
      advice.setJustification("Temporary tables written to disk not excessive");
      msg = ADVICE_OK;
   }
}

It is important to assign the Advice to the msg variable here as this will be added later on into the advice object with the setAdvice function. The full script for completeness:

#include "common/mysql_helper.js"

/**
* Checks the percentage of max ever used connections
*
*/
var WARNING_THRESHOLD=20;
var TITLE="Temporary tables on disk ratio";
var ADVICE_WARNING="More than 20% of temporary tables are written to disk. It is advised to review your queries, for example, via the Query Monitor.";
var ADVICE_OK="Temporary tables on disk are not excessive.";

function main()
{
   var hosts     = cluster::mySqlNodes();
   var advisorMap = {};

   for (idx = 0; idx < hosts.size(); ++idx)
   {
       host        = hosts[idx];
       map         = host.toMap();
       connected     = map["connected"];
       var advice = new CmonAdvice();
       var tmp_tables = readStatusVariable(host, 'Created_tmp_tables');
       var tmp_disk_tables = readStatusVariable(host, 'Created_tmp_disk_tables');
       var tmp_disk_table_ratio = tmp_disk_tables / (tmp_tables + tmp_disk_tables) * 100;
       
       if(!connected)
           continue;

       if(checkPrecond(host))
       {
          if(tmp_disk_table_ratio > WARNING_THRESHOLD) {
              advice.setJustification("Temporary tables written to disk is excessive");
              msg = ADVICE_WARNING;
              advice.setSeverity(0);
          }
          else {
              advice.setJustification("Temporary tables written to disk not excessive");
              msg = ADVICE_OK;
          }
       }
       else
       {
           msg = "Not enough data to calculate";
           advice.setJustification("there is not enough load on the server or the uptime is too little.");
           advice.setSeverity(0);
       }

       advice.setHost(host);
       advice.setTitle(TITLE);
       advice.setAdvice(msg);
       advisorMap[idx]= advice;
   }

   return advisorMap;
}

Now you can play around with the threshold of 20, try to lower it to 1 or 2 for instance and then you probably can see how this advisor will actually give you advice on the matter.

As you can see, with a simple script you can check two variables against each other and report/advice based upon their outcome. But is that all? There are still a couple of things we can improve!

Improvements on my first advisor

The first thing we can improve is that this advisor doesn’t make a lot of sense. What the metric actually reflects is the total number of temporary tables on disk since the last FLUSH STATUS or startup of MySQL. What it doesn’t say is at what rate it actually creates temporary tables on disk. So we can convert the Created_tmp_disk_tables to a rate using the uptime of the host:

var tmp_disk_table_rate = tmp_disk_tables / uptime;

This should give us the number of temporary tables per second and combined with the tmp_disk_table_ratio, this will give us a more accurate view on things. Again, once we reach the threshold of two temporary tables per second, we don’t want to immediately send out an alert/advice.

Another thing we can improve is to not use the readStatusVariable function from the mysql_helper.js library. This function executes a query to the MySQL host every time we read a status variable, while CMON already retrieves most of them every second and we don’t need a real-time status anyway. It’s not like two or three queries will kill the hosts in the cluster, but if many of these advisors are run in a similar fashion, this could create heaps of extra queries.

In this case we can optimize this by retrieving the status variables in a map using the host.sqlInfo()function and retrieve everything at once as a map. This function contains the most important information of the host, but it does not contain all. For instance the variable uptime that we need for the rate is not available in the host.sqlInfo()map and has to be retrieved with the readStatusVariable function.

This is what our advisor will look like now, with the changes/additions marked in bold:

#include "common/mysql_helper.js"

/**
* Checks the percentage of max ever used connections
*
*/
var RATIO_WARNING_THRESHOLD=20;
var RATE_WARNING_THRESHOLD=2;
var TITLE="Temporary tables on disk ratio";
var ADVICE_WARNING="More than 20% of temporary tables are written to disk and current rate is more than 2 temporary tables per second. It is advised to review your queries, for example, via the Query Monitor.";
var ADVICE_OK="Temporary tables on disk are not excessive.";

function main()
{
   var hosts     = cluster::mySqlNodes();
   var advisorMap = {};

   for (idx = 0; idx < hosts.size(); ++idx)
   {
       host        = hosts[idx];
       map         = host.toMap();
       connected     = map["connected"];
       var advice = new CmonAdvice();
       var hostStatus = host.sqlInfo();
       var tmp_tables = hostStatus['CREATED_TMP_TABLES'];
       var tmp_disk_tables = hostStatus['CREATED_TMP_DISK_TABLES'];
       var uptime = readStatusVariable(host, 'uptime');
       var tmp_disk_table_ratio = tmp_disk_tables / (tmp_tables + tmp_disk_tables) * 100;
       var tmp_disk_table_rate = tmp_disk_tables / uptime;

       if(!connected)
           continue;

       if(checkPrecond(host))
       {
          if(tmp_disk_table_rate > RATE_WARNING_THRESHOLD && tmp_disk_table_ratio > RATIO_WARNING_THRESHOLD) {
              advice.setJustification("Temporary tables written to disk is excessive: " + tmp_disk_table_rate + " tables per second and overall ratio of " + tmp_disk_table_ratio);
              msg = ADVICE_WARNING;
              advice.setSeverity(0);
          }
          else {
              advice.setJustification("Temporary tables written to disk not excessive");
              msg = ADVICE_OK;
          }
       }
       else
       {
           msg = "Not enough data to calculate";
           advice.setJustification("there is not enough load on the server or the uptime is too little.");
           advice.setSeverity(0);
       }

       advice.setHost(host);
       advice.setTitle(TITLE);
       advice.setAdvice(msg);
       advisorMap[idx]= advice;
   }

   return advisorMap;
}

Scheduling my first advisor

After we have saved this new advisor, compiled it and run, we now can schedule this advisor. Since we don’t have an excessive workload, we will probably run this advisor once per day.

The base scheduling mode has every minute, 5 minutes, hour, day, month preset and this is exactly what we need. Changing this to advanced will unlock the other greyed out input fields. These input fields work exactly the same as a crontab, so you can even schedule for a particular day, day of the month or even set it on weekdays.

Blog category:

ClusterControl Developer Studio: creating advisors using the MySQL performance schema

$
0
0

In the previous blog post, we gave a brief introduction to ClusterControl Developer Studio and the ClusterControl Domain Specific Language that you can use to write your own scripts, advisors and alerts. We also showed how, with just 12 lines of code, you can create an advisor by using one of the ready made templates combined with existing database metrics collected by ClusterControl.

Today we are going one step further: we are going to retrieve data from the MySQL Performance Schema and use this in our advisor.

MySQL Performance Schema

The performance schema is basically a schema that exists in your MySQL instance. It is a special type of schema as it uses the so called PERFORMANCE_SCHEMA storage engine that interfaces with the performance data of your MySQL instance. This allows you to query for specific performance metrics and/or events that happen inside MySQL without locking up your database (e.g. SHOW ENGINE INNODB STATUS locks for a fraction of a second). The performance schema does have a drawback: it is at the cost of performance of your database and has an average of 5% to 10% performance penalty. Given the extra insights you will get from the database engine, and no longer need to lock the InnoDB engine every few seconds, this should actually pay off in the long run.

One of the prerequisites for our advisor is that we need to have the MySQL performance schema enabled, otherwise our queries will return empty results as the schema is empty. You can check if the performance schema is enabled on your host by executing the following command:

SHOW VARIABLES LIKE 'performance_schema';

If your host did not have the performance schema enabled you can do this by adding or modifying the following line in the [mysqld] section of your MySQL configuration:

performance_schema = 1

This obviously requires a restart of MySQL to become effective.

Available Performance Schema advisors in ClusterControl

ClusterControl ships, by default, a couple of advisors using the Performance Schema:

  • Processlist
  • Top accessed DB files
  • Top queries
  • Top tables by IOWait
  • Top tables by Lockwait

You can run and schedule these advisors if you have the Performance Schema enabled and they will give you great insight in what is happening inside your cluster. The source code can be found on our github page.

Adding custom advisors

Once the performance schema has been enabled, you should see data inside the performance_schema starting to accumulate. One of the tables we are interested in for this article is the one that keeps information about the indexes per table, per schema: table_io_waits_summary_by_index_usage

The information in this table is pretty interesting if you can keep track of the previous state, take the delta between the two and see the increase/decrease in efficiency. Most interesting metrics in this table are:

  • COUNT_STAR: total number of all IO operations (read + write)
  • COUNT_READ: total number of all read IO operations
  • COUNT_WRITE: total number of all write IO operations
  • AVG_TIMER_*: average time taken

However as the advisors only run infrequently and do not keep previous state, this would not be possible at the moment of writing. Therefore we will cover two advisors: unused indexes and queries that are not using indexes.

Unused indexes

We can extract different information from this table than just timers: we can find indexes that have not been touched as they did not receive any read, write or delete operations at all. The query to extract this information would be:

SELECT object_schema AS schema, object_name AS table, index_name AS index FROM performance_schema.table_io_waits_summary_by_index_usage WHERE index_name IS NOT NULL AND count_star = 0 AND object_schema != 'mysql' AND index_name != 'PRIMARY'

With this information we can run a daily advisor that extracts this information and advises you to look at this index and drop it if necessary. So in principle we simply have to loop over all hosts in the cluster and run this query.

Our new advisor will be based on the Generic MySQL template. So if you create the advisor please select the following:

Querying

At the top of our new advisor, we simply define our query since we don’t need any host specific information:

var query="SELECT `object_schema` AS `schema`, `object_name` AS `table`, `index_name` AS `index`""FROM `performance_schema`.`table_io_waits_summary_by_index_usage` ""WHERE `index_name` IS NOT NULL ""AND `count_star` = 0 ""AND `object_schema` != 'mysql'""AND `index_name` != 'PRIMARY'";

Now inside the host loop we first have to check if the Performance Schema is enabled, otherwise the query will fail and the advisor will output an error:

if (!readVariable(host, "performance_schema").toBoolean())
{
   print(host, ": performance_schema is not enabled.");
   continue;
}

Also inside the host loop, we run our query on each host:

result = getValueMap(host, query);

The function getValueMap is a predefined function in the mysql_helper.js that is included by default if you create a new MySQL or Galera advisor. This function will accept host and query as parameters and returns a map (array) per row with its columns. So, for example, if we wish to print the second column of the first row, we should do the following:

print(result[0][1]);

The getValueMap function returns false if there are no rows found, so we have to cover the case of all indexes being used.

if (result == false)
{
  msg = concatenate(msg, "No unused indexes found on this host.");
  advice.setJustification(ADVICE_OK);
  advice.setSeverity(Ok);
}

The message in the msg variable will be printed later as we may have to include additional information. As the message will be used in the advisors page, we have included HTML formatting here. We also have to set the right severity and justification per host whether there is an unused index present.

for (i=0; i<result.size(); ++i)
{
    msg = concatenate(msg, "Unused index found on table ", result[i][0], ".", result[i][1], ": index ", result[i][2], 
" can be dropped.<br/><br/>");
}
advice.setJustification(ADVICE_WARNING);
advice.setSeverity(Warning);

In the case of an unused index, it will output a message like this:
Unused index found on table sbtest.sbtest1: index k_1 can be dropped.

Scheduling

Now if we would schedule once per day, this advisor will run once a day and become available in the advisor page:

And after it has run successfully, we can see that it does work as expected:

Unused indexes - The complete advisor script

#include "common/mysql_helper.js"

/**
 * Checks the index usage and warns if there are unused indexes present
 * 
 */ 
var TITLE="Unused indexes";
var ADVICE_WARNING="Unused indexes have been found in your cluster. It is advised to drop them.";
var ADVICE_OK="No unused indexes found.";

var query="SELECT `object_schema` AS `schema`, `object_name` AS `table`, `index_name` AS `index`""FROM `performance_schema`.`table_io_waits_summary_by_index_usage` ""WHERE `index_name` IS NOT NULL ""AND `count_star` = 0 ""AND `object_schema` != 'mysql'""AND `index_name` != 'PRIMARY'";

function main()
{
    var hosts     = cluster::mySqlNodes();
    var advisorMap = {};

    for (idx = 0; idx < hosts.size(); ++idx)
    {
        host        = hosts[idx];
        map         = host.toMap();
        connected     = map["connected"];
        var advice = new CmonAdvice();

        if(!connected)
            continue;
        if (!readVariable(host, "performance_schema").toBoolean())
        {
            print(host, ": performance_schema is not enabled.");
            continue;
        }
        result = getValueMap(host, query);
        msg = concatenate("Server: ", host, "<br/>");
        msg = concatenate(msg, "------------------------<br/>");
        if (result == false)
        {
            msg = concatenate(msg, "No unused indexes found on this host.");
            advice.setJustification(ADVICE_OK);
            advice.setSeverity(Ok);
        }
        else
        {
            for (i=0; i<result.size(); ++i)
            {
                msg = concatenate(msg, "Unused index found on table ", result[i][0], ".", result[i][1], ": index ", result[i][2], " can be dropped.<br/><br/>");
            }
            advice.setJustification(ADVICE_WARNING);
            advice.setSeverity(Warning);
        }
        
        print(msg);
        advice.setHost(host);
        advice.setTitle(TITLE);
        advice.setAdvice(msg);
        advisorMap[idx]= advice;
    }
    return advisorMap;
}

Tables with no indexes used

Just like extracting the unused indexes from the Performance Schema, we can also find which tables have been accessed without using indexes.

SELECT `object_schema`, `object_name`, `count_star`, `count_read`, `count_write`, `count_delete` FROM performance_schema.table_io_waits_summary_by_index_usage WHERE index_name IS NULL AND count_star > 0 AND object_schema != 'mysql'

With this, we can run a daily advisor that extracts this information and advises you to look at the tables that have been queried without using an index. There could be various reasons why an index has not been used, for instance because the update query uses columns that have not been covered by any index.

Our new advisor will be based on the Generic MySQL template, but you could as well copy the previous advisor and adapt it.

Querying

At the top of our new advisor, we define again our query since we don’t need any host specific information:

var query = "SELECT `object_schema`, `object_name`, `count_star`, `count_read`, `count_write`, `count_delete` FROM performance_schema.table_io_waits_summary_by_index_usage WHERE index_name IS NULL AND count_star > 0 AND object_schema != 'mysql'";

The code for this advisor will be almost entirely similar to the unused indexes example as we will yet again loop over all hosts in the cluster and check on the indexes. The major difference is the way we interpret and show the data:

for (i=0; i<result.size(); ++i)
{
    msg = concatenate(msg, "Table has been queried without using indexes: ", result[i][0], ".", result[i][1], " with a total of ", result[i][2], " IO operations (", result[i][3], " Read / ", result[i][4]," Write / ", result[i][5], " Delete)<br/><br/>");
}
advice.setJustification(ADVICE_WARNING);
advice.setSeverity(Warning);

Keep in mind that the information created by this query does not tell us what the exact cause is, it is just an indicator that there is an inefficient table that has X amount of iops specified by read, write and delete operations. Further investigation is necessary.

Scheduling

Similarly as the Unused Indexes advisor, we would schedule this advisor once a day and make it available inside the advisor page:

And after it has ran successfully, we can see that it does work as expected:

Complete advisor script - Tables with no indexes used

#include "common/mysql_helper.js"

/**
 * Checks the index usage and warns if there are unused indexes present
 * 
 */ 
var TITLE="Table access without using index";
var ADVICE_WARNING="There has been access to tables without using an index. Please investigate queries using these tables using a query profiler.";
var ADVICE_OK="All tables have been accessed using indexes.";

var query = "SELECT `object_schema`, `object_name`, `count_star`, `count_read`, ""`count_write`, `count_delete` ""FROM performance_schema.table_io_waits_summary_by_index_usage ""WHERE index_name IS NULL ""AND count_star > 0 ""AND object_schema != 'mysql'";

function main()
{
    var hosts     = cluster::mySqlNodes();
    var advisorMap = {};

    for (idx = 0; idx < hosts.size(); ++idx)
    {
        host        = hosts[idx];
        map         = host.toMap();
        connected     = map["connected"];
        var advice = new CmonAdvice();

        if(!connected)
            continue;
        if (!readVariable(host, "performance_schema").toBoolean())
        {
            print(host, ": performance_schema is not enabled.");
            continue;
        }
        result = getValueMap(host, query);
        msg = concatenate("Server: ", host, "<br/>");
        msg = concatenate(msg, "------------------------<br/>");
        if (result == false)
        {
            msg = concatenate(msg, "No tables have been queried without indexes.");
            advice.setJustification(ADVICE_OK);
            advice.setSeverity(Ok);
        }
        else
        {
            for (i=0; i<result.size(); ++i)
            {
                msg = concatenate(msg, "Table has been queried without using indexes: ", result[i][0], ".", result[i][1], " with a total of ", result[i][2], " IO operations (", result[i][3], " Read / ", result[i][4]," Write / ", result[i][5], " Delete)<br/><br/>");
            }
            advice.setJustification(ADVICE_WARNING);
            advice.setSeverity(Warning);
        }
        
        print(msg);
        advice.setHost(host);
        advice.setTitle(TITLE);
        advice.setAdvice(msg);
        advisorMap[idx]= advice;
    }
    return advisorMap;
}

Advisor repository

All our advisors are freely available through the Advisor Github repository and the two custom advisors are also made available through the repository. We encourage you to share the advisors you have written yourself as they may benefit other ClusterControl users as well.

If you have a Github account you can share back by forking our repository, check in your changes and create a pull request for us. If you don’t have a Github account, you can paste a link to your advisor in the comments section of this blog or email it to us.

Blog category:

Syslog Plugin for ClusterControl

$
0
0

Logging is a fundamental tool for the system administrator. It helps identify whether systems are running as configured, and track any unusual activity when trying to diagnose and isolate problems. Without even basic logging, when something unexpected happens, you could experience excessive downtime due to the lack of diagnostic data.

Syslog is a widely used standard for message logging. A centralized syslog server, where you can analyze logs of your infrastructure in one place, can greatly improve your visibility into what is going on. It is possible to have ClusterControl alarms sent to syslog via a syslog plugin. In this blog post, we will show you how to install this plugin. More plugins and integrations can be found on our Tools page.

What is syslog?

In a Linux operating system, the kernel and other internal components generate alerts and messages. These messages are typically stored in a file system or relayed to another device in the form of syslog messages. An internal daemon, called Syslogd, handles the syslog process. Syslog is widely used, and provides a central point for collecting and processing system logs. These system logs are useful later for troubleshooting and auditing.

The Syslog protocol is supported by a wide range of devices and can be used to log different types of events. Syslog is able to:

  • accept inputs from a wide variety of sources
  • transform them
  • and output the results to diverse destinations

Syslog consists of three basic components:

  1. Device: This is the equipment that generates log messages, this could be a server, router, firewall, or any other device that can generate syslog event data.
  2. Collector: This equipment is configured to receive messages generated by a log device where it will subsequently store these externally generated messages local to itself.
  3. Relay: Like a log collector it is configured to receive messages, these messages are not stored but forwarded to another device, usually a log collector but could be another relay.

Nowadays, most of Linux boxes come with syslog configured for local logging only and will not accept or process any messages from outside sources. In a local logging configuration the host performs both roles of device and collector, messages generated by the system are directed to the syslog process which routes these messages to a local destination on the host machine based on the rules set in a file /etc/syslog.conf.

ClusterControl Syslog Plugin

This plugin writes the new alarms instantly to the syslog, by default it would be /var/log/syslog on Debian-based systems or /var/log/messages on Redhat-based systems on the local host. If you have remote syslog configured for central log management, you can leverage this capability to capture ClusterControl alarms and process them. You can then use the information for things like a system health check, triggering an alert, intrusion detection or security audit purposes.

To install the plugin, simply do the following 4 steps on ClusterControl node:

  1. Create the ClusterControl plugin directory. We will use the default location which is /var/cmon/plugins:

    $ mkdir -p /var/cmon/plugins
  2. Grab the plugin from our s9s-admin Github repository:

    $ git clone https://github.com/severalnines/s9s-admin
  3. Copy it over to the plugin directory:

    $ cp s9s-admin/plugins/syslog/syslog.py /var/cmon/plugins/
  4. Restart CMON to load the plugin:

    $ service cmon restart

That’s it. Now you will get a copy of alarms triggered by ClusterControl in the local syslog. You can verify this with the following command on Debian:

$ tail -f /var/log/syslog
Jan 14 04:01:42 cc-server cmon-syslog-plugin: cluster-1, new alarm: MySQL server disconnected (id=573205676966301289)
Jan 14 04:20:31 cc-server cmon-syslog-plugin: cluster-1, new alarm: SSH failed (id=6970644932146548621)

For RHEL based systems, you can find them at /var/log/messages:

$ tail -f /var/log/messages
Jan 14 04:01:42 cc-server cmon-syslog-plugin: cluster-1, new alarm: MySQL server disconnected (id=573205676966301289)
Jan 14 04:20:31 cc-server cmon-syslog-plugin: cluster-1, new alarm: SSH failed (id=6970644932146548621)

To learn more on how ClusterControl plugin is executed, please refer to this blog post under ‘How does the plugin execute’ section. That’s all folks!

Blog category:


Integrating ClusterControl Alarms with Splunk

$
0
0

Splunk is a popular log management tool for our syslog facility. In this blog, we will show you how to integrate ClusterControl alarms with Splunk.

We are going to forward the alarm event through the ClusterControl syslog plugin, where the rsyslog client will forward it over to Splunk via UDP port 514. We will then create an alert in Splunk based on the specific search term.

**For the purpose of this blog post, we are using UDP as the transport protocol. Note that UDP is a connectionless, unreliable protocol that does not guarantee message delivery. If a message gets lost, neither the log device nor the collector is going to know or care. You can use TCP as alternative.

Here is our simple architecture:

On the ClusterControl node, install rsyslog (if not installed) so we can forward the syslog to Splunk.

  1. Install rsyslog on ClusterControl node:

    $ yum install rsyslog # RHEL/CentOS
    $ apt-get install rsyslog # Debian/Ubuntu
  2. Then append the following line into /etc/rsyslog.conf under “catch-all” log files section (line 94):

    *.* @192.168.55.119:514
  3. Restart syslog to load the new configuration:

    $ systemctl restart syslog
  4. Configure Splunk to listen to incoming syslog on UDP port 514. Go to Splunk > Settings > Data inputs > UDP > New and specify as per below:

    Click ‘Next’. In the ‘Input Settings’, choose syslog as the ‘Source type’ and leave everything default. Then, click ‘Review’ and ‘Submit’. Splunk is now capturing the syslog data sent by ClusterControl server. If there are new alarms raised by ClusterControl, you can retrieve them directly from Splunk > App > Search & Reporting and look up for “cmon-syslog-plugin” and you should see something like below:

Creating a Simple Alert with Splunk

From the search result shown above, we can ask Splunk to send an alert if it finds a specific pattern in the incoming syslog. For example, to get an alert after a new alarm is raised when a MySQL server is down, use the following search term:
“cmon-syslog-plugin AND new alarm AND MySQL server disconnected”

You should get the following result (if the alarm is raised by ClusterControl):

Click on Save As > Alert and configure the settings with alert type ‘Real-time’:

Click Save and you will get an alert if the same alarm raises again.

Splunk can also handle various alert actions like email, running a script, webhook and also through third-party apps integration like SMS alerting via Twillio, Slack notification, Twitter and more. The integration step above are similar if you are running on other log management tools like Logstash stack (with Kibana and ElasticSearch), SumoLogic or Loggly.

That’s it. Happy alerting!

Blog category:
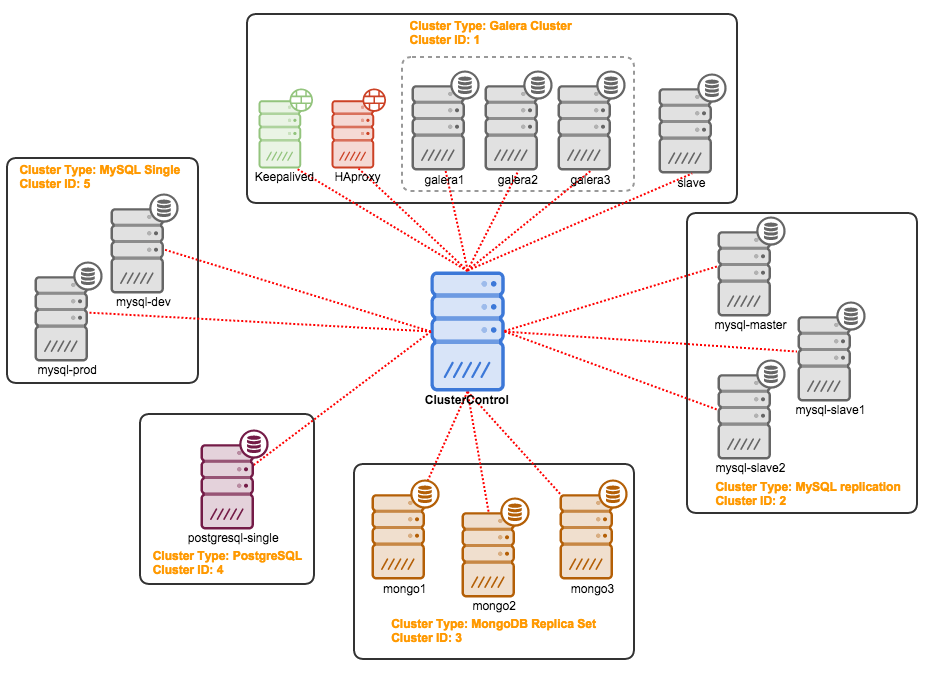
Webinar Replay & Slides: Managing MySQL Replication for High Availability

$
0
0

Thanks to everyone who participated in this week’s live webinar on Managing MySQL Replication for High Availability led by our colleague Krzysztof Książek, Senior Support Engineer at Severalnines. The webinar included theory discussions bundled with live demo demonstrations on all of the key elements that were discussed, which made for a nicely interactive webinar to watch.

If you missed the session and/or would like to watch the replay and read through the slides in your own time, they are now available online for sign up and viewing.

Whether you’re looking into deploying a MySQL Replication topology or maintaining one, you’ll find great insight here about topology changes, managing slave lag, promoting slaves, repairing replication issues, fixing broken nodes, managing schema changes and scheduling backups. Multi-datacenter replication was also covered.

Replay details

Get access to the replay here

Read the slides here

Get access to all of our replays here

Agenda

View the full agenda here!

Speaker

Krzysztof Książek, Senior Support Engineer at Severalnines, is a MySQL DBA with experience managing complex database environments for companies like Zendesk, Chegg, Pinterest and Flipboard. This webinar builds upon recent blog posts and related webinar series by Krzysztof on how to become a MySQL DBA.

If you have any questions or would like a personalised live demo, please do contact us.

Follow our technical blogs here: http://severalnines.com/blog

Blog category:

High availability read-write splitting with php-mysqlnd, MySQL Replication and HAProxy

$
0
0

MySQL Replication is used in a variety of use cases - scale out read workloads, provide high availability and geographic redundancy, offload backups and reporting/analytic jobs. However it has a big drawback - the application needs to be able to send writes to the master only. Updating more than one master in a replication setup can result in data inconsistency and cause replication to break.

An SQL-aware load balancer like MaxScale could help here, as it could redirect SQL to the appropriate node. If you are using HAProxy and the application is written in PHP, read-write splitting is still achievable with the PHP MySQL native driver with master slave plugin (aka php-mysqlnd_ms). The driver can perform the read-write splitting, as well as load balancing and failover. There are advantages for having a load balancer as well though. php-mysqlnd_ms also has experimental support for multi-master replication setups like Galera or MMM.

In this blog post, we explore the use of php-mysqlnd_ms with a PHP application (Wordpress) on a standard MySQL Replication backend.

Why add HAProxy between php-mysqlnd and MySQL?

The suggestion here is to use HAProxy between the PHP driver and MySQL, as it provides a single point access to the application, routes queries to the backend MySQL servers and also takes care of the master slave health checks. The reason behind this is to minimize the changes that need to be done on the php-mysqlnd configuration file residing on each application server. Especially important during dynamic replication topology changes, e.g., when a new slave is added or removed from the setup. If you have many application/web servers that connects to a single replication setup or the database servers are hosted in a dynamic environment that is constantly changing (e.g Docker, cloud instances), then this setup might be what you are looking for.

Our architecture looks like this:

The PHP application (Wordpress) is hosted on the web server,  and php-mysqlnd_ms will redirect writes to the HAProxy node on port 3307 while reads are redirected to port 3308. A hot-standby HAProxy instance is coupled with Keepalived to provide a virtual IP address. The web server connects to the virtual IP address on the respective port as a single access point to our MySQL Replication setup. All nodes in this setup are running on Debian 8 (Jessie).

Deploying MySQL Replication

We use ClusterControl to deploy a three node MySQL Replication with two slaves. Install ClusterControl and go to “Create Database Node”. In this dialog, we are going to create a MySQL Replication master node. Specify the required information and click “Deploy”:

Once added, we will use “Add Node” function to add one slave at a time:

Repeat the above step for the second slave. At the end of the deployment, you should see something like the below in ClusterControl’s summary bar. You should see one master node and two slaves:

Deploying HAProxy and Configuring Health Checks

ClusterControl supports deployment of HAProxy and Keepalived. For MySQL Replication, ClusterControl by default uses a script called mysqlchk located at /usr/local/sbin/mysqlchk on the every database node to run a simple ‘select 1’ health check. The script doesn’t produce an accurate health check result and can’t distinguish whether the database node is a healthy master or slave.

We have to come out with a better health check that suits HAProxy. For the purpose of this blog post, we have built a custom health check script. The script detects the MySQL replication role on the database node as per below:

  • if master (SHOW SLAVE STATUS > 1 AND read_only = OFF)
    • return 'MySQL master is running.'
  • if slave (Slave_IO_Running = Yes AND Slave_SQL_Running = Yes AND (Seconds_Behind_Master = 0 OR Seconds_Behind_Master < SLAVE_LAG_LIMIT))
    • return 'MySQL slave is running. (slave lag: 0)'
  • else
    • return 'MySQL is *down*'

Note that the assigned mysql user must have at least REPLICATION CLIENT and REPLICATION SLAVE in order for the script to report correctly.

  1. Before the deployment begins, run the following command on the ClusterControl node to replace the health check template for MySQL Replication:

    $ wget https://raw.githubusercontent.com/ashraf-s9s/mysqlchk/master/mysqlchk.mysql -O /usr/share/cmon/templates/mysqlchk.mysql
  2. Now we are good to deploy the two HAProxy instances. Ensure the role for all nodes are set to Active and click on ‘Install HAProxy’ to start the installation:

    Repeat the above step for the second HAproxy node.

  3. To make HAProxy work with MySQL Replication, two HAProxy listeners (3307 for writes, 3308 for reads) are required. We also have to use tcp-check to distinguish whether the backend node is a healthy master or slave. To achieve this, we need to perform some modification to the installed HAProxy configuration file located at /etc/haproxy/haproxy.cfg of the load balancer nodes.

    Ensure you have the following configuration lines in haproxy.cfg on both load balancer nodes:

    listen  haproxy_192.168.55.110_3307
            bind *:3307
            mode tcp
            timeout client  10800s
            timeout server  10800s
            balance leastconn
            option tcp-check
            tcp-check expect string MySQL\ master
            option allbackups
            default-server port 9200 inter 2s downinter 5s rise 3 fall 2 slowstart 60s maxconn 64 maxqueue 128 weight 100
            server 192.168.55.111 192.168.55.111:3306 check
            server 192.168.55.112 192.168.55.112:3306 check
            server 192.168.55.113 192.168.55.113:3306 check
    
    listen  haproxy_192.168.55.110_3308
            bind *:3308
            mode tcp
            timeout client  10800s
            timeout server  10800s
            balance leastconn
            option tcp-check
            tcp-check expect string is\ running.
            option allbackups
            default-server port 9200 inter 2s downinter 5s rise 3 fall 2 slowstart 60s maxconn 64 maxqueue 128 weight 100
            server 192.168.55.111 192.168.55.111:3306 check
            server 192.168.55.112 192.168.55.112:3306 check
            server 192.168.55.113 192.168.55.113:3306 check

    ** The use of ‘option tcp-check’ and ‘tcp-check expect’ is vital here. This is how HAProxy is capable to route the incoming query to the correct backend server. Writes are redirected to the node which report ‘MySQL master is running’ (therefore the expected string is “MySQL\ master”). Reads are redirected to the nodes which contain “is\ running” in the return string, to include master (‘MySQL master is running’) and all slaves (‘MySQL slave is running’) in the read-only load balancing set.

  4. Then, deploy Keepalived with virtual IP address 192.168.55.100 via ClusterControl > Actions > Add Load Balancer > Install Keepalived:

    At this point, all nodes have been deployed correctly - as indicated by the green ticks in the summary bar:

Database and load balancer tiers are now deployed. Let’s move to the application tier.

Deploying Web Server and Configuring php-mysqlnd for Master Slave

The following steps should be performed on the web/application server:

  1. Install Apache web server and PHP 5 packages:

    $ apt-get install apache2 libapache2-mod-php5 php5-common php5-gd php5-json php5-curl php5-mysqlnd php-pear php5-dev
  2. Install mysqlnd_ms module through PECL:

    $ pecl install mysqlnd_ms
  3. Create a configuration file for mysqlnd_ms:

    $ vi /etc/php5/mods-available/mysqlnd_ms.ini

    Add the following line:

    ; configuration for php MySQL module
    ; priority=40
    extension=mysqlnd_ms.so
    mysqlnd_ms.enable=1
    mysqlnd_ms.config_file=/etc/php5/mods-available/mysqlnd_ms.json

    **We are using priority=40 since it requires php-mysqlnd module to be loaded first.

  4. Enable the module:

    $ php5enmod mysqlnd_ms
  5. Create the mysqlnd_ms.json configuration file

    $ vi /etc/php5/mods-available/mysqlnd_ms.json

    Add the following lines:

    {
           "wordpress_ms": {
                   "master": {
                           "master_0": {
                                   "host": "192.168.55.100",
                                   "port": "3307",
                                   "user": "wpress",
                                   "password": "password",
                                   "db": "wpress"
                           }
                   },
                   "slave": {
                           "slave_0": {
                                   "host": "192.168.55.100",
                                   "port": "3308",
                                   "user": "wpress",
                                   "password": "password",
                                   "db": "wpress"
                           }
                   }
           }
    }

    We defined the application name as “wordpress_ms”, this value will be used to replace the ‘host’ value in MySQL function call. The master section provides information about the MySQL master - we forward writes to the virtual IP address on the HAProxy node, on port 3307. HAProxy will automatically discover the correct master to send the writes to. The slave section provides information for MySQL slaves - we forward reads to the virtual IP address on the HAProxy node, on port 3308. HAProxy will then automatically discover which nodes available to send the reads to.

  6. The JSON configuration file must be accessible by the Apache user, in this case we are using the default www-data. Apply correct ownership on the config file:

    $ chown www-data.www-data /etc/php5/mods-available/mysqlnd_ms.json

Now we are ready to deploy Wordpess with MySQL Replication as the database backend.

Installing Wordpress

When installing Wordpress, specify the mysqlnd_ms application name (wordpess_ms) as the Database Host value:

That’s it! You are now running Wordpress with read-write splitting on top of MySQL Replication.

Testing

Writes are done on the master server only. If the master fails, replication will stop. Failover must be done by promoting the most updated slave, before replication can resume. Applications doing updates must then reconnect to the newly promoted master and then continue to operate.

If the master (192.168.55.111) is down, we need to promote one of the slaves (192.168.55.112) to new master. To achieve this, go to ClusterControl > Nodes > choose 192.168.55.112 > Promote Slave:

Once selected, click ‘Execute’. You will be prompted with the following:

Once the selected slave has become the new master, the other slaves will automatically failover to the new master and continue to get updates while the old master is down. When the old master comes up again, it will take the role of a slave and synchronize with the new master (which is handling application updates). This is orchestrated by ClusterControl. The following screenshot shows the old master (192.168.55.111) has became a slave in the replication chain:

Once the old master is up-to-date with the new master, the old master will remain as slave.

When a new master is promoted, HAProxy will automatically send the writes to the newly promoted node, as shown in the HAProxy stats page below:

This setup will require no changes on the application and load balancer tier if the replication topology changes. Easier to manage and less error prone. Happy read-write splitting!

Blog category:

February 23rd: how CloudStats.me moved from MySQL to clustered MariaDB for high availability

$
0
0

On Tuesday, February 23, please join us and the WooServers team for a webinar on the scalable, open source database infrastructure behind CloudStats.me.

CloudStats.me is a fast growing cloud-based server and website monitoring service. The rapid growth of the CloudStats user base and the number of services being monitored created a significant load on its MySQL infrastructure. The system ingests large amounts of incoming metrics/event data collected by thousands of agents. The backend systems also perform analytics on large portions of that data, and alerts are triggered as soon as certain conditions are met.

Andrey Vasilyev, CTO of Aqua Networks Limited - a London-based company which owns brands, such as WooServers.com, CloudStats.me and CloudLayar.com, and Art van Scheppingen, Senior Support Engineer at Severalnines, will discuss the challenges encountered by CloudStats.me in achieving database high availability and performance, as well as the solutions that were implemented to overcome these challenges.

Registration, Date & Time

Europe/MEA/APAC

Tuesday, February 23rd at 09:00 GMT / 10:00 CET (Germany, France, Sweden)
Register Now

North America/LatAm

Tuesday, February 23rd at 09:00 Pacific Time (US) / 12:00 Eastern Time (US)
Register Now

Agenda

  • CloudStats.me infrastructure overview
  • Database challenges
  • Limitations in cloud-based infrastructure
  • Scaling MySQL - many options
    • MySQL Cluster, Master-Slave Replication, Sharding, ...
  • Availability and failover
  • Application sharding vs auto-sharding
  • Migration to MariaDB / Galera Cluster with ClusterControl & NoSQL
  • Load Balancing with HAProxy & MaxScale
  • Infrastructure set up provided to CloudStats.me
    • Private Network, Cluster Nodes, H/W SSD Raid + BBU
  • What we learnt - “Know your data!”


Speakers

Andrey Vasilyev is the CTO of Aqua Networks Limited - a London-based company which owns brands, such as WooServers.com, CloudStats.me and CloudLayar.com. Andrey has been leading the company’s new product development initiatives for 5 years and worked closely with the development and sales teams helping turn customer feedback into mass-market products. Having previously worked at Bloomberg L.P. and UniCredit Bank, Andrey’s main focus has always been on building stable and reliable platforms capable of serving hundreds of thousands of users.

Art van Scheppingen is a Senior Support Engineer at Severalnines. He’s a pragmatic MySQL and Database expert with over 15 years experience in web development. He previously worked at Spil Games as Head of Database Engineering, where he kept a broad vision upon the whole database environment: from MySQL to Couchbase, Vertica to Hadoop and from Sphinx Search to SOLR. He regularly presents his work and projects at various conferences (Percona Live, FOSDEM) and related meetups.

We look forward to “seeing” you there and to some good discussions!

For more discussions on database clustering and high availability strategies, do visit our Webinars Replay page.

Blog category:

How to build scalable database infrastructures with MariaDB & HAProxy: sign up for our webinar with WooServers

$
0
0

There’s still time to sign up for our webinar on Tuesday next week, February 23rd, on the scalable, open source database infrastructure behind CloudStats.me. Our friends from WooServers will be giving an overview of their project at cloudstats.me and discussing their past infrastructure challenges of scaling MySQL “write” performance with minimal cost, performance overhead and database management burden. The session will cover how they came to choose a MariaDB with MaxScale and HAProxy clustering solution, and how they leveraged ClusterControl. Sign up below:

Registration, Date & Time

Europe/MEA/APAC

Tuesday, February 23rd at 09:00 GMT / 10:00 CET (Germany, France, Sweden)
Register Now

North America/LatAm

Tuesday, February 23rd at 09:00 Pacific Time (US) / 12:00 Eastern Time (US)
Register Now

Agenda

  • CloudStats.me infrastructure overview
  • Database challenges
  • Limitations in cloud-based infrastructure
  • Scaling MySQL - many options
    • MySQL Cluster, Master-Slave Replication, Sharding, ...
  • Availability and failover
  • Application sharding vs auto-sharding
  • Migration to MariaDB / Galera Cluster with ClusterControl & NoSQL
  • Load Balancing with HAProxy & MaxScale
  • Infrastructure set up provided to CloudStats.me
    • Private Network, Cluster Nodes, H/W SSD Raid + BBU
  • What we learnt - “Know your data!”

Speakers

Andrey Vasilyev is the CTO of Aqua Networks Limited - a London-based company which owns brands, such as WooServers.com, CloudStats.me and CloudLayar.com. Andrey has been leading the company’s new product development initiatives for 5 years and worked closely with the development and sales teams helping turn customer feedback into mass-market products. Having previously worked at Bloomberg L.P. and UniCredit Bank, Andrey’s main focus has always been on building stable and reliable platforms capable of serving hundreds of thousands of users.

Art van Scheppingen is a Senior Support Engineer at Severalnines. He’s a pragmatic MySQL and Database expert with over 15 years experience in web development. He previously worked at Spil Games as Head of Database Engineering, where he kept a broad vision upon the whole database environment: from MySQL to Couchbase, Vertica to Hadoop and from Sphinx Search to SOLR. He regularly presents his work and projects at various conferences (Percona Live, FOSDEM) and related meetups.

We look forward to “seeing” you there and to some good discussions!

For more discussions on database clustering and high availability strategies, do visit our Webinars Replay page.

Blog category:

Viewing all 385 articles
Browse latest View live